
Abstract
The objective of this paper is to propose a novel approach to develop an algorithm for estimating the grounding force between a tyre and the road surface. First, a finite element model of a heavy-duty tyre is developed in this paper, and the validity of the model is verified by load application tests and mechanical vibration tests. When the tyres are operated under various operating conditions, that is, load, side deflection, side tilt and longitudinal slip conditions, the sensitivity analysis is performed by combining the three-directional forces based on the strain curves measured when the tyres are rolling, respectively. In order to achieve accurate estimation of the three-directional forces, this paper establishes a three-directional force estimation model using the support vector machine (SVM) technique, with the tyre force-sensitive eigenvalues as inputs and the tyre forces as outputs, so as to achieve the three-directional force estimation of the tyre-grounded three-directional forces. joint estimation of tyre-road contact force. The results show that the estimation error of vertical force is 1.79%, the estimation error of lateral force is 3%, the estimation error of longitudinal force is 4.65% and in general, the estimation error of grounding force is kept within 5%, and the estimation effect is good.
Keywords
Introduction
Tyre is the only part of many components on the vehicle that contacts with the road surface, the force and torque required for vehicle acceleration, steering and braking all come from the contact between the tyre and the road surface, therefore, comprehensively grasping the information of the vehicle during driving can effectively improve the control performance of the vehicle, which is closely related to the vehicle’s dynamics, smoothness and safety and other key indicators. However, tyres are only used as passive load-bearing and shock-absorbing components under the existing vehicle control technology, and at the same time, in the process of vehicle operation, a variety of active safety systems can not directly obtain the interaction force between tyres and road surface, tyre pressure and other key information.1,2
As a typical representative of smart tyre system, tyre pressure monitoring system has been developed into a mature technology, the corresponding algorithm is also more and more intelligent, through the monitoring of tyre inflation pressure and temperature, greatly improve the safety of automobile form and gradually become the standard configuration of domestic passenger cars .3,4 Some scholars loaded sensors on vehicles to develop different smart tyre systems, 5 based on the grounding characteristics of tyres in different working conditions, the data collected by the sensors for parameter identification and then use different estimation algorithms to achieve the estimation of tyre force . 6 According to different measurement principles, the commonly used sensor types are acceleration, strain, displacement, etc.
In recent years, acceleration sensors based on micro electrical systems have been widely used in the research and development of smart tyre systems. micro electro mechanical system (MEMS) acceleration has the advantages of small size, low cost and high measurement accuracy. The basic principle of the use of acceleration sensors to achieve tyre force estimation is: tyre rolling, fixed in the tyre liner acceleration sensors can be automatically collected by the deformation of the tyre generated by the triaxial acceleration signal, the signal analysis and processing, can be combined with the tyre deformation characteristics and grounding characteristics, so that through different algorithms to achieve the estimation of the tyre force, commonly used algorithms for estimation of polynomial fitting,7,8 neural network algorithms. 9
At the same time, thanks to the continuous development of flexible sensor technology, strain sensors are also used in the development of smart tyres, his estimation method is similar to the acceleration sensor, strain sensors are usually arranged in the circumferential direction and axial direction .10,11 In addition to this, some scholars based on the existing physical model for the development of smart tyre systems, this method can save a lot of time and expensive experimental expenditure, has more significant advantages, 12 however, although this method can be estimated to a certain extent, there are major limitations in the scope of application, especially in the face of extreme conditions such as large turns and longitudinal sliding, the accuracy of tyre force estimation is relatively low. Therefore, the contradiction between the complexity of the tyre dynamics model and the accuracy of tyre force estimation restricts the development of vehicle safety control technology.
This paper takes heavy-duty tyres as the research object and carries out the research on tyre force estimation of smart tyres under multiple working conditions. In addition, this study builds a monitoring system for smart tyres, which covers the strain signals at multiple points, and at the same time establishes an estimation model for the three-direction grounding force of heavy-duty tyres by combining the Gray Wolf Support Vector Machines, which realises the joint estimation of three-direction force of the tyres under the static loading, rolling, side deviation, longitudinal slip and composite working conditions.
Fine parametric modelling and validation of heavy-duty tyres
Taking 16.00R20 specification heavy-duty tyres as the research object, based on the mechanical tensile test to carry out the tyre rubber structure, skeleton material modelling, the use of finite element software Abaqus to construct a fine parametric finite element model of heavy-duty tyres; at the same time to grounding parameters, stiffness test and vibration characteristics to carry out the consistency of the finite element model with the entity of the tyre to verify;
Tyre has complex material properties, structural properties and mechanical properties, at the same time, its geometric nonlinearity, material nonlinearity and contact nonlinearity makes the tyre to carry out the real behaviour simulation is more difficult, if you follow the actual structure of the tyre one by one to build a model of each part of the tyre, the complexity of the required structural data and material data, the computational process is complex and difficult to convergence, therefore, this section considers the structural properties of the tyre without affecting the premise of the structural properties, mechanical properties, rationalisation of the tyre structure and mechanical properties of the tyre and the tyre model is not affected. Therefore, in this section, without affecting the structural and mechanical properties of the tyre, the tyre cord and tread pattern are reasonably simplified, and the mechanical properties of the tyre under the real behaviour are described based on the test data, and the finite element model with variable step length is established for a heavy-duty tyre with the specification of 16.00R20, and the modelling process is shown in Figure 1.

Flowchart of finite element model modelling of heavy-duty tyres with fine parameters.
In the deformation module, the Yeoh principal model was chosen to fit the typical ‘S’ shape stress-strain curve of rubber material during large deformation. At the same time, in the establishment of the three-dimensional finite element model of heavy-duty tyres, AutoCAD, Hyper Mesh, and Abaqus software are used to realise the establishment of the finite element model of 16.00R20 tyres, and the results are shown in Figure 2(a) and (b). In addition, a mechanical vibration experiment system for heavy-duty tyres was built, and this system was used to conduct tyre load application tests to obtain the grounding marks and sinkage of heavy-duty tyres under different loads. Meanwhile, a heavy-duty tyre modal test system was built in this study, using which force hammer hammering tests were conducted on tyres in a free state, and the eighth-order radial vibration pattern results of the tyres were extracted, and the experimental results were compared with the finite element simulation data, and the results are shown in Figure 3(a)–(d).

Heavy-duty tyre finite element model: (a) 2D cross-section model and (b) 3D finite element model.

Tyre model validation results: (a) test system used to apply loads to the tyre, (b) tyre shape at different vibration levels, (c) comparison of the finite element model and measured ground impressions of the tyre at different loads and (d) comparison of simulated versus actual tyre drop at different air pressures.
Since the authors’ team has completed the construction and validation of the 3D model of the tyre with variable step length in the previous stage, 13 the detailed work is not repeated here.
Figure 3 shows that:
(1) the consistency between the experimental and simulated modal results of tyres under different vibration levels is relatively high, and the maximum error of the corresponding eigenfrequency under the same vibration level is 5.49%;
(2) The shapes of the tyre grounding marks of the test and simulation under each load are highly similar, and the change trends of the grounding marks are the same;
(3) The test and simulated values of tyre drop height have the same trend of change, they both increase with the load and the maximum error between them is 7.79%.
In summary, the finite element model of tyre established in this paper can reliably respond to the real mechanical properties and deformation characteristics of the tyre, and the accuracy of the model is high, which can meet the needs of the subsequent research.
Multi-point strain-based intelligent tyre acquisition system
In the process of vehicle operation, only the tread of the tyre is in direct contact with the ground, and the signals obtained by installing sensors on the tread can most intuitively reflect the deformation and force of the tyre. However, the sensor signal on the tyre tread is more responsive to external interference factors, the signal curve characteristics are messy, and the sensor installation is difficult. At present, most scholars choose to instal the sensor on the inner liner of the tyre, 14 considering that the force and deformation of the tyre under static load and linear rolling are symmetrical about the centre line of the tread, as shown in Figure 4(a), D1 to D1′ is Tread, D1 to D2 is Shoulder, D2 to D3 is Side, and the following of D3 is Bead, and the present study Three points in the tread liner layer are selected as the strain sensor installation points, and the strain data are collected when the rolling speed of the tyre is 10, 20 and 30 km/h, respectively. The sensor installation points and the strain collection results are shown in Figure 4, and the ratio of the conversion of the voltage signal to the strain signal is 0.1 mv/με, and in the figure: t denotes the time, and the unit is second;

Intelligent tyre strain acquisition system: (a) points of strain sensors mounted on the tyre, (b) measured strain data of the tyre at different rolling speeds, (c) comparison of simulated, measured and filtered data of the strain data and (d) strain-based intelligent tyre acquisition system.
The strain data collected directly from the test bench is too much interference, and it needs to be filtered before use. Figure 4 shows that the strain data noise reduction processing has a better effect, and the similarity between the processed data and the simulation data is high, and the processed data can support the subsequent research.
Sensitivity analysis of three directional forces of intelligent tyre
Vertical force sensitivity analysis
Ground and strain characteristics analysis of heavy-duty tyres
The simulation of a stationary tyre under different vertical forces is carried out to extract the tyre grounded tread centre stresses for analysis, and the results are shown in Figure 5(a). In the figure: is the angle between the measured point position and the direction of the transverse axis through the centre of the finite element model.

Stress characteristics of the contact area between the tyre and the road: (a) stress of the tyre under different loads and (b) maximum stress value of tread centre line ground stress and tread centre point stress value change with load.
Figure 5(a) shows that: (1) as the tyre load increases, the maximum value of stress is shifted from the centre of the tread to both sides of the centre of the tread; and (2) the value of stress in the tyre-road contact region increases as a whole with the increase of load.
In order to explore the stress distribution in the contact area between the tyre and the road surface, the trend line of the maximum stress value is plotted as in Figure 5(b), which shows that: the grounding stress at the centre point of the grounding area and the maximum value of the grounding stress both increase rapidly and then decrease slowly, and the maximum value of the grounding stress is reached when the load is 28 kN; when the load is greater than 47 kN, the significant difference between the maximum value of the grounding stress and the centre point of the grounding stress begins to appear, and the shape of the grounding stress curve changes from an upward-convex parabolic curve to a convex parabolic one. The shape of the curve changes from an upwardly convex parabola to a saddle shape, and the point of maximum ground stress shifts from the centre to both sides.
The tyre pre-grounding angle

In this equation, R is the free radius of the tyre after inflation. The front and rear grounding angles are the same when the tyre is under static load condition, and the relationship between the two grounding angles can be expressed as
Grounding length error.

In order to further study the mechanical properties of tyres in contact with the ground, this paper extracts the circumferential strain curves of the inner liner of the tyre under different static load conditions with a standard tyre pressure of 0.8 MPa, and plots the curves shown in Figure 6(a), and at the same time extracts the eigenvalues of the strain curves, and plots the variation curves of the eigenvalues with the tyre loads, and the results are shown in Figure 6(b).

Strain characteristics of tyre grounded region: (a) circumferential strain curve of tyre grounded region at different loads and (b) variation of strain curve eigenvalues with loads.
Taking the peak, baseline and trough spacing angles of the strain curve as the characteristic values of the strain curve, the following features were found by analysing Figure 5(a), Table 1 and Figure 6.
(1) The baseline values of the circumferential strain curves do not change significantly due to the fact that the force in the non-contact area does not change. At the same time, the peak value of the strain curve shows a tendency to increase following the load drop;
(2) When the tyre load is greater than 47 kN, the change trend of the strain curve is consistent with that of the grounding stress curve, its peak value begins to decrease slowly and the strain curve near the grounding centre becomes saddle-shaped;
(3) The peak value of the circumferential strain curve increases rapidly to the maximum value with the load of the tyre and then decreases slowly, and its change trend is similar to that of the grounding stress curve.
(4) Under each load, the shape of the strain curve in the tyre-ground contact area is very similar to that of the stress curve;
Ground and strain characteristics analysis of heavy-duty tyres
Through the above analysis, it can be found that the two valley spacing angles of the circumferential strain curve of the tyre liner, the tyre grounding angle, and the length of the grounding mark are positively correlated with the vertical force, and the trends of the three curves are similar. In this paper, it is believed that the tyre grounding angle is closely related to the valley spacing angle of the circumferential strain curve, and the tyre grounding angle can be characterised by the characteristic parameters of the circumferential strain curve.
Through the finite element simulation of the static tyre model with a standard pressure of 0.8 MPa, the grounding angle can be compared with the valley spacing angle of the zero-order, first-order and second-order derivative curves of the circumferential strain and the results are shown in Figure 7 and Table 2, in which

Comparison between characteristic point angle difference and contact angle of circumferential strain curve of tyre inner liner.
Spacing angles of characteristic points of strain curves under different loads.
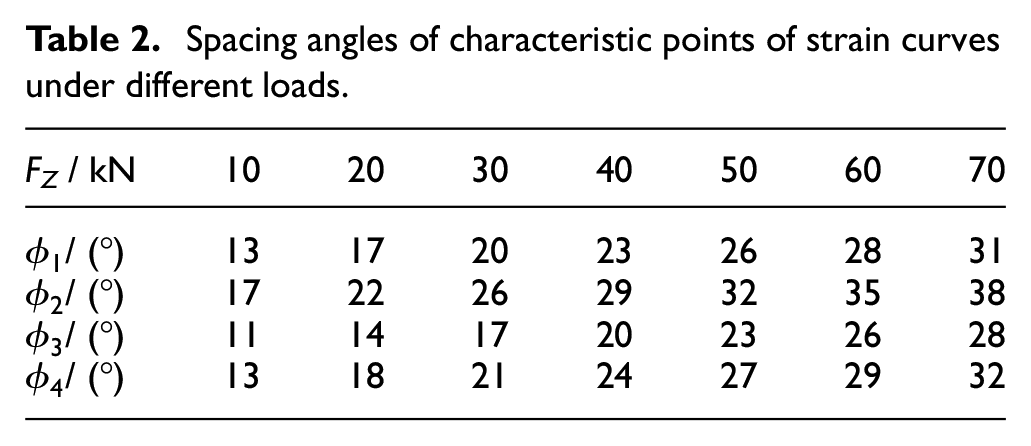
From Table 2, it can be seen that the circumferential strain curve valley spacing angle and strain second-order derivative peak spacing angle are greater than the grounding angle, the strain first-order curve peak-valley spacing angle is smaller than the grounding angle, and with the increase of vertical force, the greater the error, it can be seen that a class of strain curves alone is difficult to accurately characterise the grounding angle, so this paper chooses the average value of the spacing angle of the multiple species as a characterisation index of the grounding angle. As the grounding angle is sandwiched between the strain zero-order, first-order and second-order characteristic point spacing angle, the proposed average value of the characterisation index CA1, CA2, CA3, the use of formula (3) can be calculated for the grounding angle error were δ1, δ2, δ3, plotting as shown in Figure 8 of the grounding angle error histogram.

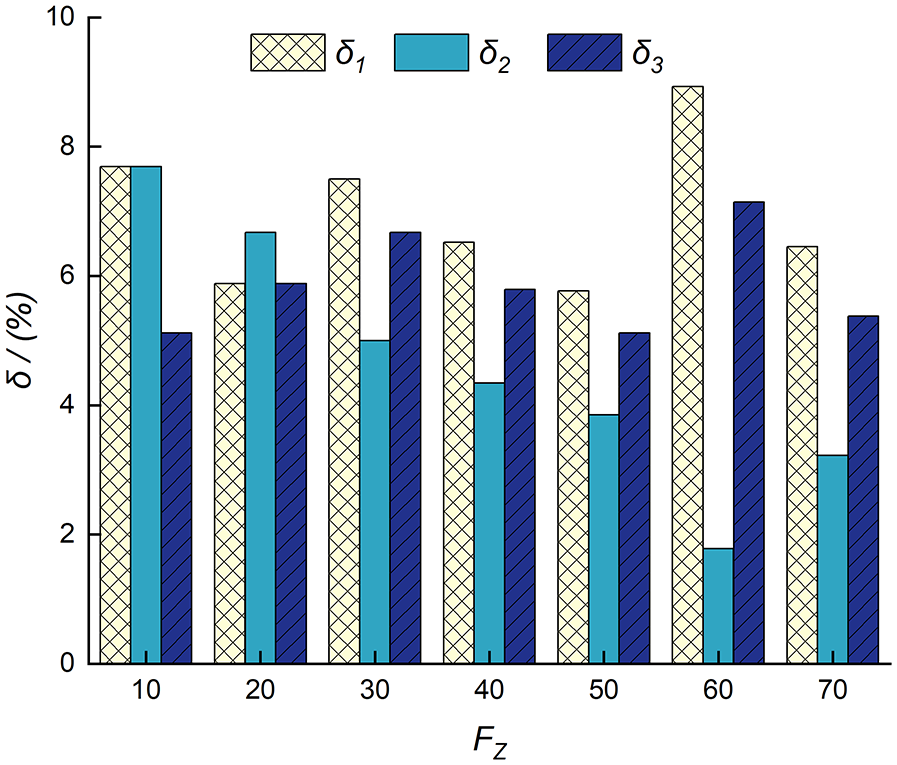
Errors in characterisation metrics for different vertical forces.
The analysis of Figure 8 shows that the three characterisation indexes have better characterisation effect on the grounding angle, CA1 and CA3 are more stable under different vertical forces, maintaining the error value within 5%–7%; the error value of the characterisation index CA2 can be maintained within 4% under the large load, but the error value is larger under the small load. This is mainly due to the fact that the grounding angle and strain first-order derivative eigenangle are small under small loads, and the model mesh accuracy is magnified for the angular influence error at this time. Since the standard load of 16.00R20 heavy-duty tyres is 63,700 N, it is more suitable as a characterisation of the grounding angle under such a large load.
Lateral force sensitivity analysis
Lateral deflection characteristics and strain characteristics of heavy-duty tyre analysis
In order to study the side bias characteristics of heavy-duty tyres, this paper uses finite element software Abaqus to simulate the side bias condition of tyres, and extracts and analyses the strain data of three parts of tyre innerliner A,B,C respectively, and the results are shown in Figure 9.
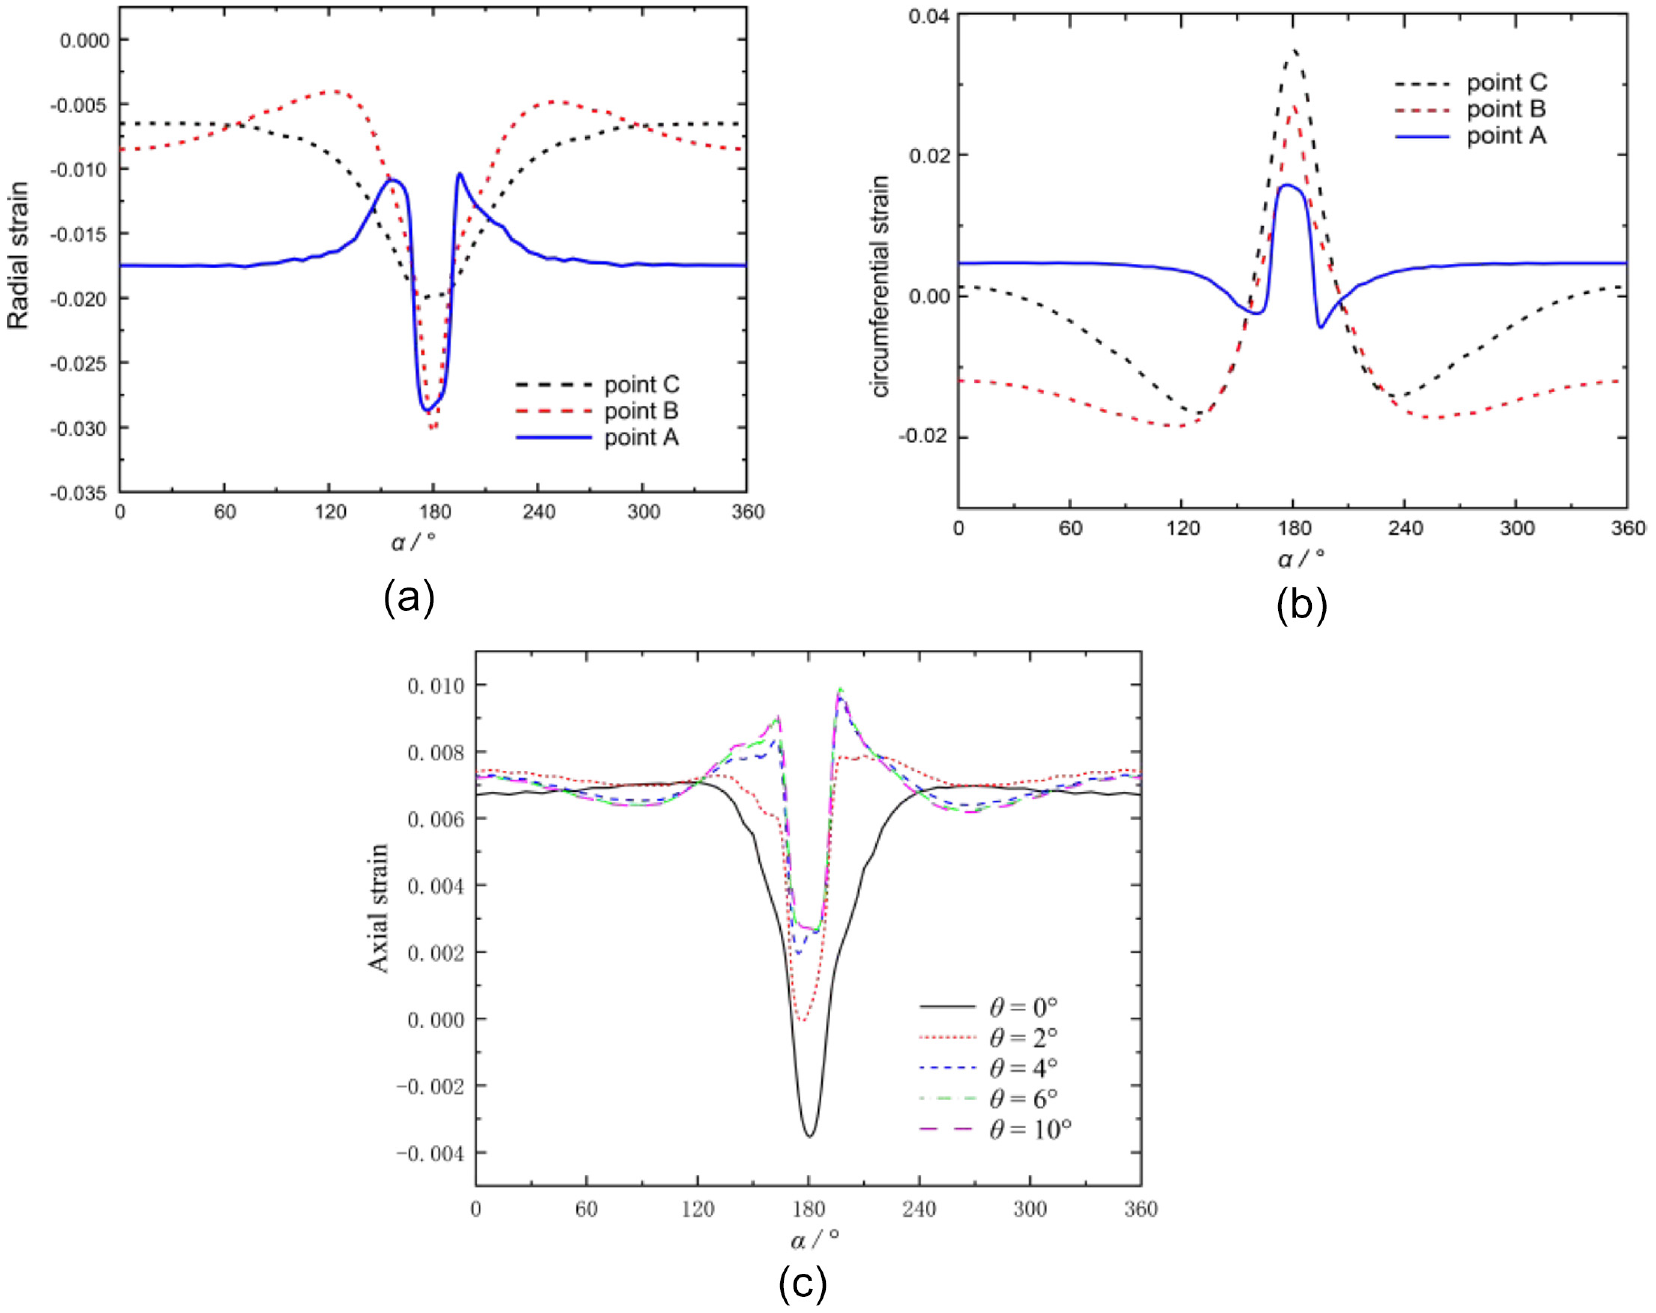
Strain characteristics of tyre innerliner: (a) radial strain curves in different areas of tyre innerliner, (b) circumferential strain curves in different areas of tyre innerliner and (c) axial strain curve of point C at different lateral angles.
Combining Figure 9(a)–(c), it can be seen that: (1) Under the lateral deviation condition, the strain curves in all three directions at different points are in the shape of a ‘quadratic function’, and the circumferential strain amplitude and radial strain amplitude at point C are greater than those at points A and B; (2) Compared to radial strain and axial strain, the peak valley difference of the circumferential strain curve at each point is larger; (3) Exploring the axial strain characteristics of point C at different lateral angles, the results are shown in Figure 9(c). As the lateral angle increases, the difference between the peak and valley values of axial strain at point C decreases.
In summary, under the condition of sidewall bias, the sidewall part of the tyre is more sensitive to the strain than other parts, especially to the circumferential strain.
Selection of eigenvalues of lateral deflection force
Combined with the results of strain sensitivity analysis of lateral bias force, this study selects the lateral circumferential strain of the tyre, which has higher sensitivity to the response of lateral bias force, as the research object. Set the rolling speed of 70 km/h tyre in different load and side deflection angle conditions, respectively extract the peak and valley of the circumferential strain curve at point C under each condition, and draw the eigenvalue curve shown in Figure 10.

Eigenvalue curves of tyres at different lateral deflection angles: (a) Eigenvalue of circumferential strain of tyre at 10 kN load and (b) Eigenvalue of circumferential strain of tyre at 50 kN load.
It can be seen from Figure 10: under different loads, the circumferential strain difference curve at point C of the tyre sidewall has a big difference, and the difference mainly exists in the contact area of the 180° tyre road, and the strain difference curve changes from an upward-convex shape to a downward-concave shape; with the increase of the side slip angle, the absolute value of the valley of the strain difference curve increases;
At the same time, in order to investigate the grounding characteristics of the tyre under the side-slip condition, the side-slip force following the side-slip angle is plotted as shown in Figure 11, where θ is the side-slip angle. The results show that as the tyre side slip angle increases, the lateral force shows a decreasing and increasing trend.

Lateral forces on tyres at different side slip angles.
Through the above analysis, it is found that the baseline value h0, the first valley value h1, the last valley value h2 and the lateral deflection force of the circumferential strain difference curve have obvious correlation, and the determination coefficient R2 is plotted as shown in Figure 12.

Coefficients of determination for different eigenvalues at various loads.
Figure 12 shows that the coefficients of determination h1and h2 are both higher than 0.9996, and the variation of h2 with side slip angle is much higher than the eigenvalue h1, so h2 is chosen as the characteristic eigenvalue of the side slip force.
The correspondence between the eigenvalues and the lateral force in Figure 13(a) shows that:
(1) there is one and only one eigenvalue corresponding to the lateral force when the tyre is under the same load before the lateral force reaches the package sum;
(2) However, the same eigenvalue may correspond to more than one lateral force and side slip angle at different loads;

Relationship between eigenvalue h2 and lateral force at different loads: (a) correspondence between eigenvalue h2 and lateral force and (b) Eigenvalue and lateral force normalisation results.
The eigenvalues h2 under different loads are investigated by normalisation and the results are shown in Figure 13(b).
Figure 13 shows that the trends of the lateral force with the growth of the side slip angle under different loads of the tyre are very similar, and there is an obvious correlation between the curves of the lateral force change when the loads are at 10, 30 and 50 kN, and the normalisation ratio of the three of them, k1:k3:k5 ≈ 1:3:5, has a linear relationship with the tyre’s loads. Combined with the sensitivity analysis of the vertical force in Section 3.1, this study concludes that the lateral force can be estimated from the strain eigenvalues h2, provided that the vertical force is clear.
Longitudinal force characteristic analysis
Analysis of longitudinal slip and strain characteristics of heavy-duty tyres
Different slip rates of tyres were set by the finite element simulation software, and the relationship curve between longitudinal force and slip rate was extracted at the same time, and the results are shown in Figure 14, where β denotes the tyre slip rate.

Longitudinal forces on tyres at different slip rates.
Figure 14 shows:
(1) When the slip rate is 0%-5%, the deformation of the tyre and road contact area increases, and the longitudinal force shows a nearly linear rapid increase trend; immediately after when the slip rate increases to 5%–8%, the relative slip between the tyre and the road increases, due to the deformation of the tyre gradually decreases as the unit of the slip rate grows, resulting in a slowdown in the growth rate of the longitudinal force; when the slip rate is greater than 8%, the tyre and the road surface as a whole slips and at this time the longitudinal force reaches a stable value and no longer changes significantly.
(2) The greater the load on the tyre, the greater the saturation value of the longitudinal force when the tyre slips with the road surface;
Longitudinal force sensitive eigenvalue selection
A load of 50 kN was applied to the tyre through the finite element simulation software, and the circumferential strain curve and axial strain curve at point A under different slip rates were extracted at the same time, and the results are shown in Figure 15.

Strain curves and eigenvalues of tyres at different slip rates: (a) axial strain curve, (b) circumferential strain curve, (c) radial strain curve and (d) circumferential strain eigenvalues.
Analysing Figures 14 and 15(a)–(c), conclusions can be drawn:
(1) As the tyre slip rate increases, the strain curves in all directions change significantly, and this change is mainly reflected in the peak, valley and peak-valley values of the curves;
(2) As the slip rate increases, the asymmetry of the strain curve in each direction becomes more and more obvious.
(3) During the increase of slip rate from 0% to 10%, the difference between the two valleys of the circumferential strain curves increases from 0 at the beginning to 2.893 × 10⁻³, which is much higher than the difference between the valleys of the remaining two curves, which indicates that the circumferential strain is more sensitive to the change of slip rate compared with that in the other two directions, and also indicates that the circumferential strain can be used as a sensitive signal of the longitudinal force.
The above analysis shows that the eigenvalue of the circumferential strain curve at point A under pure longitudinal slip condition is more sensitive to the response of the longitudinal force, so the tyre is set to be in 0.8 MPa longitudinal slip condition, and the eigenvalues of the circumferential strain curve at point A under different loads are extracted: the peak value h3, the valley difference h4, and the peak-valley difference h5, and the eigenvalues of the circumferential strain curve are plotted as shown in the diagram in Figure 15(d). Calculate the coefficient of determination of each eigenvalue and longitudinal force, which is used as the basis for selecting the eigenvalue of longitudinal force, and the calculation results are shown in Table 3.
Coefficients of determination of eigenvalues at different loads.
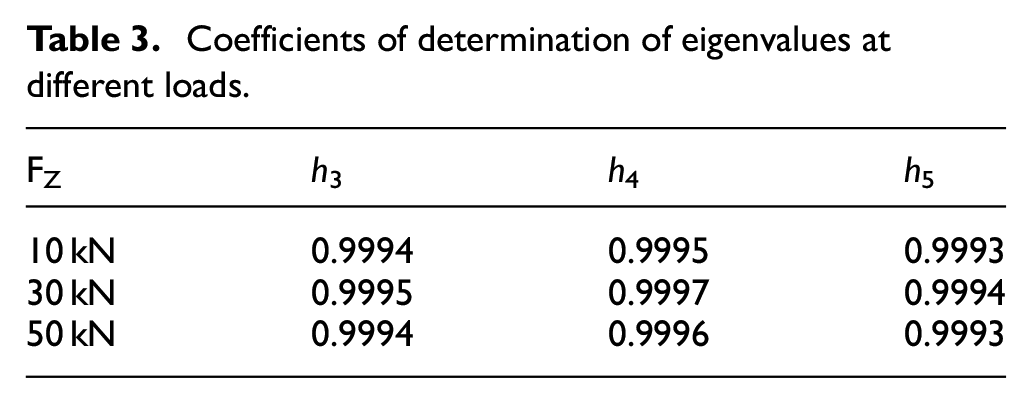
The calculation results show that the three eigenvalues under different loads have obvious correlation with the longitudinal force, in which the coefficient of determination between the valley difference h4 and the longitudinal force reaches 0.9997 when the load is 30 kN, so the valley difference of the circumferential strain curve of the tread median is chosen as the sensitive response eigenvalue of the longitudinal force in this study.
Through the above analysis, the tire ground force estimation process is drawn as shown in Figure 16. firstly, the grounding angle before and after the tyre was selected as the sensitive signal for the vertical force, and CA2 was used as the characterisation index of the grounding angle under the static loading condition; on the basis of this step, the circumferential strain signals were determined as the sensitive signals for the lateral force and the longitudinal force through the analysis of the strain curves, and finally, the second valley of the curve of the difference in the circumferential strain at the point of C, h2, was selected as the eigenvalue of the lateral force, the valley difference h4 of the circumferential strain curve at point A was selected as the eigenvalue of the longitudinal force.

Tyre-road contact force estimation model for tyre grounding based on circumferential strain.
Estimation of grounding force of heavy-duty tyre based on intra-tyre strain
Select the mean characterisation index CA2 as the vertical force sensitive characteristic value of heavy-duty tyres, select the second valley value h2 of the circumferential strain difference curve at point C as the lateral force sensitive characteristic value, select the valley value difference h4 of the circumferential strain curve at point A as the longitudinal force sensitive characteristic value, and use the grounding force sensitive signal as input to carry out grounding force estimation research.
Grey Wolf support vector machine
When establishing the tyre-road contact force estimation model, there is the problem of difficulty in obtaining a large number of datasets, while the support vector machine (SVR) performs relatively well with small sample data, with good robustness and excellent generalisation ability.15,16 The accuracy of the support vector machine is mainly determined by the penalty coefficient C and the kernel function parameter γ. The penalty coefficient C represents the tolerance of the model to error, and the kernel function parameter γ determines the generalisation of the model.
Grey wolf optimisation algorithm (GWO) is an optimisation search algorithm proposed by Mirjalili et al. subject to the hunting behaviour of grey wolf packs, 17 which has the advantages of good convergence performance, fewer parameters and easy to implement, etc. The optimisation process of the GWO algorithm includes hierarchical hierarchies of the main wolves, searching for encircling prey and hunting for attacking prey.
(1) Wolf pack hierarchical stratification. After randomly generating wolves in the search space, the three best adapted grey wolves in the pack are sequentially labelled as α, β and δ, and the remaining wolves are all labelled as ω. The hierarchical process is repeated after each iteration.
(2) Search and surround prey. The grey wolf will determine the location of the prey before attacking it, and adjust the search pattern and search direction for the prey through the coefficient vectors


In the above equation: k = α, β, δ; i = 1,2,3;
In summary, in this study, the support vector regression machine is selected to establish a tyre-road contact force estimation model, and the grey wolf algorithm is used to optimise the penalty coefficient C and kernel function parameter γ of SVR, so as to achieve the estimation of tyre-road contact force.
Tyre-road contact force estimation model based on grey wolf support vector regression machine
The force estimation process is as follows:
(1) Obtain the circumferential strain signal set of tyre sidewall and tread centreline during steady-state rolling under different operating conditions through experiments and finite element simulations. The signal set includes different load conditions, different side slip angle conditions, different roll angle conditions and longitudinal sliding conditions.
(2) Estimate the ground angle and ground length of the tyre according to the ground angle characterisation index ϕCA2 and ground length calculation formula of the multistep derivative curve of circumferential strain, and at the same time extract the baseline value of the circumferential strain curve to establish the [eigenvalue and sagging force] dataset; part of the data in the dataset is used as the training set of the sagging force estimation model, while the rest is used as the test set to test the estimation performance of the model; and finally input the eigenvalue data into the sagging force estimation model. Finally, the eigenvalue data are input into the vertical force estimation model to complete the vertical force estimation.
(3) Due to the high correlation between eigenvalues and lateral force under 30 kN load, the [eigenvalues Lateral Force] dataset under 30 kN load is selected as the training set, and the data under 10 and 50 kN load are used as the test set. According to the influence law of load on eigenvalues h2 and lateral force, the unit eigenvalue hb2 is calculated by combining h2 with load. hb2 is used as the input feature of the model, and after the unit lateral deflection force is found out, the actual lateral force is then found out according to the actual load. This is where,
(4) The [eigenvalues longitudinal force] dataset is input into the longitudinal force estimation model to fit the relationship between eigenvalues and longitudinal force under a load of 30 kN for training, and the datasets under loads of 10 and 50 kN are used as the test set. Meanwhile, in order to eliminate the effect of vertical force, the eigenvalues h4 are processed in the same way as in (3) to obtain h4′ by combining the loads, and the processed eigenvalues are inputted into the support vector machine to find the actual longitudinal force.
Tyre-road contact force estimation results
Feature set acquisition and model training
On this basis, single condition tests were conducted on heavy-duty tyres with vertical force, longitudinal force, and lateral bias force loaded separately. The vertical force loading range is 5–80 kN, the longitudinal force loading range is 0–25 kN, the lateral bias force loading range is 0–25 kN, the slip ratio range is 0% to 10%, the lateral angle range is 0° to 15° and the roll angle range is 0° to 10°. The vertical force applied in pure longitudinal sliding, lateral bias, and roll conditions is 30 and 50 kN, respectively.
Based on the relationship between vertical force, grounding angle and grounding length, grounding angle and grounding length were used as feature parameters for the estimation model. Corresponding working conditions were set for the tyre, and the circumferential strain of the inner lining layer was extracted. A total of 56 datasets were collected, of which half were used as training sets to train the three-dimensional force estimation model, and the other half were used as testing sets to test the training effectiveness of the model; At the same time, based on the clear understanding of the load, the characteristic values are processed through the influence law of the load on the force, and used as inputs for the lateral and longitudinal force estimation models to obtain the lateral and longitudinal force estimation results. Among them, 30 sets of data were selected as the training set to train the lateral force estimation model, and the other 30 sets of data were used as the testing set; At the same time, 28 sets of data were selected to train the longitudinal force estimation model, and the other 28 sets of data were used as the test set. The training set prediction results and the fitness change curves based on the grey wolf algorithm for the support vector machine C, γ finding process are shown in Figure 17, where n_test is the test set number, n_train is the training set number, nW is the number of iterations and W is the fitness value.

Tyre-road contact force estimation model training results: (a) vertical force fitness curve, (b) model training results for vertical force estimation, (c) lateral force fitness curve, (d) model training results for lateral force estimation, (e) longitudinal force fitness curve and (f) model training results for longitudinal force estimation.
Figure 17 shows that the fitness value of the force estimation model decreases rapidly and remains stable, in which the fitness value of the load estimation reaches near 0.00016 after six iterations and remains stable, with good convergence and good access to the optimal solution of the parameters. The results show that the maximum root mean square error of the model training set is 0.2587 kN, and the average absolute error is 1.06%.
Results of force estimations
The test results of the tyre-road contact force estimation model are shown in Figure 18, the root mean square error of the vertical force test set is 0.2894 kN, the maximum absolute error is 1.79% and the coefficient of determination is as high as 99.985%; the maximum absolute error of the lateral force test set is less than 3%, and the coefficient of determination is up to 0.999; the root mean square error of the longitudinal force test set is 0.7284 kN, and the average absolute percentage error is 4.65%. 4.65%, and the coefficient of determination reaches 0.9885, which has good estimation accuracy, and it can be considered that the method of heavy-duty tyre grounding force estimation based on the strain of tyre innerliner proposed in this study is feasible.

Tyre-road contact force estimation model test results: (a) model test results for vertical force estimation, (b) model test results for lateral force estimation and (c) model test results for longitudinal force estimation.
Conclusion
In this paper, a finite element model of 16.00R20 heavy-duty tyre is established, and the consistency of the model is checked by loading test and modal test; the grounding characteristics of the tyre under different loads, side slip angles, side inclination angles and slip rates are analysed by combining the experimental data with the simulation data, and the sensitivity relationship between the strain curve of the tyre’s inner liner ply and the three-directional force is studied at the same time. In this study, the mean value of the first-order and second-order pitch angle is used as the tyre grounding angle characterisation index, and the grounding angle and grounding length are used as the inputs of the vertical force estimation model; meanwhile, the eigenvalues of the circumferential strain difference signals at symmetrical points on the sidewall of the tyre, h2, are selected as the sensitive eigenvalues of the lateral force, and the eigenvalues of the circumferential strain signals at the midline of the inner liner ply of the tyre tread, h4, are selected as the sensitive eigenvalues of the longitudinal force. The sensitive eigenvalues of each grounding force were used as inputs to the force estimation model, and in this way, the estimation of the grounding force of the tyre was achieved. The results show that the estimation error of the triaxial force estimation model remains within 5%, and the model can accurately estimate the triaxial force of tyres under pure operating conditions
Footnotes
Handling Editor: Pak Kin Wong
Declaration of conflicting interests
The author(s) declared no potential conflicts of interest with respect to the research, authorship, and/or publication of this article.
Funding
The author(s) disclosed receipt of the following financial support for the research, authorship, and/or publication of this article: This work was supported by grants from the National Natural Science Foundation of China (No. 52472464) for which the author team gratefully acknowledges the above grants.