
Abstract
The rail hidden damage includes rail bottom and rail jaw cracks, which cannot be easily detected during the early development stage, and pose a significant danger and risk of rail-breaking accidents. This paper proposed an effective method to detect rail hidden damage by establishing a rail crack extension analysis model based on modal curvature difference theory and verified by the self-developed device. The results showed the distance of the rail bottom crack from the central axis of the rail bottom and the peak value of the modal curvature difference represented an approximate one-dimensional Gaussian correlation. The crack depth and crack length showed an approximately linear correlation with the peak value of the modal curvature difference. Setting cracks at rail bottom and rail jaw, the detection errors were below 5% at a 6 mm crack depth and lower than 3% at a 10 mm crack depth. The results of signal-to-noise ratio during rail bottom crack detection indicated that crack could be effectively detected before rapid expansion when the crack distance from the rail bottom central axis exceeded 35 mm, and crack parameters could be quantitatively determined before rapid expansion at a crack distance exceeding 45 mm.
Keywords
Introduction
Since rails are an essential part of rail transportation, reliability is crucial. The development of China’s rail transportation in a high-speed, heavy-duty, high-density direction has increased the complexity and diversity of rail damage. 1 Current rail damage inspection methods mainly include physical and machine vision techniques, 2 presenting different detection principles, ranges, and limitations.
Physical inspection methods include ray, fiber optic, ultrasonic, ultrasonic guided wave, and electromagnetic ultrasonic detection. Due to the complex equipment structure, ray detection is generally not used for online rail detection and is primarily utilized for pre-production defect detection. 2 Fiber optic rail damage detection and reattachment are challenging and expensive. 3 Zhao 4 used ultrasonic detection methods and proposed two rail defect detection methods based on airspace information and impact two-dimensional reconstruction to achieve the judgment and positioning of rail defects. However, this technique was not capable of accurate quantitative defect identification. Huang et al. 5 investigated the diversity and difference of the interaction between the corrosion and Lamb wave modes. But the recent applications of Lamb wave in detection technology is centralized in structures of thin plate, including aircraft wall panels and the use in rail damage detection still need more studies. Pal et al. 6 proposed a railway section damage localization method based on the data of single acoustic emission sensor. This method has high recognition accuracy but can be easily affected by environmental noise. The applicability to detect rail damage with large environmental noise in the field is doubtful. Lee et al. 7 showed that selecting a suitable mode and frequency during ultrasonic guided wave detection effectively identified transverse cracks under the surface peeling of the rail head. Zhang et al. 8 designed a rail flaw detection vehicle using electromagnetic ultrasonic sensors. The CNN method was used to improve the defect classification accuracy to effectively detect the rail head, rail waist, and rail bottom near the center of the damage. However, a detection blind zone was evident for cracks near the edge of the rail bottom. In summary, the widely used ultrasonic detection method can identify the type of damage to the rail head, rail waist, and central rail bottom. Due to the probe orientation, rail contact surface flatness, and other impacts, ultrasonic inspection yields low detection rates of hidden damages at the rail bottom near the edge of the two sides and rail jaws is low and detection blind zones exist (Figure 1). 9

Ultrasonic rail damage detection blind zone.
Machine vision inspection methods include traditional and deep learning inspection. Deutschl et al. 10 proposed a vision-based technique for automatically detecting track surface defects using a color line scan camera and spectral image differences. Dai et al. 11 extracted image features using a high-speed railroad fastener automatic detection system based on three-dimensional laser imaging technology to accurately identify the status of missing fasteners, as well as unilateral and bilateral fractures. Zhang et al. 12 proposed a detection method based on curvature filtering and an improved mixed Gaussian model to accurately recognize and segment surface defects in rail images. Min et al. 13 designed an image acquisition device equipped with an auxiliary LED light source and a shading box based on machine vision for the real-time detection of rail surface defects. Trinh et al. 14 proposed a highly accurate, efficient, real-time rail inspection system based on automatic vision and deep learning detection. It was only used to identify vital rail components such as ties, tie plates, and anchors and did not display adequate generalization. Therefore, machine vision inspection, especially deep learning inspection, is only suitable for the accurate, quick detection of damage to the rail surface or specific rail components.
Therefore, due to the influence of hardware factors, detection blind zone still exists when applying the widely used ultrasonic methods to detect hidden damage at the bottom edge of the rail and the rail jaw, while machine vision detection methods are more successful in recognizing rail surface damage. Due to the hidden nature of damage to the bottom edge and rail jaw of the rail, it is often only discovered when the rail is broken, severely jeopardizing safety and increasing the risk of accidents. 15 Therefore, accurate, effective methods are crucial for identifying hidden damage to the rail bottom edge and jaw.
This paper proposes a modal curvature difference-based method to detect hidden rail bottom edge and rail jaw damage. The quantitative law between the characteristic crack parameters (length, depth, and transverse position) and the peak modal curvature difference value is comprehensively examined by establishing an analytical model for hidden crack expansion on the rail bottom. The self-developed device is used to verify the validity of the peak modal curvature difference value for the quantitative detection of hidden rail bottom edge and rail jaw damage. This mitigates the low detection rate and insufficient ability of existing defect detection technology to predict rail breakage, consequently reducing the risk of rail transportation accidents. Flowchart of the research on the method to detect hidden rail damage is showed as Figure 2.

Flowchart of the research on the method to detect hidden rail damage.
Rail hidden damage detection methods
Theory of modal curvature
Figure 3 shows the longitudinal structural rail decomposition. The modal rail curvature and damage detection via modal curvature differences are calculated as follows.

Longitudinal structural rail decomposition.
Accurate rail modal displacement parameters were obtained via modal displacement 16 as a direct source. It is more appropriate to use low-order modes for damage detection using the modal curvature differences. 17 This paper uses the first-order vertical modes to detect hidden rail bottom and rail jaw damage. Figure 3 shows the structural rail decomposition, which is divided into n units and n + 1 nodes, solving the rail vibration modes. The bending curvature of the micro-segmented beam structure is specified in the theory of material mechanics as follows 18 :
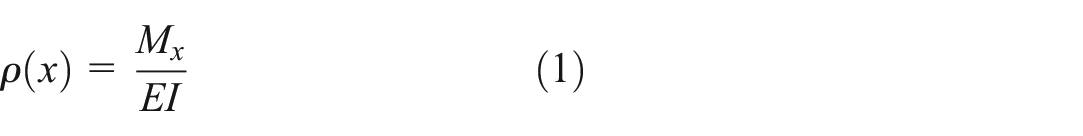
Equation
According to the modal theory, the vibration displacement

where i is the modal order, and
In mechanics, the beam curvature function refers to the second-order derivative of the vibration displacement function. Specifically, the modal curvature
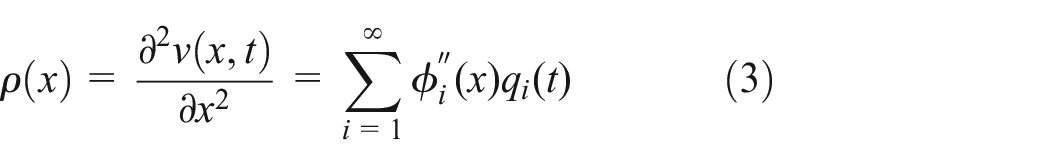
Equations (1) to (3) show that local damage to the rail bottom or jaw decreases the local bending stiffness at the damage location while increasing the curvature. 19 This causes a sudden modal curvature difference peak, the size of which is used to determine the location and degree of local damage to the rail bottom or jaw.
Method for obtaining modal curvature difference
This paper used 60 rails to examine hidden rail bottom and rail jaw damage, utilizing numerical simulation and experiments to assess the efficacy of the rail damage detection method based on modal curvature differences. The process included a rail of 1.56 m long in simplified, unconstrained, free working conditions. The modal curvature differences were obtained as follows:
(1) Firstly, the first-order vertical modal displacement of the lower surface of the rail jaw on the top surface of the rail bottom is obtained by experimental or numerical simulation.
a. Method for obtaining modal displacement mode shape: The force signal and vibration signal were used as input for excitation (the excitation signal that excites the j position) and output for response (the response signal of the i position after the j position was excited), and the sampled time-domain data was converted into a frequency domain signal by fast Fourier transform (FFT). The ratio of the output response to the input excitation is the frequency response function

Complex mode transfer function expansion is as follows:
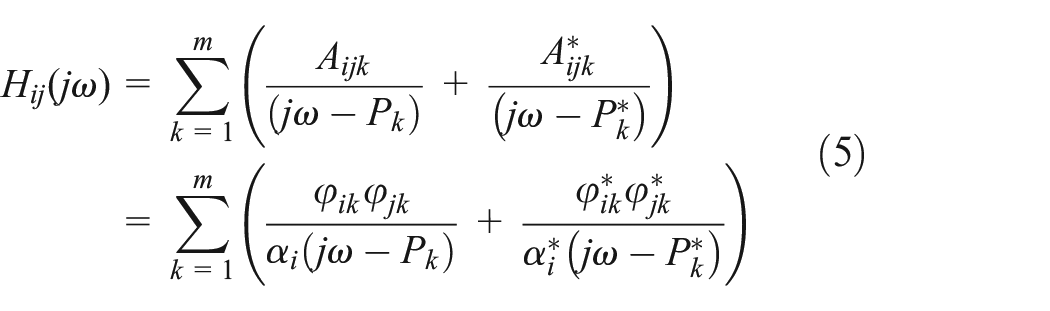
where:
b. Numerical simulation method to obtain modal displacement mode shape: the first-order vertical mode displacement of the rail is obtained by modal analysis. Then the first-order vertical mode displacement mode shape of the entire rail bottom top surface or the lower surface of the rail jaw can be expressed as:

(2) The center difference method was applied to the modal displacement values at each measurement point to obtain the corresponding modal curvature:

where d is the distance between the measurement points.
(3) The modal curvature of each measurement point

where the subscript x denotes the xth measurement point.
(4) The modal curvature difference vibration patterns of the top rail bottom and lower rail jaw surfaces


Through the above method, the modal curvature difference between the top surface of the bottom of the rail and the lower surface of the jaw of the rail with crack damage can be obtained.
The correlation between the modal curvature difference and rail bottom crack parameters
The finite element modeling of the hidden crack extension on the rail bottom
The finite element model was established for the concealed crack propagation at the bottom of the rail, and the correlation between the crack parameters and the modal curvature difference at the bottom of the rail was explored. The rail bottom and rail jaw modeling processes are basically the same. Generally, transverse fatigue crack depths of about 10 mm in the rail bottom and rail jaw cause transverse rail fractures (rapid expansion and instantaneous fracturing). 15 Figure 4 shows a typical rail bottom crack extension fracture. This paper used numerical simulation to investigate the feasibility of the rail hidden damage detection method in preventing rapid crack expansion and the development of fatigue cracks into dropped or broken pieces that severely compromise safety and examined the rail bottom crack contour correlation (the transverse position, depth, and length of the damage and the modal curvature difference).

Typical rail bottom crack extended fracture.
The crack profile was simplified to a semi-elliptical structure, with the short half-axis a of the ellipse representing the crack depth and the long axis 2b denoting the crack length. The rail bottom crack at the central axis of the rail was defined as S = 0 mm, which increased as the crack extended from the central axis (transverse position), S. Figure 5 shows the crack location, depth, and stress distribution at the crack tip.

Crack location and crack tip stress distribution.
The fatigue crack expansion of the 1.56 m rail bottom was analyzed, showing mostly type I (expansive) cracks. The equation for the stress near the crack tip is as follows:

In the formula:
Generally,

In the formula,
Table 1 shows the mechanical properties of the rails.
The mechanical properties of the steel rails.

A straight line 16 mm from the top edge of the rail bottom was selected as the modal displacement sampling line, as shown in Figure 6. The modal curvature differences obtained via numerical simulation and testing were normalized to visually compare the results. The 1287 sets of numerical simulation results were analyzed with crack positions S ranging from 0 to 60 mm from the central axis, crack depths a ranging from 1 to 10 mm, and lengths 2b ranging from 2a mm to 3a mm. The establishment of finite element model was used to analyze the correlation between the evolution of one-dimensional and multidimensional crack parameters and the modal curvature differences and the evaluation of damage detection results.

The modal displacement sampling line.
The correlation between the modal curvature difference and the evolution of the rail bottom crack profile and location
Figure 7 shows the evolution pattern of the peak modal curvature difference when the crack depth a varied between 1 and 10 mm.
(1) The peak modal curvature difference increased monotonically as the distance S increased.
(2) The modal curvature difference increased gradually when the distance S was below 30 mm while showing a rapid rise when the distance S exceeded 30 mm. The modal curvature difference reached a maximum value directly below the sampling line.
(3) The distance S and modal curvature difference

With a 10 mm deep crack as an example,

The peak modal curvature difference evolution at various crack distances S from the central axis.
Figure 8 shows the peak modal curvature difference evolution at each position when the crack distance S from the central axis ranges from 0 to 60 mm, the peak modal curvature difference evolution of the crack depth a change at the same length 2b, and the peak modal curvature difference evolution of the crack length 2b change at the same depth a.
(1) The peak modal curvature difference increased monotonically as the crack depth a and crack length 2b increased, showing an approximately linear correlation.
(2) The modal curvature difference peaks at various distances S from the center of the rail bottom were highest at the maximum crack depths a and lengths 2b.

The peak modal curvature difference evolution of the crack depth a and length 2b variation: (a) the crack depth a variation and (b) the crack length 2b variation.
The hidden rail damage detection method based on modal curvature difference in the detection of crack at the bottom of the rail, the larger the crack depth a and the greater the distance S from the center of the rail bottom S (i.e., the closer it is to the edge of both sides of the rail bottom), the greater the peak value of the modal curvature difference. Therefore, this method can effectively measure the hidden damage of the rail, which makes up for the shortcomings of the traditional ultrasonic testing method for the detection blind area of the edge of the rail bottom.
The test method for rail hidden damage detection
Hidden damage detection at the bottom of the rail
Taking the hidden damage at the bottom of the rail as the detection target, the 1.56 m long rail was simplified to the unconstrained free working condition to keep consistent with the simulation. A self-developed rail hidden damage detection device was used to stimulate 79 measurement points at 2 cm intervals at the top surface edge of the rail bottom at a distance of 16 mm from the bottom of the rail. The force sensor detected the force signals, while the acceleration sensor detected the acceleration signals and calculated the relative displacement signal through quadratic integration to obtain highly precise dispersive modal information from the 79 measurement points. This device was authorized via a utility model patent, as shown in Figure 9. 20 Vertical vibration signals were collected by acceleration sensors placed 55 cm from the left end of the rail, 16 mm from the bottom corner edge of the top rail bottom surface, and 18 mm from the rail head edge of the lower rail jaw surface.

The rail hidden damage detection device.
Tests were conducted at different rail bottom crack depths. A thin blade was used to prefabricate a crack of 3 mm deep at 96 mm from the left side of the rail and 60 mm from the central axis of the rail bottom. As shown in Figure 10, the crack depth was increased to 6 and 10 mm to examine the related rail bottom modal displacement, modal curvature, and modal curvature difference.
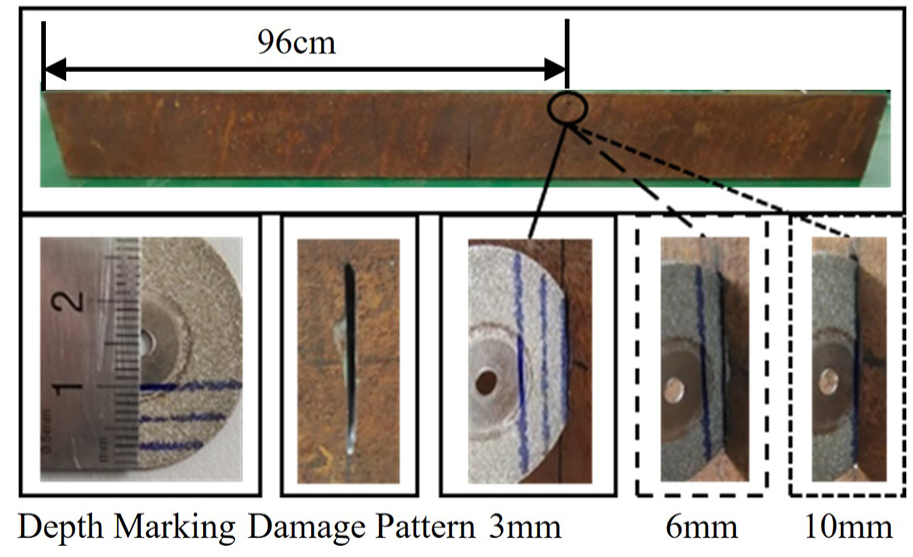
The prefabricated rail bottom cracks.
Figure 11 shows the first-order vertical modal displacement curves of the rail with and without rail bottom cracks. The inherent frequencies of the four conditions without cracks and with 3, 6, and 10 mm deep cracks were all around 442 Hz. Since the modal displacement curves of the rails with and without cracks overlapped with no obvious differences, modal displacement could not effectively characterize rail damage.

The modal displacement of the rails with and without rail bottom cracks.
Figure 12(a) shows the modal curves of the rails with and without rail bottom cracks. Figure 12(b) illustrates the curves of the modal curvature differences between the prefabricated rail bottom cracks and the non-cracked rails. Distinct curve peaks were evident at 6 and 10 mm crack depths, while those of the 3 mm cracks were not obvious and were close to the curve background noise. The modal curvature difference curve tended toward 0 in all positions except the peak, showing a parabolic trend. Therefore, the modal curvature difference peak was adopted as the damage detection index.

(a) Modal curvature and (b) modal curvature difference.
Hidden damage detection of the rail jaw
An accelerometer is installed on the lower surface of the rail jaw at a distance of 55 cm from the left end of the rail and 18 mm from the edge of the rail head to collect the vertical vibration signal of the lower surface of the rail jaw. A thin blade was used to prefabricate a 3 mm deep crack at 96 mm from the left side of the rail and 26 mm from the edge of the rail head at the lower rail jaw surface. As shown in Figure 13, the crack depth was increased to 6 and 10 mm to examine the modal curvature difference curve trends of the rail jaw. As illustrated in Figure 14, a more obvious modal curvature difference peak was evident for the lower rail jaw surface with the 10 mm deep crack, while those for the 3 and 6 mm cracks were not obvious and close to the background noise of the curve.
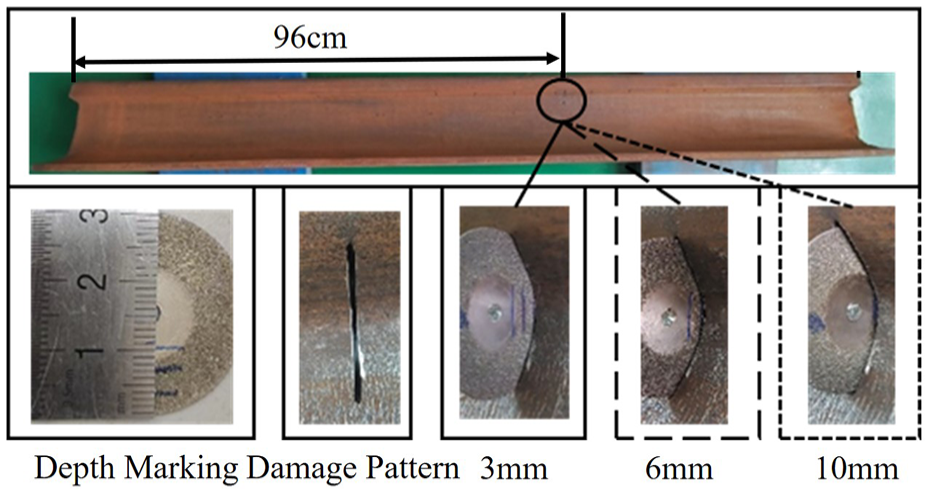
The rail jaw crack performance.

The differential modal curvature of the rails in the presence of rail jaw cracks.
Signal-to-noise ratio for effective rail damage detection
The signal-to-noise ratio was introduced to precisely define effective rail damage detection. 21 The signal-to-noise ratio of modal curvature difference is calculated as the relationship between the peak value of the modal curvature difference resulting from the crack and the effective value of the noise signal. This can be expressed as SNR = 20Lg (Vs/Vn), where Vs represents the peak value of the curvature difference signal of the crack, and Vn corresponds to the effective value of the noise signal. This paper defines Vn as the maximum absolute value of the modal curvature difference value at all the measuring points except those adjacent to the crack, specifically the point at the crack, one point on the left and one on the right.
Hidden rail bottom damage detection
The peak values of the 3, 6, and 10 mm rail bottom crack modal curvature vibration mode differences were 0.23, 0.65, and 2.05, while the signal-to-noise ratios were 0.47, 8.81, and 18.75 dB. A signal-to-noise ratio of 10 is necessary to determine the limit of quantification (able to quantitatively determine the crack depths and information coordinates), while a signal-to-noise ratio of 3 is required to determine the limit of detection (able to detect the cracks). 22 The 3 mm deep crack did not reach the detection limit, while the 6 mm deep crack reached the detection limit and was close to the quantification limit. The 10 mm deep crack reached the quantification limit.
Hidden rail jaw damage detection
The peak values of the 3, 6, and 10 mm rail jaw crack modal curvature vibration pattern differences were 0.13, 0.35, and 1.13, while the signal-to-noise ratios were −4.73, 4.56, and 13.56 dB. A signal-to-noise ratio below 0 indicated that the modal curvature difference peak value was lower than the RMS of the background noise. The 3 mm deep crack did not reach the detection limit. The 6 mm deep crack reached the detection limit, and the 10 mm deep crack reached the quantification limit.
Therefore, the rail hidden damage detection method in this paper could quantitatively determine the rail bottom crack parameters and rail jaw crack parameters before rapid crack expansion (depth ≤ 10 mm).
Evaluation and analysis of the damage detection results
Evaluation of the damage detection results
The rail bottom and rail jaw crack detection results were analyzed during the fatigue expansion stage. Three tests were conducted for each crack depth at 3, 6, and 10 mm. This included a rail bottom crack 60 cm from the right end face of the rail, one 60 mm from the central axis of the rail bottom, and a rail jaw crack 26 mm from the edge of the rail head. The cracks with the same morphology in the same location were analyzed using the simulation method which have been mentioned above. Table 2 shows the detection errors of the hidden rail bottom and rail jaw crack, and boldface denotes the comparison between the normalized tests and the simulation results. The test error is the ratio of the difference between the value of test and the average value of tests to the average value of tests. And the test and simulation relative error is the ratio of the difference between the value of test and simulation to the average value of tests.
The detection errors of the hidden rail bottom and rail jaw cracks.

The test error and relative error between the test and simulation results were more significant at rail bottom and rail jaw crack depths of 3 mm, while the detection performance was poorer. At a 6 mm crack depth, the test error and relative error between the test and simulation results were lower than 5% and below 3% at a depth of 10 mm. Therefore, deeper cracks were more accurately detected.
Analysis of the damage detection results
The numerical simulation was an ideal state without the noise signal generated during the test. Therefore, the signal-to-noise ratio was used to explore the crack profile and position parameter detection accuracy. The average RMS noise signal values of the nine data groups measured during the test were considered examples of rail bottom cracks. The numerically simulated noise signal,
Numerical simulation data.

A three-dimensional scatter plot of the modal curvature difference peak signal-to-noise ratios of the 1287 numerical rail bottom crack simulation data sets was created to analyze the damage detection results, as shown in Figure 15. The analysis are as follows:
(1) A more significant depth a and crack distance S from the rail bottom center increased the modal curvature difference peak and corresponding signal-to-noise ratio.
(2) A negative signal-to-noise ratio indicated that the peak signal of the modal curvature difference was lower than the analog noise signal. A positive signal-to-noise ratio was evident when the distance S from the rail bottom center exceeded 30 mm.
(3) Cracks with signal-to-noise ratios over 3 were evident when the distance S from the rail bottom center exceeded 35 mm, facilitating effective crack detection before rapid expansion.
(4) Cracks with signal-to-noise ratios over 10 were when the distance S from the rail bottom center exceeded 45 mm. Consequently, the crack depth and coordinate information were accurately quantified before rapid crack expansion.

The signal-to-noise ratio distribution.
Conclusion
An innovative approach through the modal curvature difference has been proposed to detect hidden rail bottom and rail jaw damage. Detailed experiments and numerical simulations have been carried out to compare and analyze the hidden damage of the rail bottom and rail jaw under unconstrained free working conditions, yield following conclusions:
(1) Crack extension evolution law: A more significant crack depth a increases the crack distance S from the rail bottom center, while a higher modal curvature difference peak value is evident closer to the edge of the two rail bottom sides.
(2) The rail damage detection test results: The 3 mm deep cracks do not reach the detection limit during fatigue crack expansion at the rail bottom edge and rail jaw. The 6 mm deep cracks reach the detection limit, and the 10 mm deep cracks reach the quantitative limit. Therefore, the rail bottom edge and rail jaw cracks can be quantitatively determined via the cracking parameters before the rapid expansion (depth ≤ 10 mm).
(3) Evaluation of the damage detection results: The errors between the normalized tests and numerical simulation results in the same working conditions are below 5% when the crack exceeds 6 mm. An increase in the crack depth reduces the error and improves the detection performance.
(4) Analysis of the damage detection results: A more significant distance S between the crack and the rail bottom center (the closer the two edges of the rail bottom) increases the depth and the detection signal-to-noise ratio. When the distance S exceeding 35 mm, the crack can be accurately detected before rapid expansion. When the distance S over 45 mm, the crack can be accurate quantification before rapid crack expansion.
The hidden rail damage detection method proposed in this paper focuses on the identification of hidden rail damage of rail bottom and rail jaw, which is currently a technical gap. This method effectively detects and quantitatively identifies hidden rail damage, providing a new approach for rail inspection and maintenance. Although a large number of simulations and quantitative experiments had been carried out on the hidden damage at the bottom of the rail, only a small number of experiments and qualitative studies had been carried out on the hidden damage of the rail jaw under the same working conditions, and it is necessary to discuss the identification of the concealed damage of the rail jaw in more detail in the future. Although the local bending stiffness of the damage decrease at both the constrained and free states, leading to the emergence of modal curvature peaks, the field service rail exhibits a distinct vibration pattern compared to its free modal vibration due to fastener constraints. Future study will focus on assessing bottom rail damage during service by employing the rail length between two fasteners as a detection unit.
Footnotes
Handling Editor: Aarthy Esakkiappan
Author Contributions
Weirong Li: writing – original draft; writing review & editing. Yan Liu: conceptualization; funding acquisition; supervision. Xianpu Yuan: conceptualization; writing – original draft; writing review & editing. Qiutong Li: writing – review & editing. Guojian Zhou: writing – review & editing.
Declaration of conflicting interests
The author(s) declared no potential conflicts of interest with respect to the research, authorship, and/or publication of this article.
Funding
The author(s) disclosed receipt of the following financial support for the research, authorship, and/or publication of this article: This research was funded by National Key Research and Development Program of China: 2021YFB3801803-05 and National Engineering Laboratory for Digital Construction and Evaluation Technology of Urban Rail Transit Open Project Fund (2023 shiyanyanwei No.019).
Data availability
The data that support the findings of this study are available from the corresponding author upon reasonable request.