
Abstract
In order to solve the problem of online risk analysis of assembly process, an intelligent decision-making method of electromagnet assembly risk based on Digital Twin (DT) was proposed. Firstly, a DT model of electromagnet assembly process is constructed, and the potential failure modes are collected in real time at the physical layer. Secondly, in the virtual layer, real-time potential failure modes are obtained through information synchronization and transmitted to the application layer. Then, in the application layer, the optimized Failure Mode and Effects Analysis (FMEA) method is used to analyze the risk of failure mode, and the risk value of failure mode is fed back to the virtual layer. In the improved FMEA method, the q-Rung Dual Hesitant Fuzzy Number (q-RDHFN) is used as the evaluation language. The weight of experts is calculated by Bidirectional Projection Method (BPM), and the comprehensive weight of risk factors is calculated by Best and Worst Method (BWM) method, entropy weight method and Criteria Importance Through Intercriteria Correlation (CRITIC) method. Finally, the physical layer is adjusted to reduce the probability and risk of failure mode occurrence. An example of risk intelligent decision making is given to verify the objectivity and practicability of the new method.
Introduction
In today’s highly competitive market environment, quality risk decision has become the key to the survival and development of enterprises. Quality risk decision is a key step to identify, evaluate, and deal with potential quality problems in the process of product development and production. Through effective quality risk decision-making, enterprises can ensure the stability and reliability of product quality, improve product performance, and customer satisfaction. FMEA is often used to identify possible failure modes of a product. So that we can take preventive measures in advance to improve the reliability of products. FMEA analyzes each step of the product manufacturing process to identify all potential failure modes. Necessary measures should be taken in advance for the possible consequences of these failure modes. In a traditional FMEA, Firstly, an expert uses integers to score the factors that affect the failure mode. Secondly, the scores are multiplied to obtain a Risk Priority Number (RPN). Finally, they are ranked to complete the risk assessment.
FMEA can make quality risk decisions, take action against potential failure modes, and improve product quality. FMEA is widely used in machinery manufacturing, medical and social services, 1 transportation and other fields.2–3 However, there are many shortcomings in the use of traditional FMEA in complex working environment. First, it is not objective to evaluate failure modes by integer in a complex evaluation environment. Second, the weight of evaluation experts and risk factors are not given, which is not practical. Third, the final RPN may have the same value, which does not reflect the risk of failure mode. 4 Therefore, many scholars have studied the shortcomings of evaluation language. Heidary et al. 5 proposed risk priority evaluation method based on the hesitant fuzzy set. Pang et al. 6 introduced an improved FMEA evaluation method based on intuitive fuzzy number (IFN) and applied it to an electromagnet manufacturing system. Ak and Gu 7 proposed the application of risk assessment method based on Pythagorean Fuzzy Sets (PFSs) in information security engineering. Liu et al. 8 used q-RHFSs to evaluate medical cases. The subjective weighting commonly used in FMEA includes an improved Analytical Hierarchy Process (AHP) to determine the weight of indicators. 9 Li et al. 10 proposed a fault analysis method for offshore floating wind turbines based on AHP and proved the feasibility of this method. Rezaei 11 proposed the Best And Worst Method (BWM) with reference to the comparative idea of AHP methods, which was also applied to the solution of subjective weights.
In addition, the determination of the weight of evaluators and influencing factors also has a great impact on the decision result. The BWM method constructs a scale matrix by determining criteria for the best and worst attributes. Then the weight is determined according to the proportion. At present, it is widely used in multi-attribute decision making.12–13 Objective weighting methods include entropy weight method, 14 CRITIC and included Angle cosine method.15–16 In the multi-criteria decision-making process, the subjective weighting method determines the weight of the risk factors according to the subjective knowledge of the expert. 17 Objective weighting methods are overly dependent on data samples and are not objective. 18 Li et al. 19 used the combination of entropy weight method and hierarchical analysis to obtain the weight of comprehensive evaluation indicators. Zafar et al. 20 used the combination of entropy weight method and CRITIC in multi-criteria decision making to carry out blockchain weight allocation. In addition, the calculation of failure mode risk value should also be optimized. Because it is directly related to the determination of the final result. Risk value calculation methods include TOPSIS 21 and an VIKOR, 22 PROMETHEE, 23 et al. In 2019, Yazdani et al. 24 proposed a new Method, Combined Compromise Solution Method (CoCoSo), which is a decision-making method based on combination and compromise. There is an equilibrium that avoids decision compensation and achieves final utility. 25 At present, CoCoSo has been extended to multiple attribute decision making in different fields, such as sustainable supplier selection and financial risk evaluation. 26
More importantly, more and more companies are adopting digital production lines. In this context, whether the traditional quality decision method is still applicable. Firstly, the FMEA of the assembly process needs some data support, and how to collect these data in real time is worth thinking about. Secondly, in the quality analysis of digital production line, the uncertainty is greater, and it is necessary to give the evaluators more freedom of decision. Finally, we can integrate quality decision algorithms into digital production for real-time quality analysis. DT is a new technology based on digital technology that combines the physical world with the virtual world. Through virtual and real modeling of electromagnet manufacturing process, visual monitoring can be realized. At the same time, the data collected in real time provide the basis for the online risk decision-making of the manufacturing process. So, it is of great significance to use DT model to make risk intelligent decision in electromagnet assembly process. DT is a process of collecting real-time production data through physical models to simulate multi-physical quantities and multi-scales. At the same time, it is also a digital image and digital analysis platform for physical models. The DT physical layer can collect some data in real time, the virtual layer can collect and process the data, and the application layer can calculate the data through the risk decision algorithm and give early warning to high-risk quality problems. 27
On the one hand, based on the advantages of DT technology, it is widely used in machinery industry, transportation industry, intelligent operation, and maintenance and other fields. The construction of high-fidelity physical-virtual models of DTs is very important. 28 However, the current model is not a true reflection of the product. To solve this problem, many scholars have conducted a series of studies. Wu et al. 29 proposed a five-dimensional DT modeling method, compared with the existing modular modeling method, the DT can capture each process of product production. Due to the complexity of production processes, the construction of DT models has brought many difficulties. 30 Tekinerdogan and Verdouw 31 proposed a catalog of DT structural design patterns based on control systems, which can be widely used in the context of large engineering systems. Ritto and Rochinha 32 constructed a DT model for the damaged structure based on the combination of physical model and machine learning, and trained the data obtained in the model to support real-time engineering decisions. Liu et al. 33 combined the advantages of DT technology and super network to develop a shop-oriented intelligent scheduling method, which can realize intelligent shop scheduling.
Moreover, the data-driven system design of the DT is also important. In the context of the fourth industrial revolution, the trend of transformation from the traditional technology industry to the information industry has emerged. Many scholars have conducted research on the design of data-driven systems. Tao et al. 34 proposed a DT-driven Product Design (DTPD) framework, which makes the connection between the physical space and virtual space of products closer. For the whole processing process, the processing of product production state transformation data determines the adaptive ability of data-driven model. The self-adaptability and uncertainty quantification of data-driven models can be expressed as the state estimation problem of Bayesian networks.35–36 When the parts are damaged, the production status changes to ensure that the damaged parts are quickly detected. 37 The whole data-driven system includes not only the interaction between physical model and virtual model, but also other multi-dimensional interactions. 38 For example, add a data application layer for data sharing. 39 The electromagnet has the advantages of small size, complex structure, high assembly precision, and multi-disciplinary coupling. Therefore, for the quality analysis of electromagnet assembly process, the collection and analysis of data must be fine and accurate. And the data application layer should be set up to facilitate cross-disciplinary data transmission.
Based on the research in the literature, we find that DTs provide data acquisition and transmission channels for risk intelligent decision-making. What is important is how to conduct risk analysis of failure modes on the basis of these data. Therefore, this paper proposes a risk intelligent decision-making method based on DTs. Firstly, the risk evaluation of the failure mode of DT physical layer acquisition is carried out by using q-RDHFN. Secondly, in the DT application layer, the evaluation information is aggregated according to q-Rung Dual Hesitate Fuzzy (q-RDHF) operators, and the objective weight of experts is determined by BPM. At the same time, BWM, entropy weight method and CRITIC are used to calculate the comprehensive weight of risk factors. Then, the improved score function is used to aggregate the evaluation information based on the comprehensive weights of risk factors, and CoCoSo is introduced to calculate the risk value of failure mode. Finally, the DT virtual layer receives the failure mode risk information and adjusts the physical layer according to the information to avoid the occurrence of failure mode.
The remainder of this paper is structured as follows. Firstly, we construct the DT mapping model of electromagnet manufacturing process. Secondly, we introduce the algorithms used to make quality analysis decisions at the DT application layer. Then, based on the electromagnetic brake DT platform, we carry out risk analysis and demonstrate the calculation process of the new method. At the same time, we also carry out sensitivity analysis and comparative analysis of the results calculated by the new method. Finally, we summarize the advantages of the new method and make suggestions for its future development.
Construction of digital twin mapping model for electromagnet manufacturing process
The electromagnet assembly process architecture based on DTs can be divided into three layers, physical layer, virtual layer, and application layer, as shown in Figure 1.
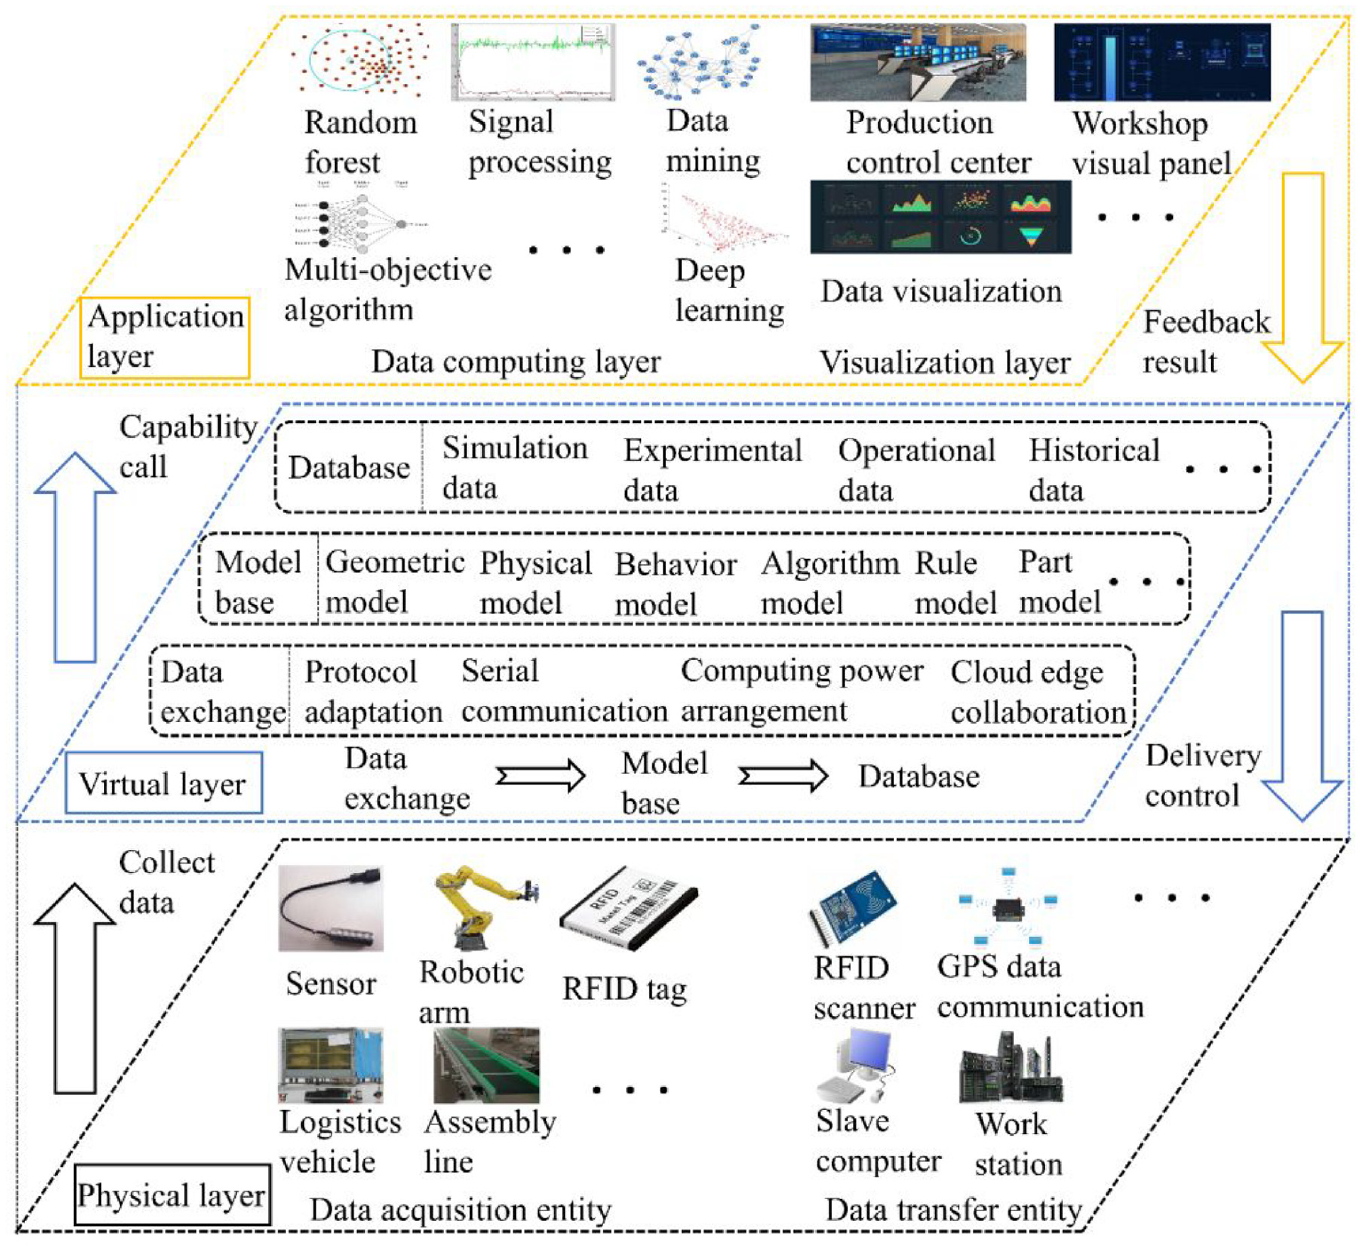
Electromagnet assembly process architecture based on DTs.
Physical layer
The physical layer mainly includes manufacturing resources, intelligent iota network, and information communication network. Manufacturing resources refer to the materials, intelligent machinery and equipment, workstations, vehicles, and other production materials required in the production process. Manufacturing resources are not only physical resources but also virtual resources. Virtual manufacturing resources refer to the use of digital and standardized technology to support the production of enterprises. For example, production process, simulation tools, assembly standards and large databases used in product production. 40
The intelligent Internet of Things network is based on the Internet of Things and intelligent sensing technology to connect manufacturing resources with the industrial Internet of Things to control manufacturing resources. In this paper, Radio Frequency Identification Technology (RFID), Global Positioning System (GPS), and Wireless Sensor Networks (WSN) are used to build the intelligent iota network, as shown in Figure 2.

Electromagnet intelligent iota network.
Electromagnets belong to discrete manufacturing products. Therefore, the production process of the product is divided into multiple processes. When the product enters the cache, processing, and out of the cache, the RFID tag should be scanned. On the one hand, it can ensure that the production products will not be lost during the assembly process. On the other hand, it can evaluate the assembly quality and the working quality of the assembly workers. The whole intelligent logistics network is described as follows. First, the logistics vehicle receives the material request form and goes to the specified location of the raw material warehouse through WSN and GPS system. Then, the material is sent to the material staging area and returned to the material warehouse. Second, the process assembler or assembly manipulator scans the RFID tag information to assemble the specified parts. Shop assembly lines send products to the next process. Finally, after the product assembly is completed, the product is scanned by the scaffolding RFID reader, and transported to the finished product warehouse, as shown in Figure 2.
The information communication network is an important device connecting the physical layer and the virtual layer, and plays the role of receiving and sending data. This includes Wi-Fi, Bluetooth, routers, network interfaces, and communication standards. For directly acquired data, such as product location, product voltage test data, and other quality characteristics, Bluetooth directly interacts with the virtual layer through Wi-Fi. For the data that cannot be directly obtained, such as the appearance of the product, which need to be checked manually, the data is transmitted through the computer.
Virtual layer
Virtual layer is the core layer to realize real-time data-driven manufacturing process. It mainly includes multi-model fusion of physical layer, real-time data storage, and industrial communication. The virtual layer works as follows. First, the physical objects of the assembly process are mapped to the virtual layer through devices such as sensors, actuators, communication elements, etc. Then, the virtual layer collects various data of the physical object and manages it through the industrial communication equipment. At the same time, the model of physical object is constructed, and the model management is carried out by multi-model fusion method. Secondly, data and model are connected through information interworking, information management and information model. Finally, the virtual layer feeds back the data calculation results from the application layer. The operating mode of the virtual layer is shown in Figure 3.

Flowchart of the virtual layer.
Application layer
The application layer is the platform to control the entire assembly system. DTs do not have a clear definition of the settings at the application layer. This paper is the risk intelligent decision of the assembly process, so the design of the application layer is as follows. During the electromagnet assembly process, quality characteristics data are displayed on the workshop visualization panel. Some of this data is entered directly through the slave computer, and some is transmitted through technology such as RFID. After receiving the data, the application layer determines the causes of failure by combining the functional analysis and structural analysis of the product. Then, the failure information is sent to each evaluation expert to collect evaluation information. Secondly, the evaluation information is transmitted to the computer server, and the data is processed by the embedded improved FMEA method. Finally, the failure mode analysis results are fed back to the virtual layer through the production control center, and the physical layer is adjusted synchronously. The operation process of the application layer is shown in Figure 4.

Operation flowchart of the application layer.
Quality risk decision method of electromagnet assembly DT system
The physical layer and virtual layer of the DT system in the electromagnet manufacturing process are responsible for real-time data acquisition and interaction. In the application layer, the data is processed by the built-in algorithm to realize the established functions of the DT system. The flow chart of the new method for electromagnetic brake risk assessment is shown in Figure 5.

Risk analysis flow chart of electromagnetic brake assembly process.
Solve the evaluation expert weight
Let
The expression of hesitancy degree

Where
Let
(a)
(b)
(c)
(d)
Where
Let the established FMEA team consists of

Let
EMs analyses failure modes and potential risks. In order to facilitate calculation, this paper adopts the method to standardize q-RDHFN which introduced by Sumera Naz.
43
For example,
To ensure the objectivity of the weight calculation for evaluator, it is necessary to consider both the qualifications of the evaluator and the authority of their evaluation information. Firstly, the DT in this paper assigns initial weights to the evaluator by counting the number of times they have participated in FMEA for electromagnetic brakes. Secondly, in FMEA analysis, we believe that evaluation information, although fluctuating, always revolves around a central point. Therefore, this paper determines the objective weights of the evaluator by calculating the distance between their evaluation information. Finally, the initial and objective of weights of the evaluator are combined to determine the final weight information.
The EMs weights are solved by BPM.
1. Let the initial expert’s weight
2. According to the initial expert weights, the evaluation information was aggregated by the q-Rung Dual Hesitate Fuzzy Power Bonferroni Mean (q-RDHFPBM). Let

Where
Then get all EMs q-RDHF mean values evaluation matrix
3. We can obtain similarity measurement

Where

Where
4. We calculate the overall similarity measurement
5. We compute the objective weights of each EMs.

Where
6. Then, we calculate the combinational weights of expert.

Where
Solve the comprehensive weight of risk factors
Entropy weight method is the earliest and most commonly used method for calculating weights. It determines weights based on the degree of information dispersion, but it ignores the correlation between risk factors. If two risk factors are strongly correlated, even if they have a high degree of dispersion, their impact on the final result will be small. Therefore, the CRITIC method is used to assign lower weights to risk factors with strong correlations. Additionally, the FMEA manual believes that the scoring of risk factor S should be paid attention to. Therefore, in order to maintain the intent of FMEA to prevent failures, this paper uses BWM to set risk factor S as the best attribute, emphasizing its importance.
1. Let’s say the best attribute
2. EMs use 1–9 to evaluate the degree to which the best attribute
3. The mathematical model for solving the optimal weights

Where
4. The score function is a way to objectively express the evaluation information. Sometimes use score function
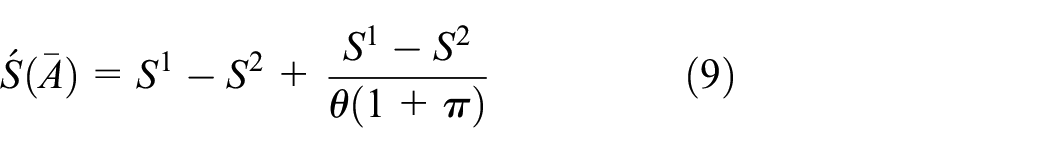
Where
Therefore, we can obtain the score matrix

Where
5. According to the definition of information entropy in information theory, the information entropy

Where
6. We calculate Pearson correlation coefficient of normalized matrix

Where
7. We calculate the

Where,
8. We calculate the optimal weights


Therefore, the weighting expression for risk factors is as follows.

Solve the failure mode risk values
When we prevent failure modes from occurring, it should be targeted. The risk degree of failure mode can be judged by calculating the risk value of failure mode. The value gives us the direction of targeted prevention.
1. We compute integrated information with weighted sums for decision options


Where
2. Three aggregation strategies are used to calculate the relative importance coefficient of the evaluation information.


Where
3. We calculate combined utility value
The risk assessment of electromagnet assembly process is determined based on value
A case study
We divide this section into two parts. In the first part, we apply the newly proposed method to the risk assessment in the electromagnetic brake assembly process of DT platform. In the second part, we compare the results calculated by the new method with those calculated by other methods.
A case analysis
Electromagnetic brake can be matched with the motor into a new type of braking motor. It can also be used in mechanical transmission system, to achieve fast braking and accurate positioning. This paper takes a certain type of friction disc electromagnetic brake as an example for analysis. Its structure diagram is shown in Figure 6.
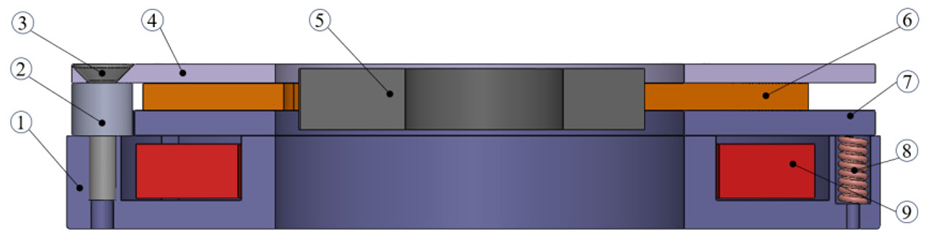
Friction disc type electromagnetic brake.
DT provide data for FMEA as a reference for analysis. The evaluators view the abnormal data in the structural tree and functional tree of the electromagnetic brake assembly process on the data application. Based on the abnormal points, a failure tree for the assembly is constructed and evaluated using the new method. The settings of the assembly production line are adjusted based on the evaluation results. The settings are verified in virtual manufacturing before being fine-tuned at the physical layer via the application layer. The assembly process of the electromagnetic brake based on the DT platform is shown in Figure 7.

DT framework for the electromagnet brake manufacturing process.
In Figure 7, we place RFID tags on the assembly trays of electromagnetic brakes. Firstly, product data is entered into the virtual layer in advance, which includes structural parameters, performance parameters, and other aspects of the product design. Then, at the physical layer, operators at the workstation read the tags to obtain and upload real-time product data. Finally, in the application layer, the structural tree, functional tree, and failure tree of the product are used to calculate the deviation between the design parameters and real-time data, as shown in Figures 8–10. The evaluators compile potential failure modes caused by error data, as shown in Table 1, and conduct evaluations. Preventive measures are taken for high-risk failure modes.
Structure tree of electromagnetic brake.

Function tree of electromagnetic brake.

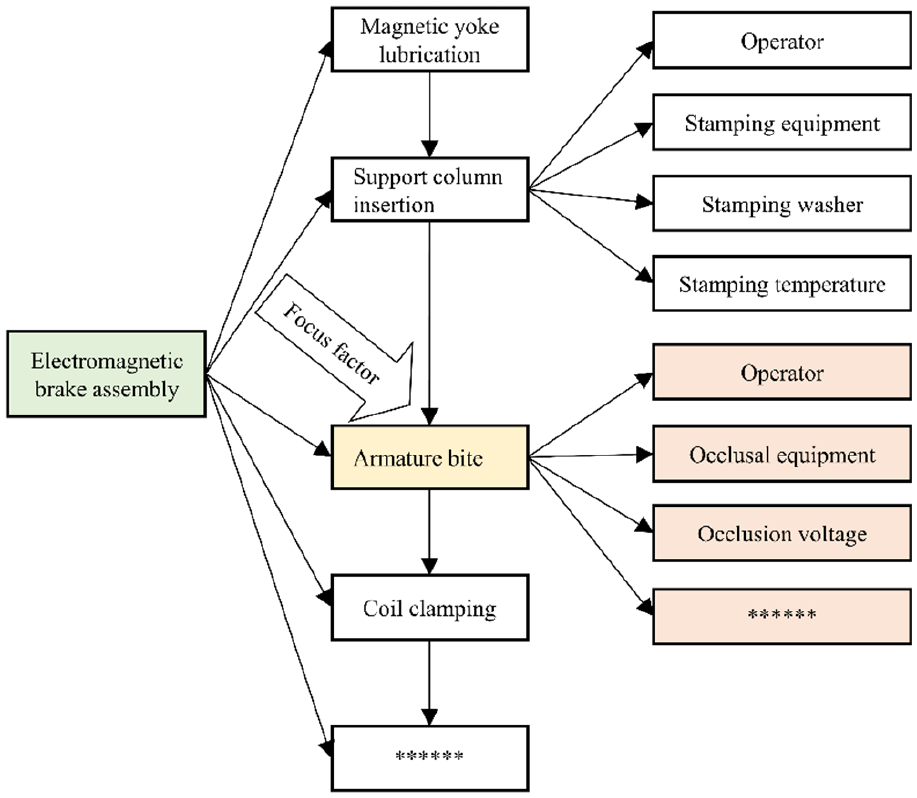
Failure tree of electromagnetic brake.
Quality risk modes and influence analysis of electromagnetic brake.

The first step in risk analysis is to form an evaluation team. This paper selects three experts from quality management, manufacturing, and product design to form an evaluation team, they’re called EM1, EM2, EM3. Firstly, Three EMs evaluated the three risk factors S (Severity), O (Occurrence), and D (Detection) of 10 potential quality failure risk modes respectively by using q-RDHFN, the original evaluation matrix
EM1 has been engaged in quality management for more than 10 years, and he has bachelor’s degree and engineer’s title, and his failure mode evaluation table is shown in Table 2.
Evaluation information of EM1.

EM2 has been engaged in product manufacturing and assembly for 5 years, and he also has the ability of process design. He has a master’s degree and a senior engineer’s title. His failure mode evaluation table is shown in Table 3.
Evaluation information of EM2.

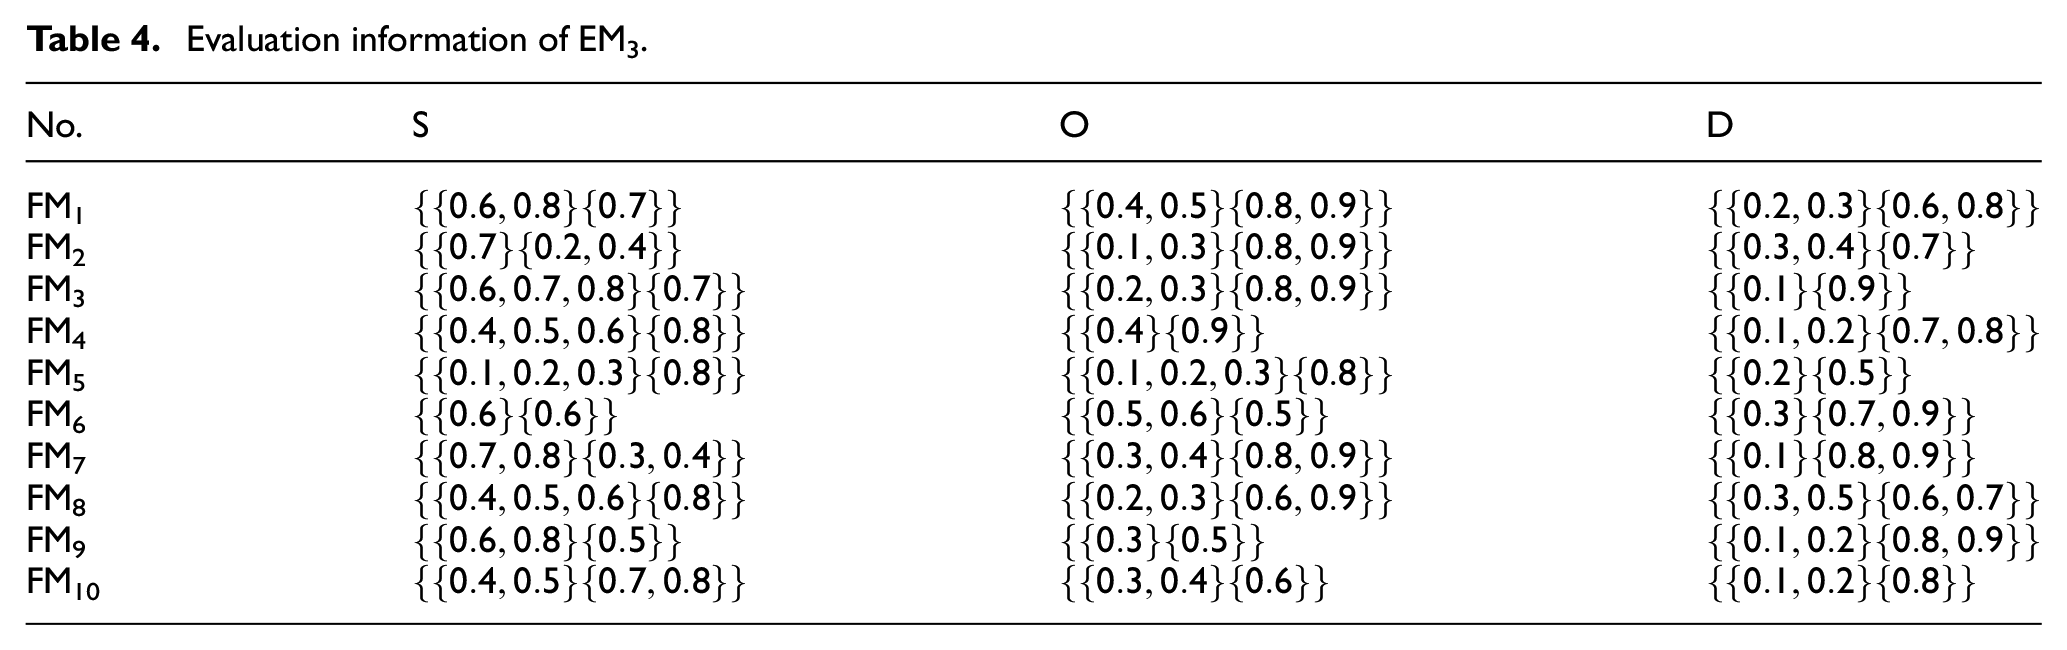
EM3 has been engaged in product design for 8 years, and she knows something about quality management. She has a master’s degree and a senior engineer title. Her failure mode evaluation table is shown in Table 4.
Evaluation information of EM3.
In this paper, the previous EMs failure mode evaluation in the DT system is statistically analyzed, as shown in Figure 11. The final initial weights of expert are


Evaluator information on the DT.
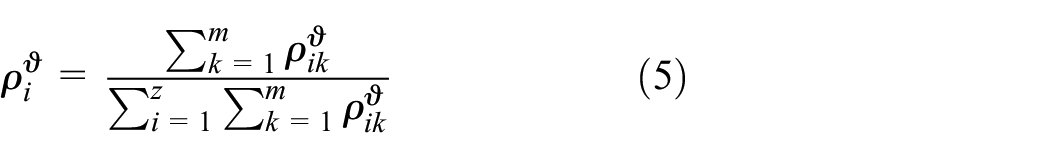
Next, according to equation (5), the overall similarity
Similarity of risk factors for EM.

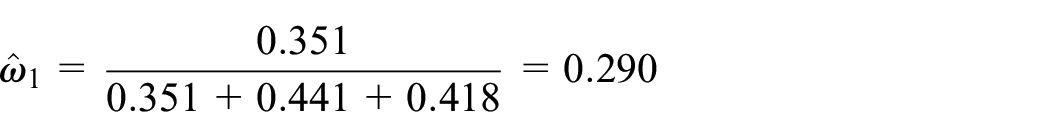
Then by equation (6), we can obtain objective weights

Similarly, the objective weights of EM2 and EM3 is 0.334 and 0.326. Therefore, the calculation of combinational weight of

The combinational weight of EM2 and EM3 is 0.290 and 0.313.
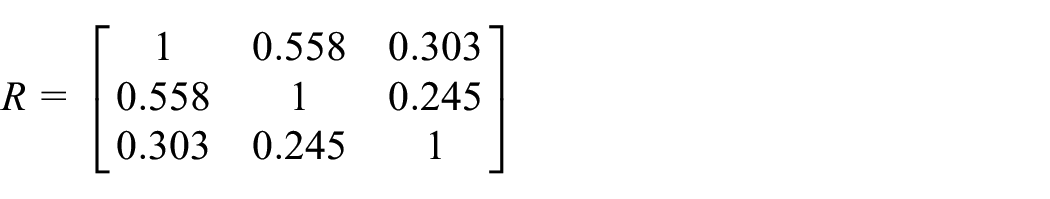
The
Relative importance of risk factors.

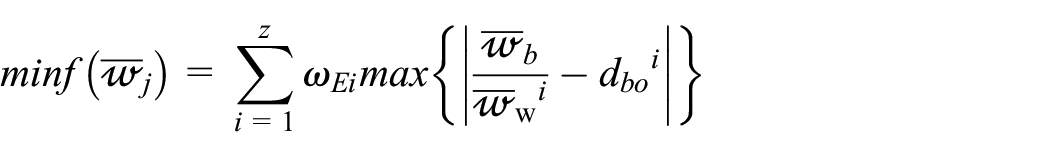
According to the relative importance information of risk factors in Table 6, LINGO software was used to solve equation (8) to obtain the subjective weight of risk factors. We have the weight of the evaluator as
After computation, the results are presented in Figure 12. According to Figure 12, to obtain the subjective weight of risk factors


LINGO software’s calculation results.
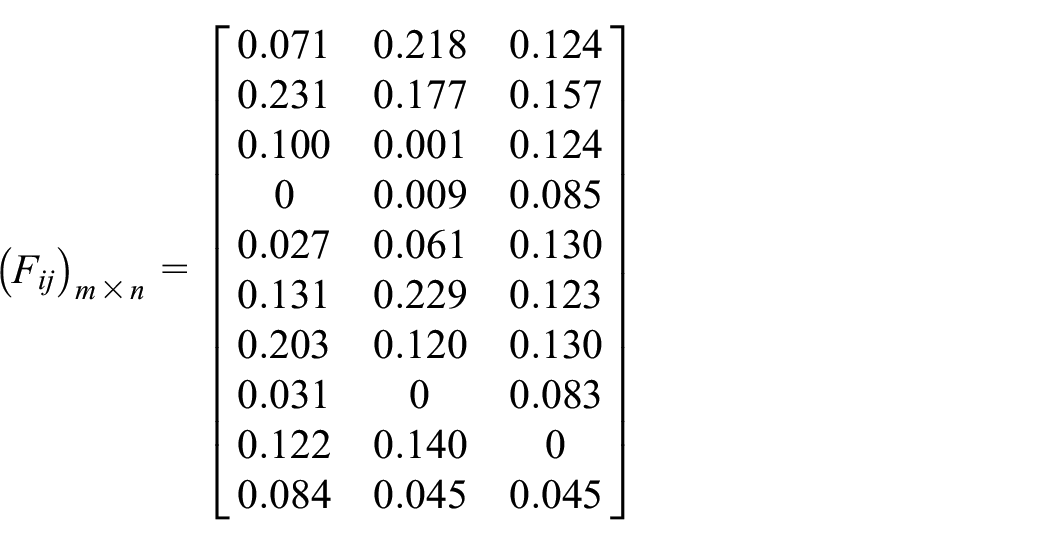
The risk factors score of each failure modes of q-RDHF evaluation matrix

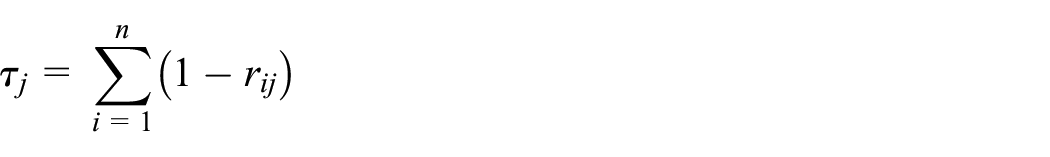
On basis of previous studies, the higher the risk factors are, the higher the risk ranking is. Therefore, according to equation (10), all indicators are treated as

According to the definition of information entropy in information theory, we compute the information entropy of risk factor

Taking the calculation of


According to equation (18), we can get the objective weights of risk factors information entropy

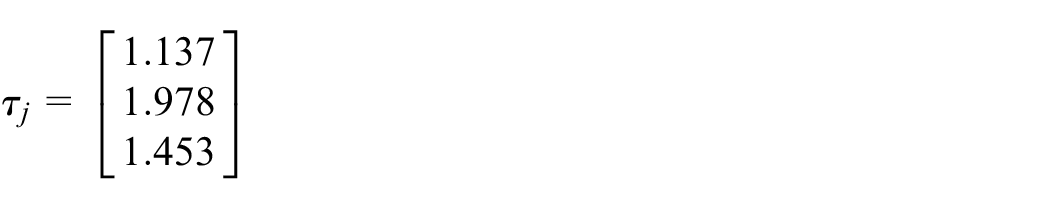
According to equation (19), we can get the objective weight

Taking the calculation of
Because in equation (8), we get

We compute integrated information with weighted sums for evaluation options


According to equation (22), by using three appraisal score strategies to generate relative weights of electromagnetic brake quality failure risk modes. The results are shown as follows.


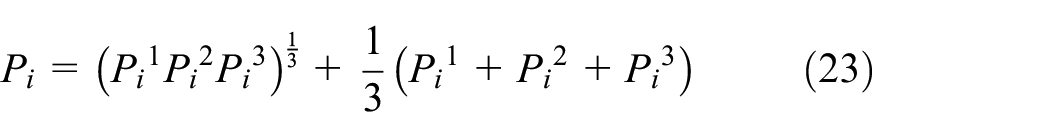
In the end, according to equation (23), we calculate combined utility values
FM1 = 3.256, FM2 = 4.044, FM3 = 2.092, FM4 = 1.155, FM5 = 2.209, FM6 = 3.612, FM7 = 3.489, FM8 = 1.322, FM9 = 2.003, FM10 = 1.934.
The final electromagnetic brake quality failure risk modes ranking is
In the DT virtual layer, the evaluator uses q-RDHFN to evaluate the failure mode. Through the built-in algorithm, BPM solves the evaluator weight, BWM and CRITIC solve the combined risk factor weight, CoCoSo compromises the calculation and ranking of failure modes. After the quality risk decision result is obtained, the DT application layer makes decision preparation. This is the processing and encoding of the results in order to convert the results into a format suitable for transmission. Secondly, the result of format conversion should be encapsulated. This is to encapsulate the identification information of the result, such as the source address, destination address, serial number, etc., into a packet or data frame. Finally, the result of the decision is passed on. The result transmission can be achieved through LAN, WLAN, cloud network, database synchronization, message queue, and other network protocols. After receiving the decision result, the DT virtual layer unseals the encapsulated result data. At the same time, the virtual layer interacts with the physical layer to feedback the decision results to the physical layer. The specific process is shown in Figure 13.

Flow chart of risk decision result transfer in DT.
Result discussion
In order to prove the feasibility and effectiveness of the new method proposed in this paper. The results of the new method are compared with those of TOPSIS method, 45 VIKOR method, 46 and improved PROMETHEE II method. 47
In the comparative computational analysis of methods, we make the following provisions. First, take the result calculated by the scoring function of equation (9) as the raw data, as shown below. Then, the evaluation index used in this paper are all benefit attributes. Finally, evaluation expert weights and risk factor weights are the same as used in the new method.

The calculation results are shown in Table 7. As can be seen from Table 7, among the top five failure modes of value-at-risk ranking. The rankings of FM5, FM6, FM7, and FM3 are different. Therefore, this paper designs some experiments to verify the differences.
Risk ranking comparison of different multi-attribute evaluation making methods.

Aiming at several failure modes of risk ranking differences, this paper designs and builds an experimental platform to artificially cause the failure. As shown in Table 8.
Accelerated experimental design.

In Figure 14, the pendulum is swung to a certain height and then released to hit the sample, causing the failure of parts loose. The protractor and force transducer are used to control the impact force. In Figure 15, the sample is placed on the fixed installation, and the bolt on the force transducer is frequently pulled until the force curve on the computer screen falls below the acceptable line. In Figure 16, the upper brake plate of the sample is placed on the stage. By moving the three-dimensional probe with the operating lever, we measure the surface flatness of the upper brake plate. This is because any unevenness in the upper brake plate of the electromagnetic brake will result in the failure of “braking action not smooth.” In Figure 17, a test voltage and current are applied to the sample, and the test signals are collected. These signals are converted into impedance parameters and displayed on the display. We select the samples with poor impedance.

Impact testing machine.

Tensile testing machine.

Three-coordinates measuring machine.

Impedance measuring instrument.
After the production of the samples for each failure mode, they are placed on the testing platform for testing, as shown in Figure 18. The test principle is as follows. The electromagnetic brake realizes braking by clamping the active part through the brake plate. Therefore, when the electromagnet is working, the gap of the brake plate becomes smaller. According to Lenz’s law, it creates an induced electromotive force that prevents the current from increasing. As shown in Figure 19.

Electromagnetic brake test platform.

Schematic diagram of the result of normal braking.
Therefore, when the electromagnetic brake cannot work, no induced electromotive force will be generated, and the current will not fluctuate. In addition, for quick statistical results, the brake plate material is resin-based. Finally, we recorded the number of sample braking times. As shown in Table 9.
Data of braking number were tested experimentally.

According to the experimental data, the fewer braking number, the greater the impact of failure mode. Therefore, the failure mode risk ranking is
Conclusions
This paper proposes an intelligent risk analysis method for electromagnetic brake assembly process based on DT, which has the following advantages.
1. We describe a risk analysis model, which provides risk assessment ideas for distributed workshop production and customized product production.
2. The subjective and objective weights of evaluators and risk factors are considered in this paper, which has greater advantages than the previous single weight method.
3. The CoCoSo method, based on combinatory compromise solution, is utilized to prioritize potential failure risks and effectively utilize weight information.
In the future, scholars can optimize the evaluation language. Based on the actual situation of electromagnetic brake, the particle size of the language used is uniform and balanced. But for special cases, the granularity of the language can be non-uniform and non-balanced. The design of language granularity is important for the final evaluation.
Footnotes
Handling Editor: Sharmili Pandian
Declaration of conflicting interests
The author(s) declared no potential conflicts of interest with respect to the research, authorship, and/or publication of this article.
Funding
The author(s) disclosed receipt of the following financial support for the research, authorship, and/or publication of this article: This work was supported by the National Natural Science Foundation of China (Nos. 72271167, 72071149) and General project of Education Department of Zhejiang Province (No. Y202352387).
Data availability
The data used to support the findings of this study are included within the article. Further data or information are available from the corresponding author upon request.