
Abstract
This research paper demonstrates a case study of a community-centric Earth-Air Cooling system on the Budhanilkantha. The research comprises critical attempts, encompassing heat exchanger design employing the Log Mean Temperature Difference (LMTD) technique, load estimations accomplished utilizing TRNSYS, and temperature abatement assessments executed through ANSYS simulations. The cooling system employed Geothermal energy for summer cooling. The optimization of heat exchanger dimensions required the development of pressure drop-surface area graphs utilizing spreadsheet tools. This resulted in an optimal design characterized by a tube velocity of 4.5m/s, a tube length of 46m, and a total of 12 tubes. This design led to a 33% temperature reduction, noticeably beyond the projected threshold of 23%. The Earth-Air Cooling system displayed a large heat dissipation capacity of 53.2kW, exceeding the peak cooling load requisites. This method provides a cooling mechanism for Budhanilkantha and indicates a more comprehensive application in analogous environmental contexts. To find the optimal sizing of the heat exchanger, a methodology was designed to develop an equation applicable to the domain of Nepal and all around the world that comprises similar climatic conditions.
Introduction
Background
In the modern era, the search for daily comfort is crucial. Rising temperatures require cooling solutions, while sudden drops demand heating, often via HVAC systems. Buildings consume over 40% of global energy, producing around 30% of related greenhouse gases. 1 Traditional heating and cooling systems significantly impact the environment. Renewable energy systems (RES) offer efficient alternatives. Ground cooling/heating, a passive technique, utilizes stable subsurface temperatures. 2
Earth-air cooling systems, also known as ground-coupled heat pump (GCHP) systems, have emerged as an efficient method for climate control in buildings. These systems leverage the relatively stable temperatures of the ground to provide heating and cooling, offering significant energy savings and environmental benefits compared to conventional air-source heat pumps (ASHPs). GCHPs utilize the earth’s near-constant subterranean temperature, which remains relatively unaffected by seasonal changes, making them more efficient for indoor climate control. The basic principle involves circulating a fluid through underground pipes, where it absorbs or dissipates heat, depending on the season. This heat exchange occurs in borehole heat exchangers (BHEs) installed vertically or horizontally in the ground. 3
Several factors, including the ground’s thermal properties, the heat exchanger’s design, and the operating conditions, influence the efficiency of GCHPs. Studies have shown that GCHPs can achieve higher efficiencies than ASHPs, particularly in regions with extreme weather conditions. 4 For instance, systems using CO2 as a working fluid have demonstrated substantial performance improvements, achieving coefficients of performance (COPs) ranging between 2 and 4 depending on the application. 5 Solar-assisted ground-coupled heat pump (SAGCHP) systems have been developed to enhance the efficiency of GCHPs further. These systems integrate solar thermal collectors with GCHPs to provide additional heat, thereby reducing the load on the ground source and improving overall system performance. The integration of solar thermal energy can also help manage thermal imbalances in the ground, extending the system’s operational lifespan. 6
With its diverse climatic conditions and growing energy demands, Nepal presents an ideal location for implementing and studying GCHP systems. The country’s geographical diversity, ranging from lowland Terai to the high Himalayan regions, offers unique challenges and opportunities for deploying such systems. Implementing GCHP systems in Nepal can provide sustainable and efficient heating and cooling solutions, reducing reliance on traditional energy sources and minimizing environmental impact. Further research and development in this area are crucial to optimize these systems for widespread adoption and to harness their full potential. 3
Implementing GCHP systems in Nepal can provide sustainable and efficient heating and cooling solutions, reducing reliance on traditional energy sources and minimizing environmental impact. The novelty of this research lies in developing and optimizing an Earth-Air Cooling System (EACS) explicitly tailored for the climatic conditions of Nepal, using advanced simulation techniques and innovative design principles. This study achieves a significant temperature reduction of 33% beyond the projected threshold and formulates a new equation for the optimal sizing of heat exchangers applicable globally in similar climates. Moreover, it demonstrates the feasibility and effectiveness of utilizing geothermal energy for sustainable cooling, significantly contributing to energy efficiency and environmental sustainability in building design.
Literature review
This study includes a comprehensive examination of the pertinent literature, primarily focusing on guidelines, design principles, cooling load estimation, and simulation methodologies pertinent to Earth Air Heat Exchangers (EAHEs), an integral facet of renewable energy applications.
In this domain, essential guidance and principles have been established by organizations specializing in Building and Renewable Energy, with notable contributions from Canmet Energy Ottawa, underscoring a systematic approach encompassing design principles, site-specific considerations, and critical parameters such as earth tube dimensions, including depth, diameter, and length. 7 Sazon and Nikpey demonstrated that a CO2 solar-assisted ground-coupled heat pump system achieves high efficiency and cost-effectiveness comparable to conventional systems with optimal design and operation. 3 Dai et al. proposed a combined heating and cooling transcritical CO2 system integrated with dedicated mechanical subcooling using a hydrocarbon mixture. They used machine learning and multi-objective optimization to evaluate and enhance system performance. The study found that utilizing a hydrocarbon mixture for subcooling significantly improved the coefficient of performance (COP) and reduced life cycle carbon emissions (LCCP) compared to traditional systems, though it slightly increased initial capital costs. The optimal mixture, R1270/R601a (53/47), achieved the best balance between efficiency, cost, and environmental impact, suggesting a promising approach for sustainable food processing applications. 8 Dai et al. evaluated a cascade mechanical subcooling CO2 commercial refrigeration system’s exergy, carbon footprint, and cost lifecycle. They proposed three configurations for the CO2 system with multi-stage dedicated mechanical subcooling (MS-DMS). They conducted a life cycle assessment, comparing it with baseline CO2 booster and traditional R404A systems across eight Chinese cities. The study found that the triple-stage DMS (TS-DMS) system significantly reduced exergy destruction, enhanced annual exergy efficiency by 11.92%–18.48%, and lowered life cycle climate performance (LCCP) by 6.87% in warmer regions. Additionally, the TS-DMS system reduced life cycle cost (LCC) by 6.8%, demonstrating its suitability for warm or hot regions due to its improved emission reduction and lower lifecycle cost. 6
A crucial element in EAHE design precision pertains to the computation of cooling loads tailored to the specific structure under consideration. Hashim et al. has offered a valuable overview of cooling load calculation techniques customized to the cooling requirements of buildings. 9 This study carefully incorporates the guidelines stipulated by the American Society of Heating, Refrigerating, and Air-Conditioning Engineers (ASHRAE), as outlined in the ASHRAE Fundamentals Handbook of 2001. This handbook provides a robust framework for cooling load computation, grounded in variables such as site dimensions, occupancy rates, material compositions, orientation, temperature profiles, and air properties (ASHRAE, 2009) 10 .
Similarly, adopting ASHRAE’s guidelines and performing calculations involving the Corrected Cooling Load Temperature Difference (CLTD) values, Shrestha’s study addressed the transition from the 40° Latitude CLTD to the 28° Latitude region, thereby elevating the accuracy of cooling load estimation for a commercial edifice situated in Pulchowk, Nepal. 11
In studying Earth-Air Heat Exchangers (EAHE), certain factors are significant, including how deep the pipes are buried, the speed of the air moving through them, and the length of the pipes. Research by Sanjeev Jakhar has shown that ground temperatures stay remarkably stable, even when the weather above ground changes, as long as the pipes are buried deeper than 3.7m. His research also found that the temperature difference between the ground and the air above can be as much as 14°C. Interestingly, the speed of the air moving through the pipes affects how well the system cools: faster air speeds can make the air coming out cooler, but if the air moves too fast, it might increase room temperatures. The best airspeed for cooling, according to this study, is between 2 and 3m/s. 12 Bansal et al. research provides a detailed look at how Earth-Air Heat Exchangers (EAHE) perform in hot climates, explicitly focusing on Jaipur, India. This study tested different materials, like steel and PVC pipes, and experimented with various air flow rates and lengths of the heat exchangers. The results highlight how significantly the speed of air moving through the pipes affects the system’s effectiveness, even more so than the pipes’ material. According to the research, the efficiency of the system, measured by the Coefficient of Performance (COP), varied from 1.9 to 2.9 as the airspeed was adjusted between 2 and 5m/s. 13
The simulation tool TRNSYS has also become a crucial resource for calculating cooling loads. Junliang Cao has advanced the field by integrating the Weather Research and Forecasting (WRF) model with TRNSYS. This combined methodology allows for accurate predictions of heating and cooling demands for tall buildings in Harbin, China, enhancing the precision of climate control strategies in such structures. 14 Yau and Hasbi’s study examines how climate change impacts the cooling requirements in air-conditioned office buildings. This study uses the TRNSYS simulation tool to assess cooling loads over different periods, providing valuable insights into how changing weather patterns affect building climate control needs. 15
The study by Yang et al. focuses on the effectiveness of a building-integrated Earth-Air Heat Exchanger (EAHE) system in Taiwan, which is enhanced by integrating a water piping system. The research demonstrates that residential well water significantly boosts the system’s cooling capacity from 3.21 to 4.84kW and increases the moisture removal rate from 1.97 to 4.24h/h in summer. Additionally, it achieves a high Coefficient of Performance (COP) of 10.5 during summer, proving the system’s efficiency in maintaining comfortable indoor temperatures. 16 Han et al. used a 3D numerical model to evaluate design errors in ground source heat pump systems designed according to the ASHRAE method. The research highlights that higher fluid velocities in the system’s pipes significantly increase design inaccuracies. This finding is crucial for improving the design and efficiency of ground-source heat pump systems. 17 Sarbu and Sebarchievici’s research on ground-source heat pump (GSHP) technologies highlights their significant energy-saving potential across different climates. The study categorizes GSHP systems into types such as surface water (SWHP), groundwater (GWHP), and ground-coupled (GCHP) and introduces innovations like the “Geotherm” GWHP system designed to tackle flow rate and sediment issues. It further explores hybrid GCHP configurations that optimize energy efficiency for combined heating and cooling, tailored to specific climatic needs. Additionally, the paper evaluates the energy, economic, and environmental performance of these systems, affirming their applicability and effectiveness in various settings. 18
Rubalcaba Velasco et al. research on a geothermal air-cooling system marks a significant advancement in sustainable cooling technologies. His study effectively utilizes the temperature differences between the atmosphere and the stable underground environment to achieve cooling. This method demonstrated a notable reduction in temperature by 5°C, highlighting the system’s practical application and effectiveness in leveraging natural temperature differentials for cooling purposes. 19 McQuay, a specialized duct design software, has been integral in determining the cross-sectional dimensions of ducts for various applications. Specifically, it was used effectively in designing the ductwork for a restaurant dining area. The software helped calculate the required airflow rates and velocities based on the spatial layout of the area. By inputting these calculations into McQuay, the precise sizes of the ducts for each part of the dining area were accurately determined, ensuring efficient air distribution and optimal environmental comfort. 20
Sakhri et al. experimentally analyzed the thermal regulation abilities of earth-to-air heat exchangers in arid regions. The research demonstrates substantial temperature control, with a notable reduction in heating needs by approximately 13.2°C. These findings highlight the potential of earth-to-air heat exchangers to enhance thermal comfort and provide sustainable heating solutions in arid climates. 21 Sakhri et al. explored the effectiveness of earth-to-air heat exchangers (ETAHE) in semi-arid and arid environments through numerical simulations and field experiments. Their research demonstrated that ETAHE systems are easy to design and install, adaptable to different soil types, and effective in maintaining comfortable indoor temperatures year-round. The study also highlighted the potential for integrating ETAHE with renewable technologies like wind towers and solar chimneys, suggesting a pathway for sustainable and efficient climate control solutions in challenging environments. 22 Sakhri et al. conducted experiments to investigate the efficiency of an earth-to-air heat exchanger (EAHE) without external devices in an arid region. The EAHE was made of a PVC pipe buried at a depth of 1.5m in the agricultural zone of Bechar, Algeria. The study observed an increase of 19% in relative humidity (RH) in the humidification regime and a decrease of 27% in RH in the dehumidification regime. The daily working regime of the EAHE was 62.5% dehumidification and 37.5% humidification. The EAHE technique showed excellent potential for enhancing building hygrometry in arid regions. 23 Sakhri et al. conducted an experimental investigation to determine the effect of earth-to-air heat exchanger (EAHE) materials on overall performance. A comparison was made between the efficiency of steel and PVC pipes. The variation of vertical soil temperature from the soil surface to 140cm was determined. The study found that the pipe material (steel or PVC) had a small effect on the outlet air temperature leaving the system. However, the length of the pipe had a significant impact on the EAHE performance. 24
Similarly, various kinds of material such as pure water and heat transfer fluids are being used to increase efficiency by utilizing surface-modified nanofluids and a Peltier thermoelectric element as a heat source. 25 Using cooling water, the Coefficient of Performance improves significantly that is, around 36% while decreasing the temperature. 26 Likewise, reducing the base thickness of an air-to-air thermoelectric cooling system can lead to significant temperature. 27
Lastly, the orientation of heat exchangers also played a paramount role in reducing temperature. In the experiment conducted two types of blocks, spiral, and serpentine, were designed and tested under various conditions using Fe3O4/water nanofluid with a 0.2% volume concentration. Results were compared to traditional water cooling in terms of heat transfer rate and efficiency. Thermophysical properties of the nanofluid were analyzed experimentally and theoretically, and ANSYS-Fluent software was employed for CFD analysis and simulation. 28
Rationale
In Nepal, traditional construction methods continue to dominate, even as modern housing starts to appear in urban areas. However, there’s a noticeable lack of standardized criteria for energy-efficient building design, leading to high energy consumption, especially in heating and cooling systems striving for thermal comfort. Introducing and adopting energy-efficient building standards could greatly mitigate these issues. Implementing such standards could significantly lower energy usage, reduce costs associated with air conditioning, and promote a more sustainable and environmentally friendly living environment. These standards could serve as crucial tools for government actions aimed at sustainability. 29 The objective is the mitigation of factors that contribute to global warming, thereby fostering a more environmentally conscious and sustainable environment.
Methodology
Tools and techniques
The tools and techniques followed during the research project are illustrated in Table 1.
Tools and techniques followed during survey and methodology.

AutoCAD model
After careful efforts and detailed planning, the ISKCON Brahmachari Ashram in Budhanilkanta was chosen as the project site. Once the site was selected, the team received the layout plan of the building. Using this plan, they developed an AutoCAD model that produced very detailed architectural drawings. The model includes three different designs for the three-story building, designed to maximize natural air flow and sunlight, giving it an open feel from all sides. The building uses standard materials like concrete, bricks, and steel rods. Looking at the floor plans, the first and third floors have the same layout with two rooms and a common hall, whereas the second floor has a unique layout with four rooms. These architectural models and floor plans are visually represented in Figure 1.

(a) Layout of the first floor, (b) layout of the second floor, and (c) layout of the third floor.
Weather data
To gather weather data, the Meteonorm software was used to pull annual hourly temperature records. After selecting the project site, they pinpointed its exact location using Google Maps, obtained the geographical coordinates, and converted these into decimal values for easy entry into Meteonorm 8. The site is located at 27.8°N latitude and 85.4°E longitude. Meteonorm 8 provided a comprehensive set of parameters for the entire year of 2022, including global radiation, diffuse radiation, temperature, dew point temperature, wet bulb temperature, relative humidity, wind speed, and wind direction. This detailed collection of weather variables serves as a crucial foundation for the project’s simulations and analyses. The daily global radiation and daily temperature throughout the year are graphed in Figure 2.

(a) Daily global radiation from Metonorm 8, Data from Jan to Dec 2022 and (b) daily temperature from Metonorm 8, Data from Jan to Dec, 2022.
Building measurements
After a detailed on-site visit and inspection, it was determined that the construction of the Ashram mainly involved applying cement plaster over brick surfaces, with additional layers of cement plaster added for reinforcement. The precise measurements of the building’s components were calculated and are thoroughly documented in Table 2. These accurate measurements are crucial for the project’s design and execution, ensuring an accurate representation and thorough analysis of the building’s structural elements.
Building data of the building.

Following this, input variables for various zones were computed and scrupulously delineated for the project. To enhance the efficiency of this procedure, the rooms within the three-story structure were systematically classified into 10 discrete zones. These zones were established with the intent of expediting data input into TrnBuild, thereby enabling a methodical and well-organized depiction of the building’s multifarious regions. The specific particulars about each of the distinct zones are elaborated and are depicted in Table 3.
Input variables for different zones.

Based on the detailed AutoCAD models, the first story of the building is divided into a hall and two additional rooms. In our categorization, the hall is designated as “Zone 1,” while the other two rooms are identified as “Zone 2” and “Zone 3,” respectively. This zoning approach is consistently applied throughout the building, with the iteration process continuing for each subsequent floor. The final room on the third floor, which consists of one hall and two rooms, is denoted as “Zone 10.”
TrnBuild
TrnBuild provides users with a graphical user interface through which they can define a building’s thermal zones and input the necessary data in accordance with the BUI file format. This encompasses various parameters such as building dimensions, initial temperature settings, infiltration rates, as well as heating and cooling load values, which are initially integrated into the software.
Initial Temperature = 10°C (initial temperature for all the zone of building is assumed to be 10°C at the start hour of simulation) and humidity was taken as 50% for the initial data.
Infiltration
For Zone-1 and Zone-8, the Air Changes Per Hour (ACH) value is set within the range of 8–12. It is prescribed as 8 ACH when the space is unoccupied, and 12 ACH when the area is occupied, specifically in the hall room. In contrast, for the other rooms, an ACH range of 4–8 is applied. A lower value of 4 ACH is specified when there are no occupants in the room, while a higher value of 8 ACH is utilized when the room is in use. It is important to note that ACH is a dynamic parameter that can vary due to numerous factors. Human-related factors, the operation of air conditioning and fans, ventilation systems, the status of windows and doors, among other factors, have a significant impact on ACH values. Furthermore, the conditional ACH values are contingent on the current occupancy level within the area.
Cooling
In accordance with ASHRAE standards, the established thermal comfort range for the building is maintained between 20°C and 23°C. To ensure this comfort range is upheld, a cooling system is implemented for Zone-1, Zone-2, Zone-3, Zone-4, Zone-7, Zone-8, Zone-9, and Zone-10. The cooling system activates when the temperature surpasses the upper limit of 23°C in these specified zones, effectively maintaining a comfortable indoor environment within the defined temperature range.
Gains
The human metabolism factor plays a significant role in influencing the heat gain within the rooms. In the context of the Ashram, where the facility is primarily utilized for sleeping purposes, specific occupancy patterns are observed. Notably, in Zone-1 and Zone-8, each room accommodates 15 individuals from 6 PM to 8 AM, while other rooms simultaneously have two occupants during the same time frame. Furthermore, regarding lighting, two bulbs are installed in each of the zones, spanning from Zone-1 to Zone-10. These bulbs remain active from 6 PM to 4 AM, aligning with the arrival and departure schedules of the occupants, as they typically begin their day as early as 4 AM, necessitating the use of lighting during these hours. This comprehensive approach ensures that the thermal load and energy consumption within the Ashram are appropriately managed based on human activity and lighting requirements.
TRNSYS studio
The process involves utilizing data generated from TrnBuild, which incorporates building specifications and weather data files. These data inputs are used to execute simulations, ultimately yielding cooling load assessments for the 10 distinct zonal regions within the building. Subsequently, the maximum cooling load for each of these regions is identified. This approach enables a comprehensive evaluation of the cooling requirements, facilitating efficient energy management within the specified areas. The design setup layout is represented in Figure 3.

Design setup of simulation in TRNSYS.
In Figure 3, a schematic representation of the system configuration is provided, with each component playing a specific role in the simulation process:
Type 25c: This represents the printer, which is responsible for displaying the simulation results.
Type 56b: Refers to the data for the building model, extracted from TrnBuild.
Type 69b: Represents the sky temperature data.
Type 33: Denotes the dry bulb and dew point temperature values, typically obtained from Meteonorm8.
Type 109: Used to read the weather data file, also obtained from Meteonorm 8.
Type 14: Serves as the forcing functions, which transmit data to the equation generator.
Type 24: This is the quantity integrator, a component responsible for computing and integrating specific quantities.
Type 65d: Used as an online plotter, with 10 instances employed to visualize and display data for the 10 different zones. These online plotters depict the cooling load of each zone.
Design of EAHE
In the design process of the EAHE (Earth-Air Heat Exchanger) system, the choice was made to implement an open-loop system, where atmospheric air with outside temperature is circulated along the heat exchanger. Several critical factors were considered to directly influence the system’s performance. These factors included:
Design Parameters: Various design parameters, such as the flow velocity of air through the heat exchanger, tube length, tube diameter, depth of installation, tube material, and more, were carefully considered to ensure efficient heat exchange.
Summer Weather Conditions: The local weather conditions during the summer season were a significant factor. This encompassed ambient air temperature and soil temperature at a specific depth, both of which affect the system’s operation.
Thermal Conductivity: The thermal conductivity of both air and soil was crucial in determining the efficiency of the heat exchange process.
Earth Tube Field Geometry: The physical layout and design of the earth tube field were important, as they directly influenced the system’s heat transfer capabilities.
In the design of the heat exchanger, two primary methods were available: the Logarithmic Mean Temperature Difference (LMTD) and the Number of Transfer Unit (NTU) methods. Given that the inlet temperature, outlet temperature, and soil temperature were known, the LMTD method was chosen. Multiple iterations were performed to determine the appropriate size of the heat exchanger.
During the heat exchanger design, several assumptions were made, including:
Negligible Pipe Thickness: It was assumed that the thickness of the pipes used in the heat exchanger was small and had negligible thermal resistance throughout the heat exchange process.
Uniform Soil Properties: The soil was considered to have uniform properties within the given layer, including isentropic behavior and uniform heat conductivity.
Constant Air Flow: It was assumed that the air flow remained constant and uniform across the entire heat exchanger.
Constant Heat Transfer Coefficient: The heat transfer coefficient was assumed to be constant and not subject to variation along the length of the heat exchanger.
These assumptions served as the foundation for the heat exchanger design, allowing for the calculation of an efficient and effective system that met the project’s specific requirements.
Following were the calculations procedures and equations used during this research.
The heat capacity rate of earth is much larger than that of the air. The rate of heat transfer is given by, 30

From the equation (1), mass flow rate was determined. The cross-sectional area of the heat exchanger pipe was determined by using equation (2) as 30 :
After determining cross-sectional area, diameter was determined by 30 :

The heat transfer from air inside the heat exchanger to soil is due to natural convection. To find the convection heat transfer coefficient, we need to find the characteristics length of the pipe, Grashof number. 30

Then the heat transfer coefficient of the soil at the given depth was found out by using the following equation. 30


The length of the heat exchanger, the equation was given by, 30

The above parameters were calculated by the following procedures.
Calculation of heat transfer coefficient of air
The heat transfer was due to the forced convection. So, heat transfer coefficient is given by, 30

To find the Nusselt number, we need the value of Reynolds number, which is given by 30 :

If

Overall heat transfer coefficient is given by, 30

The log mean temperature difference was calculated by using the formula,

Similarly, to calculate the area and volume of different parts and rooms, following formulas were used:


Heat exchanger sizing
During the design phase of the Earth-Air Heat Exchanger (EAHE), various factors were considered, including survey data and local environmental conditions. Pipe diameter selection was based on the standard sizes available in Nepal, and the inlet temperature was set at the highest ambient temperature recorded throughout the year, while the outlet temperature was fixed to streamline the design process and ensure effective system operation.
Heat transfer in EAHE systems occurs mainly through forced convection, driven by fans or blowers that induce fluid movement. 30 However, temperature variations within the fluids can also lead to buoyancy forces, creating natural convection effects that assist in heat transfer. Although natural convection effects are typically minimal compared to forced convection, they play a role under certain conditions. As fluids move through pipes and interact with the pipe surfaces, they generate internal convective activity, enhancing heat transfer.7,29
The design process involved selecting appropriate pipe diameters – 10, 20, 30, and 40cm – based on their compatibility with air velocities between 2 and 5m/s. The highest temperature at the ISKCON site in Budhanilkanta, Kathmandu was 33.3°C, while experimental data suggested that the ground temperature stayed around 18°C during summer. High-Density Polyethylene (HDPE) was chosen for the heat exchanger material due to its lower pressure drop compared to PVC and steel pipes. 31 Various heat exchanger sizes were computed for different velocities and diameters, with corresponding pressure drops calculated for each size of the heat exchanger. As the flow develops, the flow becomes turbulence. The Reynold’s number ranges from 25,477.1 to 159,235.67 indicating that as velocity and diameter increased, the flow became more turbulent. This comprehensive analysis ensured that the design conformed to the specific project requirements while optimizing the heat transfer process.
The thermal properties that were used are given in the Table 4.
Thermal properties of unconventional materials that were used. 32

Figure 4 demonstrates a noteworthy correlation between the expansion of a heat exchanger’s diameter and the simultaneous increase in fluid velocity. This interrelationship leads to a reduction in the heat exchanger’s overall surface area, resulting in a shorter overall length while maintaining a constant diameter. However, the differences reduced after the velocity surpasses 4.5m/s. Figure 5 shows a pattern: an increase in the heat exchanger’s diameter corresponds to an increase in the Nusselt number, and conversely, a decrease in diameter corresponds to a lower Nusselt number. This reciprocal connection holds important implication. A higher Nusselt number triggers a proportional elevation in heat transfer coefficients, consequently leading to an enhancement in the total heat transfer rate. This underscores the interdependence between heat exchanger geometry and the efficiency of heat transfer processes.

Total surface area versus velocity at different diameter.

Nusselt number versus velocity at different diameter.
In Figure 6, it is apparent that a decrease in velocity and an increase in diameter conclude in a reduced pressure drop along the length of the pipe during the airflow. A graphical representation was generated to visualize the relationship between the total surface area and pressure drop, encompassing varying velocities at diameters of 0.1, 0.2, 0.3, 0.4, and 0.5m. The intersection points on the graph, where pressure drop and total surface area align at a given velocity, offer insights into the optimal total surface area of the pipe and the ideal velocity at a specific diameter. Figure 13 outlines the formulation of trend lines within the spreadsheet to derive equations. Through the solution of these equations, it was determined that the optimal fluid velocity is 4.5m/s, while the ideal total surface area is calculated to be 689.43m2. Additionally, the analysis indicates that approximately 12 tubes, each with a diameter of 0.4m, would be required to achieve optimal performance.

Pressure drops versus velocity at different diameter.
Upon the identification of the optimal heat exchanger dimensions, an array of parameters was calculated based on data extracted from the graphical representation presented in Table 5. The intricacies of the pipe layout, along with its detailed specifications, are thoroughly elucidated in Figure 7.
Parameters and values.

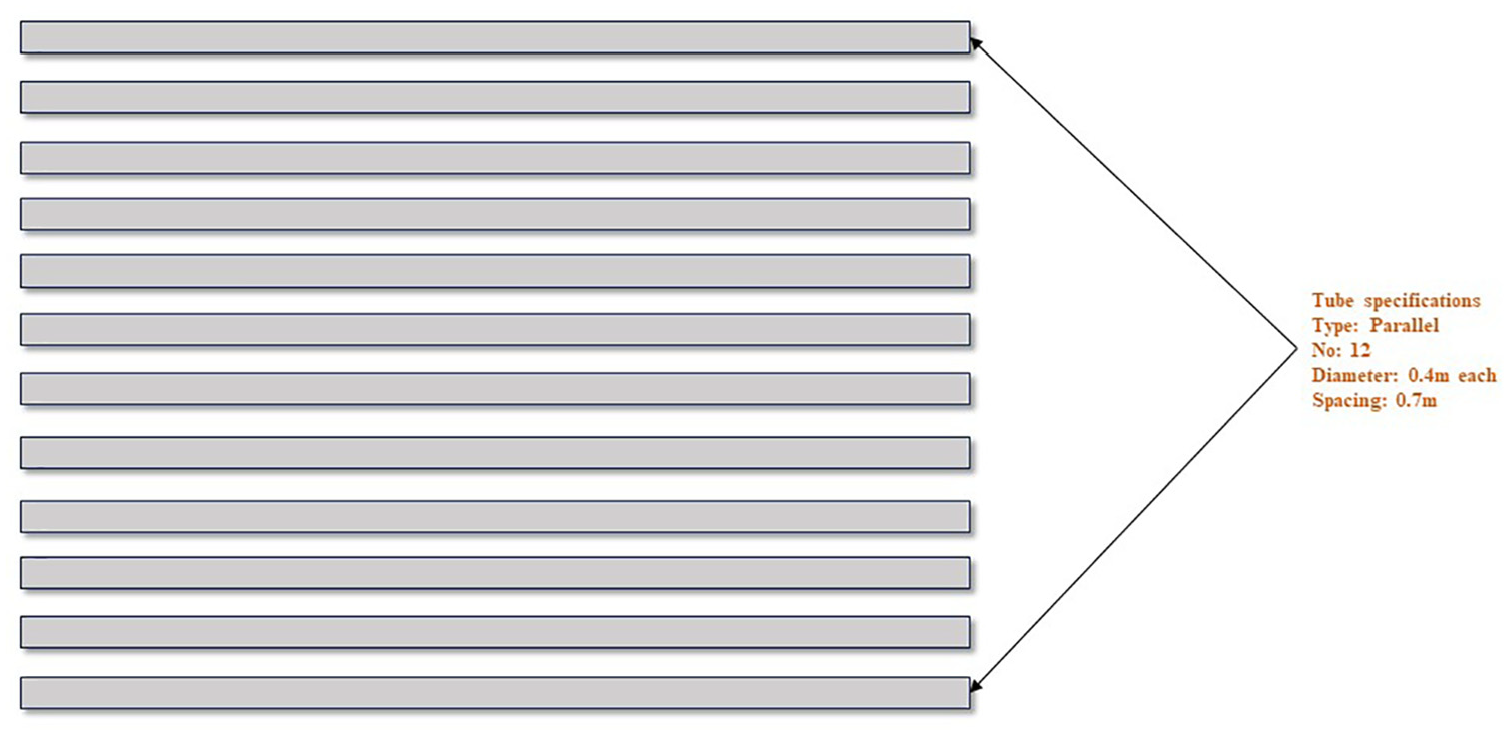
Pipe specification.
Duct sizing and zone simulation
The duct sizing was performed using the equal friction method, which maintains a consistent air velocity throughout the system, ensuring uniform friction loss along the duct’s length. Initially, the total airflow required for the ventilation system was determined based on factors such as building occupancy and its intended use. This overall airflow was then divided into multiple branches, each serving specific areas within the structure. The duct sizes were calculated using a spreadsheet application, employing the equal friction method to determine the necessary dimensions for each branch of the system. The sizes of the ducts required are tabulated in Table 6.
Duct sizing.

Zone simulation
The simulation aimed to examine temperature variations after installing an Earth-Air Heat Exchanger (EAHE) system in a specific room of a residential structure. The investigation focused on comparing the temperature fluctuations to the room’s maximum temperature before the EAHE system installation. The simulation was conducted using ANSYS Fluent, a computational fluid dynamics software, which helped analyze and visualize the temperature distribution within the room.
Geometry preparation
The geometry was constructed using Solidworks software. Utilizing the data collected from the survey, a room with the necessary layout was modeled. Following this, a duct, the dimensions of which had been calculated during the duct sizing process, was precisely combined into the room. This prepared geometry was imported into a modular design platform, facilitating geometry refinement and the outlining of room boundaries. Through the application of Boolean operations, the duct was efficiently subtracted from the room, achieving a dual objective of improving computational efficiency and optimizing the overall design.
Meshing and grid independence test
The discretization process involves dividing a model into multiple discrete elements, often referred to as nodes. The accuracy and reliability of the results obtained are associated with the quality of the mesh generated. In our case, an elemental size of 70mm was chosen, along with the implementation of a smooth transition setup to improve mesh quality. The mesh property and meshing are presented in Table 7 and Figure 8 respectively.
Mesh property.

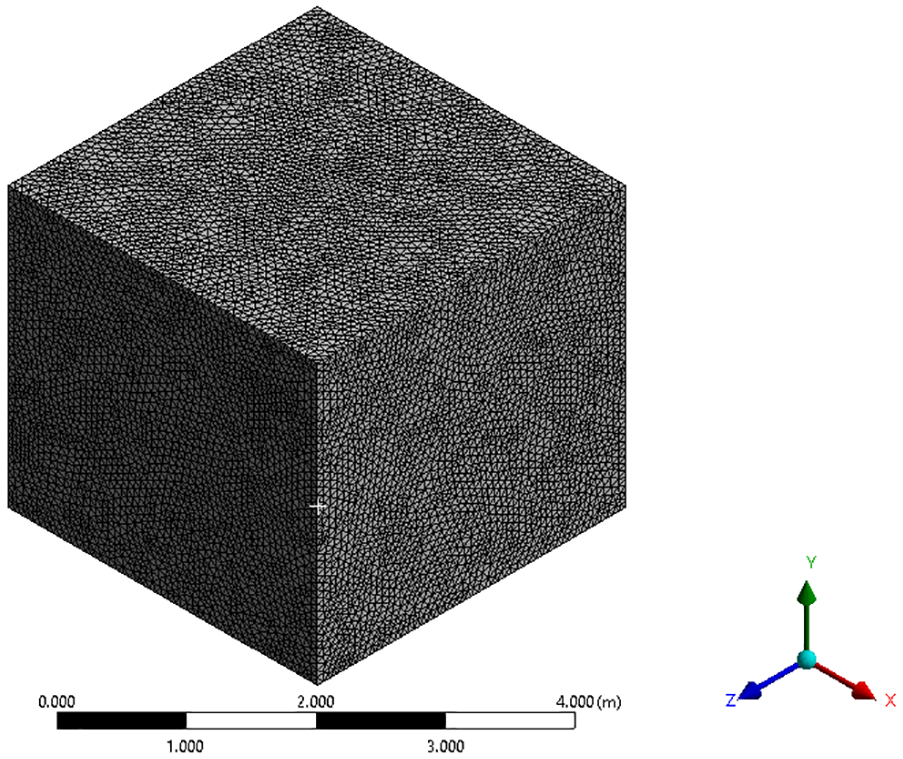
Meshing of Zone 10.
The graph presented in Figure 9, for the grid independence test shows the temperature (in Kelvin) as a function of the number of mesh elements used in a computational simulation. The test is designed to determine if the simulation results become independent of the mesh size, which is crucial for ensuring the accuracy and reliability of the simulation outcomes. As seen in the graph, the temperature stabilizes and reaches a plateau at around 297.2K with increasing mesh elements. The initial rise in temperature from approximately 296.4K at zero mesh elements to around 297.2K indicates that smaller meshes may not capture the system’s behavior accurately. However, beyond around 400,000 mesh elements, the temperature remains consistent even as the number of mesh elements increases to over 1,200,000. This behavior suggests that the simulation results have achieved grid independence; further refinement of the mesh beyond this point does not significantly alter the calculated temperature. Hence, the results can be considered valid and reliable for this specific parameter (temperature), demonstrating that the mesh density used is adequate for the simulations represented in this scenario.

Grid independence test result.
Setup
A thorough mesh quality assessment was conducted, and the energy equation was appropriately enabled. The selected viscosity model was the K-omega model. The cell zone boundary condition was specified as “air medium.” The mass flow rate was defined under the specifications determined during the duct design process, and the inlet flow temperature was set at 20°C. Additionally, the free stream temperature was determined based on the maximum temperature observed during the TRNSYS simulation. The specific parameters utilized in this analysis are succinctly summarized in Table 2. The equations are given below.
The mass conservation equation is given as 32 :

The momentum conservation equation is given by 32 :

Turbulence Kinetic Energy 32

Specific Dissipation Rate

The kinematic eddy viscosity is given by 32 ;

Results
The design of the Earth-Air Cooling system for a community is a big step toward sustainable and eco-friendly living. This project focuses on creating an Earth-Air Heat Exchanger (EAHE) that can cool up to 25 people across 10 rooms, handling a cooling load of about 53kW during hot summer months. The main goal is to reduce dependence on traditional air conditioning systems, which have a negative impact on the environment. The system uses the natural temperature difference between the hot outside air and the cooler underground environment to keep indoor temperatures comfortable. It consists of underground pipes that bring in outside air and allow it to exchange heat with the surrounding soil, cooling the air as it moves through the pipes. This cooled air is then distributed to the rooms through a network of ducts. The study looks closely at various design factors, including the size of the underground pipes, the necessary duct specifications for the distribution system, and the thermal properties of the soil. It also examines how changing input variables affects the system’s performance. Additionally, the study provides a method for determining the optimal size of the heat exchanger based on the available data. The results show that the system is a viable alternative to traditional air conditioning. Simulations indicate that the system can maintain indoor temperatures between 23°C and 26°C even during the hottest summer days. These findings support the development of eco-friendly and energy-efficient cooling solutions, making a significant move toward environmentally responsible living.
An analysis of the air within the enclosed space was conducted to ascertain the temperature reduction after the installation of the distribution system in the room. The outcomes of this analysis are succinctly presented in Table 8.
Table showing the result data of different zones before and after installing the heat exchanger.
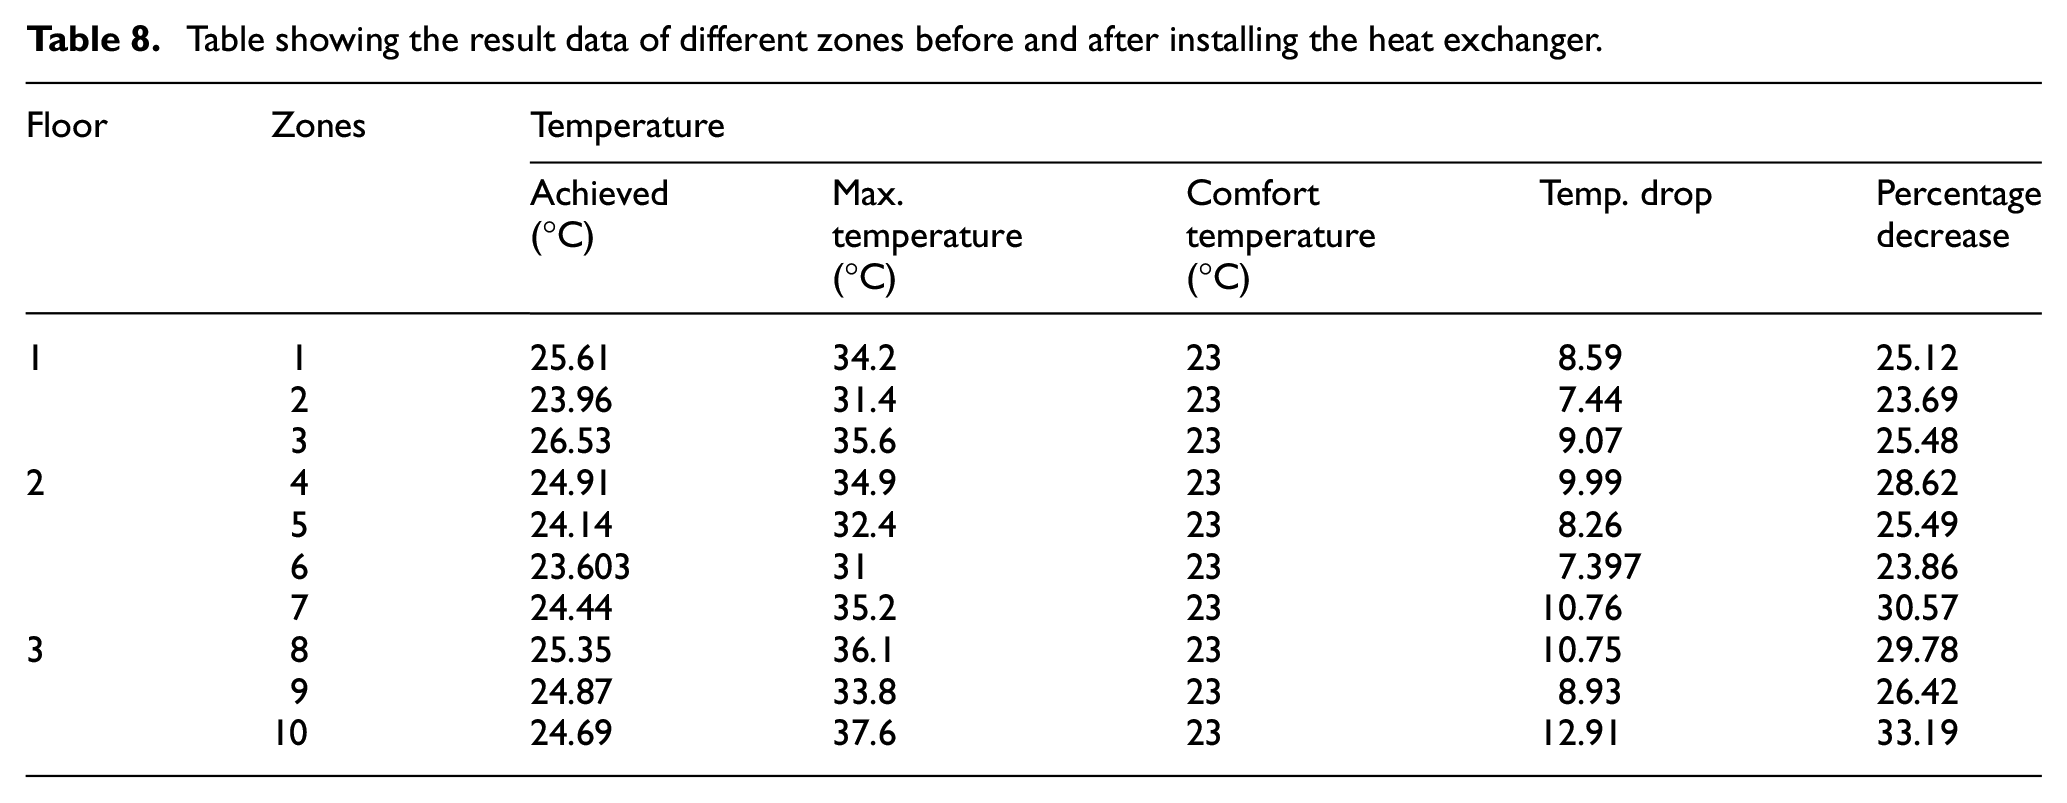
As the grill is situated on the side, the cooling procedure leads to the displacement of warm air by the cooled air. The warmer air moves in an upward direction, starting continuous air circulation within the room. This airflow pattern is graphically illustrated in Figure 10. With the side-mounted grille, the cooling process instigates the movement of cooler air, displacing the warmer air within the room. Warmer air, due to its lower density, naturally rises, creating a continuous convective airflow pattern that furthers air circulation throughout the room. This phenomenon is visually illustrated in Figure 10, illustrating the dynamic air movement within space. The maximum velocity was 3.7m/s at the grill while entering the room. However, the velocity relative to the height of the upper body of a human was 0.56m/s. The velocity contour is illustrated in Figure 11. Similarly, after passing air through the heat exchanger the maximum temperature was 26°C, and the net temperature was maintained at 24.69°C. The temperature contour is shown in Figure 12.

Flow direction of air in Zone 10.

Velocity contour of air inside Zone 10.
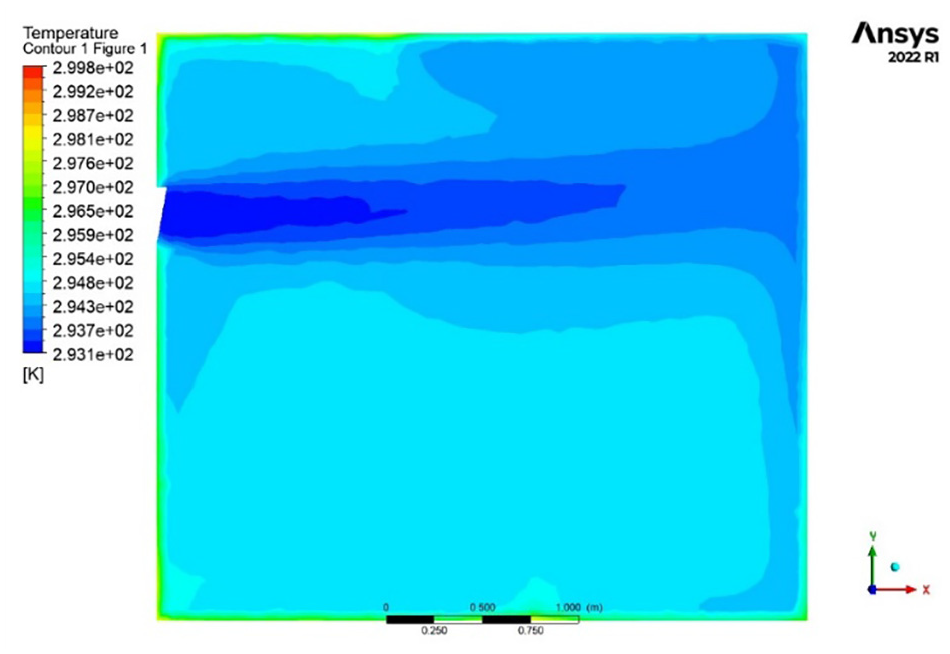
Temperature contour after EAHE inside Zone 10.
System selection
The cooling load calculation was performed using TRNSYS software and verified with the CLTD method, determining a maximum cooling load of about 53kW to maintain the desired thermal conditions in the building. For duct design, many factors were carefully considered, focusing on optimizing material usage.
The design process included selecting different pipe diameters to match various air velocities, resulting in heat exchangers of different sizes. Multiple iterations were performed to find the optimal heat exchanger sizes, using a graph that showed the relationship between pressure drops and total surface area for different diameters. The results from this process are shown in Figure 13. A systematic approach was used to determine the best size for the heat exchanger, with the ideal dimensions chosen based on its overall performance at the optimal size. To achieve this, a series of equations were formulated and solved. The graph denoted as (c) in Figure 13 depicted a specific diameter on the x-axis and velocity on the y-axis. The optimal size was determined through the resolution of the following equations:


(a) Pressure drop versus total surface area at 0.2m diameter, (b) pressure drop versus total surface area at 0.3m diameter, (c) pressure drop versus total surface area at 0.4m diameter, and (d) pressure drop versus total surface area at 0.5m diameter.
Equation (21) defines the total surface area of the pipe, while equation (22) relates to the pressure drop. Solving these equations determined the ideal parameters: a velocity of 4.5m/s, a tube length of 46m, and a total of 12 tubes. The resulting heat dissipation from the room was measured at 53.2kW, exceeding the cooling load during the hottest periods. This result demonstrates the system’s efficiency in meeting peak cooling demands while maintaining a comfortable indoor environment.
Temperature reduction
With an outlet temperature of 20°C achieved at the end of the pipe, the simulation results show a significant temperature reduction. This reduction ensures that the desired thermal comfort level is maintained for the building’s occupants. Figure 14 clearly illustrates this impact, providing strong evidence of the system’s effectiveness in sustaining a comfortable indoor environment. The temperature deviation, calculated as the difference between pre-installation and post-installation temperatures, ranges from 23.69% to 33.19%. This underscores the promising efficiency of the Earth-Air cooling system in the building. Figure 14 graphically depicts these results, highlighting the tangible benefits of this sustainable cooling solution.

Plot showing temperature reduction before and after the use of EAHE in each zone.
Validation
To validate the model, the simulation was done for the June for the climate of the Kathmandu, Nepal. Then the data are compared to the experimental data from Diedrich et al. 33 and Khabbaz et al. 34 which provides the experimental results on the thermal performance of an EAHE-installed house. The result suggests that even if the temperature oscillates between 22°C and 35°C, the ground temperature remains identical, resulting in constant outlet temperature throughout the summer. The simulated heat exchanger is of size 45m in length and buried 4m under the ground. The thermophysical characteristics of PVC pipe, soil, and air are presented in Table 4. As this method is not utilized for real-world applications, most of the data is based on a single room. According the Diedrich et al., the temperature was able to maintain at 24.04°C. Therefore, based on the experimental data, the maximum absolute error between the simulation and the experiment is 2.13°C, which represents the relative error of 8.09%, which is due to the orientation of the rooms. Additionally, Khabbaz et al. data depict that the temperature was able to reduce to 25.1°C. The temperature variation was within 1.4°C and the maximum absolute error was 5.9%. Similarly, Natural Resources, Canada concluded that the relationship between diameter and length of the pipe is inversely proportional which aligns with the finding of this research. Therefore, the model can be used for design purposes. Therefore, based on the comparison with the experimental data, the model is valid.
Discussion
The research on Earth-Air Heat Exchanger (EAHE) systems, as presented in the case study of a community-centric system in Nepal, has provided new insights into the design and optimization of such systems for sustainable cooling. The study’s findings are grounded in the principles of heat transfer, particularly convection, and the unique thermal properties of the soil.
The EAHE system operates on the principle that the temperature of the earth at a certain depth remains relatively constant throughout the year, which is typically cooler than the ambient air temperature during summer and warmer during winter. This temperature stability is exploited by the EAHE system to either cool or warm the air passing through the underground pipes, depending on the season. The primary heat transfer mechanism in an EAHE system is forced convection, where air is mechanically driven through buried pipes, facilitating heat exchange between the air and the surrounding soil. The system’s efficiency is influenced by the Reynolds number, which determines the flow regime within the pipes, and the Nusselt number, which correlates to the convective heat transfer coefficient. The study’s design, which achieved a 33% temperature reduction, indicates that the forced convection process was effectively optimized.
A new finding from this research is the development of an equation applicable to the climatic conditions of Nepal and similar environments worldwide. This equation allows for the optimal sizing of the heat exchanger, considering local soil and atmospheric conditions. The study’s methodology, which includes the use of the Log Mean Temperature Difference (LMTD) technique, and the development of pressure drop-surface area graphs, provides a systematic approach to designing an EAHE system with enhanced performance. The research also revealed that the optimal design for the EAHE system in the Nepalese context involved a tube velocity of 4.5m/s, a tube length of 46m, and a total of 12 tubes. This design not only surpassed the initial temperature reduction target but also demonstrated a large heat dissipation capacity of 53.2kW, exceeding the peak cooling load requirements. The findings from this study have broader implications for sustainable building design and operation. The successful implementation of the EAHE system in a communal setting, such as the ISKCON Brahmachari Ashram, showcases the potential for such systems to provide significant energy savings in the domain Nepal or like Nepal and reduce greenhouse gas emissions associated with conventional cooling methods. Moreover, the study’s approach to EAHE system design and optimization can serve as a model for future research and applications in other regions with similar climatic conditions. The ability to customize the system based on local environmental parameters ensures that the EAHE system can be effectively integrated into a wide range of building projects, promoting the adoption of renewable and sustainable energy solutions.
Conclusion and recommendation
Conclusion
The implementation of the Earth-Air Heat Exchanger (EAHE) system within the community demonstrates a sustainable approach to cooling residential spaces. The system’s ability to handle a substantial cooling load of approximately 53kW, effectively maintaining indoor temperatures even during peak summer conditions, is noteworthy. Although the initial installation cost appears to be relatively high, the system’s low electricity consumption translates into a cost-effective, eco-friendly solution over the long term. The successful optimization of the heat exchanger size, with a velocity of 4.5m/s, a tube length of 46m, and 12 tubes, showcases the system’s efficacy in addressing peak cooling demands. As evidenced by the simulation results, the EAHE system’s ability to sustain a comfortable indoor environment with an outlet temperature of 20°C further underscores its practicality and environmental benefits. The percentage decrease in temperature was 33% with not less than 23%.
Recommendation
Earth-air cooling systems are a sustainable and energy-efficient technology for cooling buildings. Much research has been done on this system. But still, there is a lot of room for optimization in terms of space and materials required for installing EAHE. The maintenance and repair procedures are not accessible as it stays under the surface of the earth. So, future work can focus on the following recommendations:
Optimization of heat exchanger to reduce the size and material required for EAHE with improving performance.
Future researchers can research results obtained by integrating with other cooling systems such as mechanical air conditioning. They can develop an integrated system that combines both EAHEs with other technologies to optimize energy efficiency and reduce environmental impact.
Establishing monitoring systems and maintenance are critical for ensuring the long-term effectiveness of the system. Future work could focus on developing these systems and guidelines for the long-term continuity of the system.
As temperatures of the earth at a certain depth are relatively stable throughout the year, further research can be carried out to determine the effectiveness of designing and using this system for heating purposes.
Overall, it has immense potential as a sustainable cooling technology, and continued research and development are required to optimize its effectiveness and increase adaptation in buildings for cooling.
Footnotes
Appendix
The various areas of the rooms, along with their doors and windows sizes are calculated and represented in Table below.
Appendix 2
Acknowledgements
We would like to thank Project 22-05 Laboratory, Kathmandu University for providing us with this opportunity to work on this project. Also, authors want to show gratitude toward Mr. Nirajan Timilsina for his academic support.
Handling Editor: Sharmili Pandian
Declaration of conflicting interests
The author declared no potential conflicts of interest with respect to the research, authorship, and/or publication of this article.
Funding
The author received no financial support for the research, authorship, and/or publication of this article.
Data availability
Data will be available on request.