
Abstract
The vehicle acceleration process is often accompanied by torsional vibration of the powertrain system. Poor torsional vibration performance significantly influences the driving comfort of the vehicle and the reliability of powertrain components. Compared to passenger cars, commercial vehicles, especially the heavy-duty truck, exhibit more complicated vibration behaviors during acceleration due to the multiple power branches, various gears, and different working conditions. This article presents systematic research on the modeling method, vibration characteristics, mechanism, and influence factors of the torsional resonance of the heavy-duty vehicle during acceleration. A 16-DOF powertrain model considering multiple nonlinearities of the system is proposed and experimentally validated reliable. Numerical and experimental studies are carried out to investigate the vibration characteristics and mechanism of the heavy-duty vehicle powertrain, and the modal energies and parameter influences are also discussed. Besides, an optimization example is presented to analyze the potential vibration attenuation performance of optimizing the clutch parameters. The results indicate that the overall powertrain mode of the heavy-duty vehicle tends to be aroused by the engine firing frequency during accelerating, inducing violent speed fluctuations of the powertrain components between the clutch and half-shafts. The clutch parameters have significant impacts on the powertrain resonance, and the vibration amplitude of the powertrain system can be effectively attenuated to acceptable levels by optimally designing the clutch parameters.
Introduction
The torsional vibration of the powertrain system significantly influences the fatigue life of rotary components and the noise, vibration, and harshness (NVH) performance of the vehicle.1–4 Even though the torsional damper is integrated in the clutch, 5 the torsional vibration problems of the powertrain system, such as the driveline shuffle,6–8 clutch judder,9–12 gear rattle,13,14 and powertrain torsional resonance,15,16 are still encountered under the excitation of the fluctuating torque of the engine. Among the vibration problems above, the powertrain torsional resonance is one of the most harmful, because it not only induces the abnormal vibration and booming noise in the cabin, but also accelerates the fatigue damage of driveline components. 16 Hence, it is of great importance to analyze the characteristics and mechanism of the powertrain torsional resonance and investigate the influence factors for vibration control.
In the existing published works, many scholars have proposed numerical models to study the torsional vibration of the powertrain. Idehara et al. 15 established a 3-DOF nonlinear driveline model of a passenger car to analyze the torsional resonance during the vehicle accelerates, and investigated the effect of the friction damping of the clutch damper on the vibration amplitude. Wang et al. 16 analyzed the torsional resonance of the drivetrain and optimally designed the multistage stiffness of the torsional damper to attenuate the torsional vibration. Crowther and Zhang 17 presented to establish the nonlinear powertrain model with the torsional finite elements including the direct, branched, grounded, and geared connections, and analyzed the powertrain torsional dynamics. Liu et al. 18 studied the vibration isolation performance of the clutch damper in the drivetrain and adopted the sequential quadratic programming method to optimize the clutch parameters for vibration control. Li and Singh 19 considered the piecewise-linearities of the clutch damper in the powertrain model to analyze the transient vibration during the vehicle starts up by the harmonic balance method. Porto and Idehara 20 presented a nonlinear drivetrain model to research the damping performance of a novel clutch damper with cubic stiffness and preload. Zhang et al. 21 established a 10-DOF nonlinear powertrain model considering the excitations of the combustion engine and the generators, and adopted the multi-scale method to study the torsional vibration under the driving conditions. Kim and Shin 22 implemented bench tests with the low-inertia dynamometer incorporating state-of-the-art torque-sensing technology to investigate the torque transmissibility of the torsional vibration isolator in the drivetrain.
However, the previous studies mostly researched the torsional vibration of passenger cars, but few focused on the heavy-duty truck powertrain system. Differentiated from the passenger car, the powertrain of the heavy-duty vehicle has a more complex powertrain structure with multiple transmission branches and works in various loading conditions and different gears, for which the vibration characteristics and dynamic behaviors are more complicated. Besides, the powertrain model of the heavy-duty vehicle that considers multiple nonlinearities of the system, especially the one fully considering the nonlinearities of clutch including the stick-slip friction, piecewise-linearities and spacer pin effects, was also rarely proposed in previous studies.
The chief objectives of this study concentrate on the nonlinear modeling and analyzing the mechanism and influence factors of the torsional resonance of heavy-duty vehicle powertrain during accelerating. The paper is organized as follows: In Section “Nonlinear modeling of heavy-duty vehicle powertrain system,” the typical structure of the heavy-duty vehicle is introduced, and a 16-DOF nonlinear torsional vibration model is proposed. In Section “Numerical simulation and analysis,” detailed numerical simulations are implemented to research the characteristics and mechanism of the torsional resonance. Section “Experimental study” carries out vehicle experiments to validate the proposed model and research the torsional vibration behaviors of the powertrain under different working conditions. In Section “Influence of powertrain parameters on torsional vibration,” the influence factors of the powertrain torsional resonance are investigated. Finally, an optimization example of clutch parameters for powertrain resonance attenuation is presented in Section “Optimization example of powertrain torsional resonance.”
Nonlinear modeling of heavy-duty vehicle powertrain system
Structure of heavy-duty vehicle powertrain
The automotive powertrain system is composed of the engine, flywheel, clutch, gearbox, driveshaft, driving axle, half-shafts, and driving wheels. 23 The typical structure of the powertrain system of a 6 × 4 heavy-duty truck with a 6-cylinder-4-stroke engine and a 16-speed transmission is illustrated in Figure 1. Different from passenger cars or light trucks, the heavy-duty powertrain has two transaxles distributed in the middle and rear of the chassis, respectively. The transfer unit is installed in front of the middle-axle to distribute the engine power. Hence, the powertrain of the heavy-duty truck has two powerlines, namely the engine-gearbox-transfer unit-middle axle powerline and the engine-gearbox-transfer unit-rear axle powerline.

Typical structure of heavy-duty truck powertrain system (1: engine, 2: flywheel, 3: clutch, 4: gearbox, 5: front driveshaft, 6: transfer unit, 7: middle-axle, 8: rear driveshaft, 9: rear-axle, 10: driving wheel).
Nonlinear powertrain model
According to the structural features of the heavy-duty vehicle powertrain system, a 16-DOF nonlinear model considering the important nonlinear characteristics of the system is presented, as shown in Figure 2.

16-DOF nonlinear powertrain model of heavy-duty vehicle.
The components with considerable masses, such as the engine, the flywheel, and so on, are regarded as rotating rigid bodies with equivalent inertias, and the connecting shafts in the drivetrain are considered as massless springs and dampers, whose inertias are divided equally and added to the inertial elements on both sides. For simplification, the gear-shaft system of the gearbox is divided into the driving and driven parts with equivalent inertias that are calculated based on the actual inertias and ratios of each gear pair in the gearbox. Besides, the transfer unit is also considered as the driving and driven rotors with geared connection. According to the D’Alembert principle, the motion equations of the 16-DOF nonlinear model are given in the matrix form as follows:

where


where
Transient model of engine excitation
As the power source of the drivetrain, the engine excitation consists of the gas torque


where

where

where

Transient model of engine: (a) illustration of force and motion for the piston-crank-link mechanism and (b) cylinder pressure versus crankshaft speed and angle.
According to the kinematic relationships of the piston-crank-link mechanism, the forces


As for the friction inside and outside the cylinder, the Rezeka–Henein 25 method is adopted in the model, given as:

where


where

Nonlinear clutch model
Stick-slip friction
When the clutch is engaged, the friction discs of the clutch are pressed onto the flywheel by the pressure plate to transmit the engine torque. In previous studies on powertrain torsional resonance, the clutch driving and driven parts are usually considered as hard connections to simplify the model. In fact, the clutch frequently switches between the static and sliding states due to the oscillating transmitting torque. The powertrain vibrating energy is partially dissipated by the sliding friction, especially when the transmitting torque of clutch violently oscillates at resonance. Hence, this paper adopts the Karnopp 5 friction model to describe the stick-slip state of the clutch, which is expressed as:
where


where


Multistage clutch damper
The torsional damper is integrated in the driven disc of the clutch, which is usually designed to be multi-staged for isolating torsional vibration under various conditions.26–28 Previous studies mostly focused on the modeling of piecewise-linear spring stiffness of the clutch damper, but often overlooked the locking effect of the spacer pin, which may yield incorrect results when investigating the parametric influences. The explanation is that there is the possibility the fluctuated twist angle of the clutch exceeds the final end-stop angle when a low stiffness clutch is adopted or the angular range of the main-stage is relatively small. In this situation, the spacer pin will prevent the clutch springs from further deformation instead of allowing the endless amplification of the twist angle. Hence, this article regards the influence of the spacer pin as another (final) stage of the clutch damper with a considerable stiffness of the gearbox input shaft, as illustrated in Figure 4.

Torque versus relative angular displacement of a two-stage clutch damper considering spacer pin effect.
Moreover, in order to attenuate the instability of the numerical simulation induced by the piecewise-type discontinuities, the hyperbolic tangent smoothing function is also introduced in the model. Then, the nonlinear transmitting torque of the clutch damper


where


where
Gear pair contact model considering oil squeeze effect
In the powertrain of the heavy-duty truck, gear pairs are widely utilized in the gearbox to form ratios, and in the transfer unit to distribute the driving power to different transaxles. As shown in Figure 5(a), gear meshing is a nonstationary process, which introduces the periodic and impact excitation to the driveline due to the time-varying meshing stiffness and the gear backlash.29–32 Taking the oil squeeze effect into consideration, the dynamic meshing force of the gear pair can be expressed as:

where

where


where

Model of gear pair contact: (a) illustration of gear meshing and (b) time-varying meshing stiffness of gear pair.
In equation (30), the item


where

where
Cardan joint model
The cardan joints introduce second order oscillation of the driveshaft rotating frequency into the powertrain. 33 According to the velocity relationship between the driving and driven sides of the cardan joint, there exist the following formulas:


where

where

where
Tire slip model
Considering the effects of tire slipping, the fixed relaxion length tire model
34
is adopted to describe the transient traction torque


where
Resistance torque
The resistance torque


where
Numerical simulation and analysis
Based on the proposed 16-DOF nonlinear powertrain model, a simulation program is developed in Matlab/Simulink and solved by the fourth order Runge-Kutta method. The parameters of the dynamic model are listed in the Appendix 1, which are derived by actual measurements or simulations. For convenience of explanation, the following simulation and analyses focus on the 10th gear accelerating condition with full load because the 10th gear is frequently used for acceleration and full load is a typical working state for the heavy-duty truck.
Torsional resonance of powertrain system
Initialized from the creep speed (around 650 rpm for the engine), the numerical model is imported a limited ramp signal with the unit slope to simulate the throttle opening. The throttle maintains the WOT (wide open throttle) condition after reaching the maximum opening at 1.5 s. The time-domain histories of the powertrain speed are recorded until the engine reaches the maximum speed (2000 rpm). The engine output torque is shown in Figure 6, and the time-domain simulation results of the powertrain system are illustrated in Figure 7.

Engine transient excitation torque.
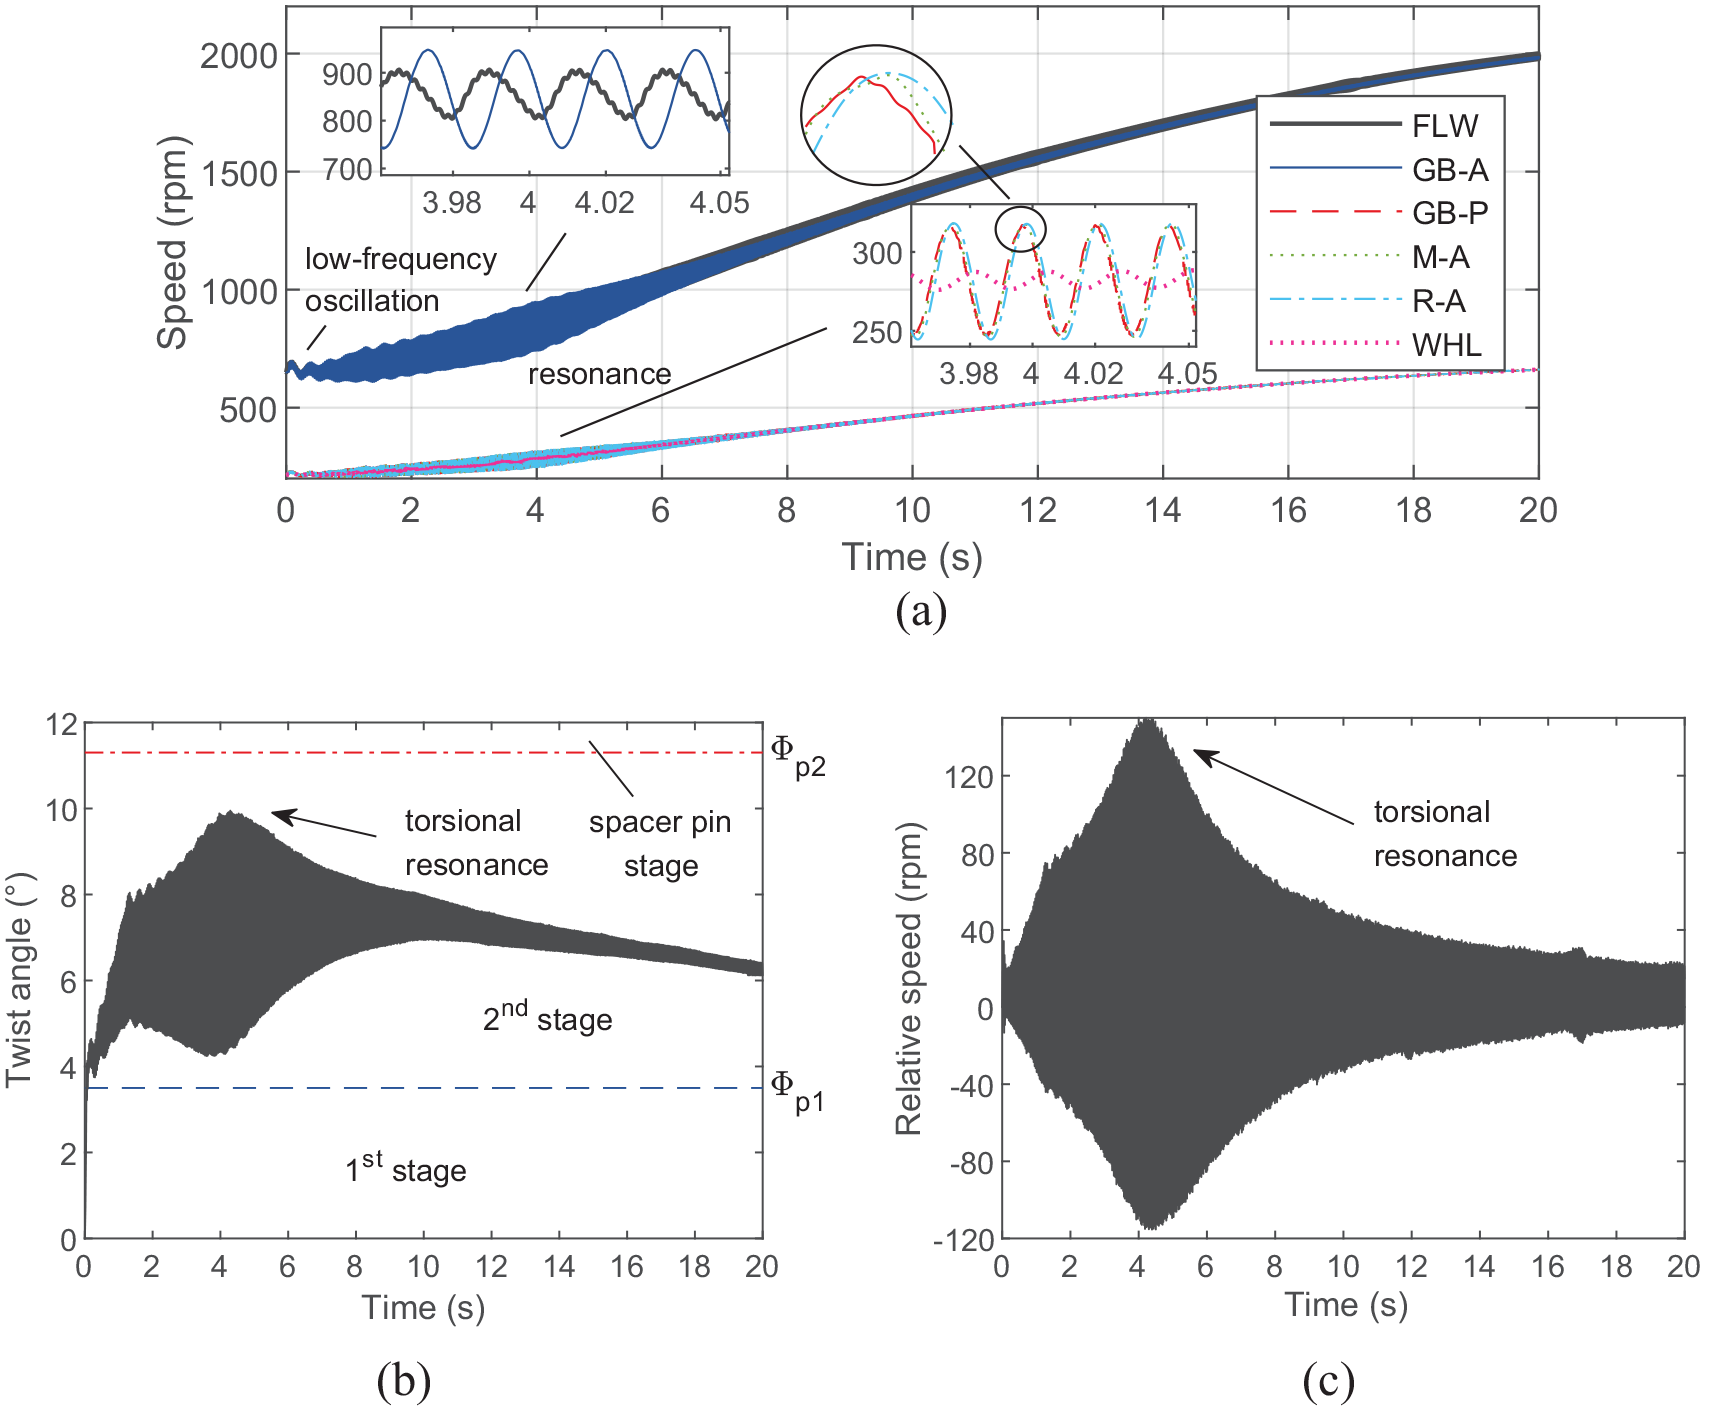
Time-domain simulation results under 10th gear full-load WOT condition: (a) angular velocities of drivetrain components, (b) twist angle of clutch damper, and (c) relative speed fluctuation through the clutch damper.
At the beginning of acceleration shown in Figure 7(a), the powertrain exhibits shuffle type oscillation, which is a kind of low-frequency oscillation of the overall driveline. At around 4 s (about 850 rpm), significant fluctuations appear at the gearbox, middle-axle, and rear-axle, but the torsional vibration of the flywheel and wheels are not amplified. The violently vibrating components are between the clutch damper and the half-shafts, which indicates this part of powertrain system is undergoing torsional resonance. This can be also observed in Figure 7(b) and (c) where the twist angle and the relative speed fluctuation of the clutch damper reach the peak amplitude at about 4 s and gradually weaken after 6 s. On the other hand, the gear meshing introduces high-frequency vibration into the gearbox and the transfer unit, as shown in the enlarged area of Figure 7(a). However, the second-order vibration introduced by cardan joints is unobvious due to the small intersection angle.
By means of the short time Fourier Transform, the colormaps of the resonant powertrain components are illustrated in Figure 8. The 3.3 Hz band and the 42.5 Hz band are two bright vertical bands in the colormaps, which correspond to the shuffle oscillation and powertrain torsional resonance appearing during the accelerating process, respectively. Compared to the gradually decaying shuffle oscillation, the powertrain resonance is much severer and exhibits greater amplitude at the intersection of the third order diagonal and the 42.5 Hz band. Besides, no obvious vibration peaks are observed on the sixth or higher order lines of the colormaps.

Simulation colormaps of resonant components: (a) gearbox driving part, (b) gearbox driven part, (c) middle-axle, and (d) rear-axle.
To study the resonant frequency and amplitude of the powertrain system, the third order torsional vibrations of the resonant components are extracted from the colormaps. As shown in Figure 9, the critical speed of the powertrain resonance is 850 rpm, and for frequency is 42.5 Hz (three times the engine rotating frequency 14.2 Hz). Although the components between the clutch damper and the half-shafts simultaneously vibrate, the driving part of the gearbox has the maximal vibration amplitude (71.9 rpm), about three times those of the gearbox driven part (24.1 rpm), the middle-axle (25.0 rpm) or the rear-axle (25.9 rpm) owing to the gear ratio of the gearbox (gear ratio is 3 at the 10th gear).

Smulation third order torsional vibration of resonant components.
Mechanism of powertrain torsional resonance
In order to investigate the mechanism of the powertrain torsional resonance, the modal analysis is implemented by a 15-DOF linearized powertrain model with the clutch in stick state (

Modal characteristics of powertrain system: (a) amplitude-frequency response and (b) modal shapes.
Apart from the rigid mode, the drivetrain exhibits another 14 torsional modes. The second mode exhibits the reverse vibration between the overall drivetrain and the vehicle body, which is the typical shuffle mode, corresponding to the low-frequency oscillation shown in Figure 7(a). As for the seventh mode, the inertias between the clutch damper and the half-shafts exhibit high amplitudes with the gearbox driving part the maximum. This modal shape and frequency are exactly consistent with the torsional resonance of powertrain shown in the time-domain simulation. The remaining modes can be divided into four clusters, the wheel mode (3rd–6th order), the gearbox and middle-axle mode (9th, 10th, 12th, and 15th order), the rear-axle mode (8th and 13th order) and the engine mode (11th and 14th order), which are not evidently behaved in the simulation and will not be elaborated here.
From the modal analysis above, the aroused drivetrain vibration is mainly related to the second and seventh modes. To better explain the mechanism of the powertrain torsional resonance, the Campbell map is illustrated in Figure 11 where the main orders (third, sixth, and ninth order) of the six-cylinder-four-stroke engine excitation, the cardan joint order, and the meshing order of gearbox and transfer unit are represented by solid curves, and the inherent frequencies are represented by the horizontal lines.

Campbell map of excitation orders and powertrain inherent frequencies.
The exciting orders sweep the whole powertrain during vehicle accelerating, and the system faces risks of resonance once the exciting frequency of some order coincides with the inherent frequencies. Hence, it can be seen from Figure 11 that the third order engine excitation sweeps past the seventh order powertrain mode during accelerating, inducing the modal resonance as shown in the time-domain results. In reality, the accelerating resonance of the powertrain system is common in the heavy-duty vehicles because the powertrain parameters always tend to be the same order of magnitude and the resonant frequency is usually within sweeping range of the engine firing frequency.
However, although the 8th–12th inherent frequencies are also respectively swept by the engine sixth and ninth orders, the meshing orders, and the U-joint order, there is no obvious vibration amplified at these critical speeds. The reason is that the exciting orders except the engine third order are relatively weak, coupled with the system damping effect, so the resonance is not obviously aroused. On the other hand, the drivetrain shuffle is still motivated at the beginning of acceleration even though beyond the frequency band of any exciting order, which is because the shuffle mode is particularly sensitive to the abruptly changed engine excitation for its very low oscillation frequency.
Experimental study
Vehicle experiment setup
In order to validate the proposed powertrain model, an experiment is designed and implemented to measure the torsional vibration of the studied heavy-duty vehicle powertrain. The layout of the sensors and equipment are illustrated in Figure 12.

Layout of sensors and equipment in the vehicle experiment.
Five magnetic sensors are utilized to measure the angular velocities of the drivetrain components including the flywheel, the gearbox input shaft, the gearbox output shaft, the middle-axle input shaft, and the rear-axle input shaft. Considering the different working conditions of the heavy-duty truck, four accelerating conditions are measured in the test, namely the full-load WOT, the full-load POT (partial open throttle, about half open throttle), the unloaded WOT, and the unloaded POT conditions. The unloaded weight of the tested vehicle is 9 t, and the full-load weight is about 49 t. The statistics are acquired by the LMS SCADAS system, and the sampling frequency is 51,200 Hz. Acquired data are processed in the Testlab-19 software.
Experimental results and model validation
Firstly, focused on the full-load WOT condition, the measured results of the powertrain system are shown in Figure 13. Speed fluctuations at all measured points except the flywheel are evidently magnified between 2 and 4 s. According to the colormaps illustrated in Figure 14, the peak vibration amplitude of the powertrain locates at 40 Hz (800 rpm) on the third order diagonal, same as the simulation results.
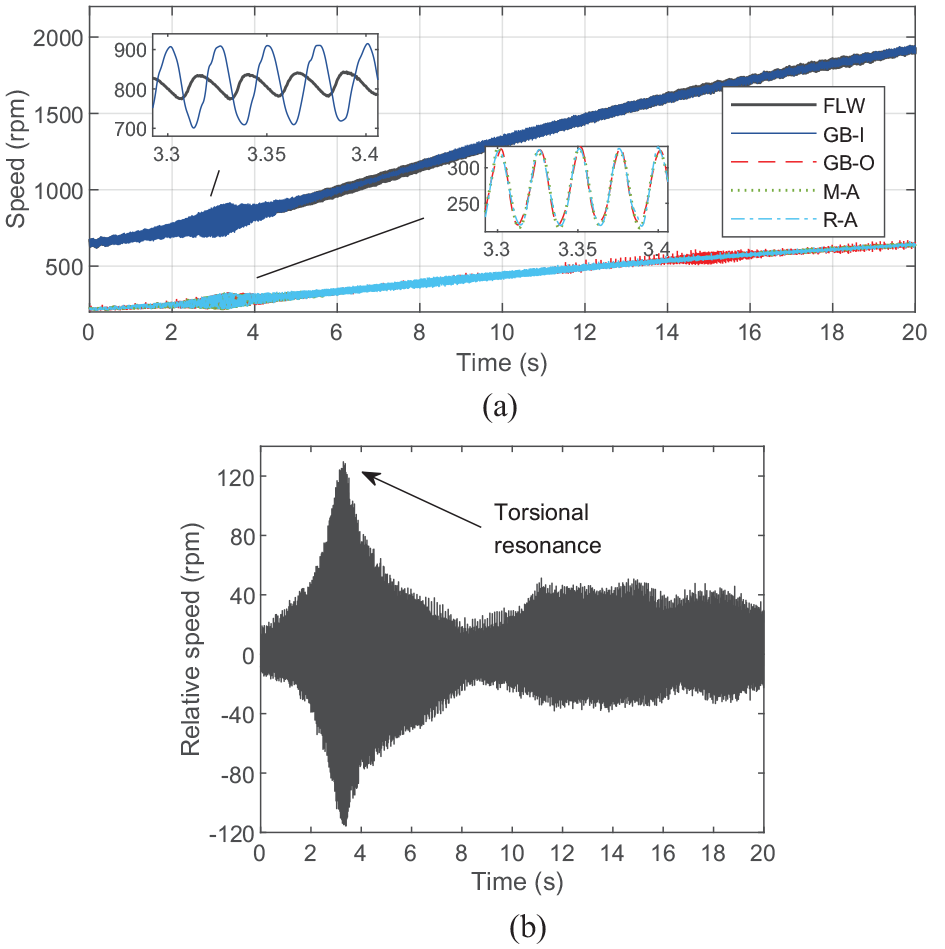
Time-domain experimental results under 10th gear full-load WOT condition: (a) angular velocities of drivetrain components and (b) relative speed fluctuation through the clutch damper.
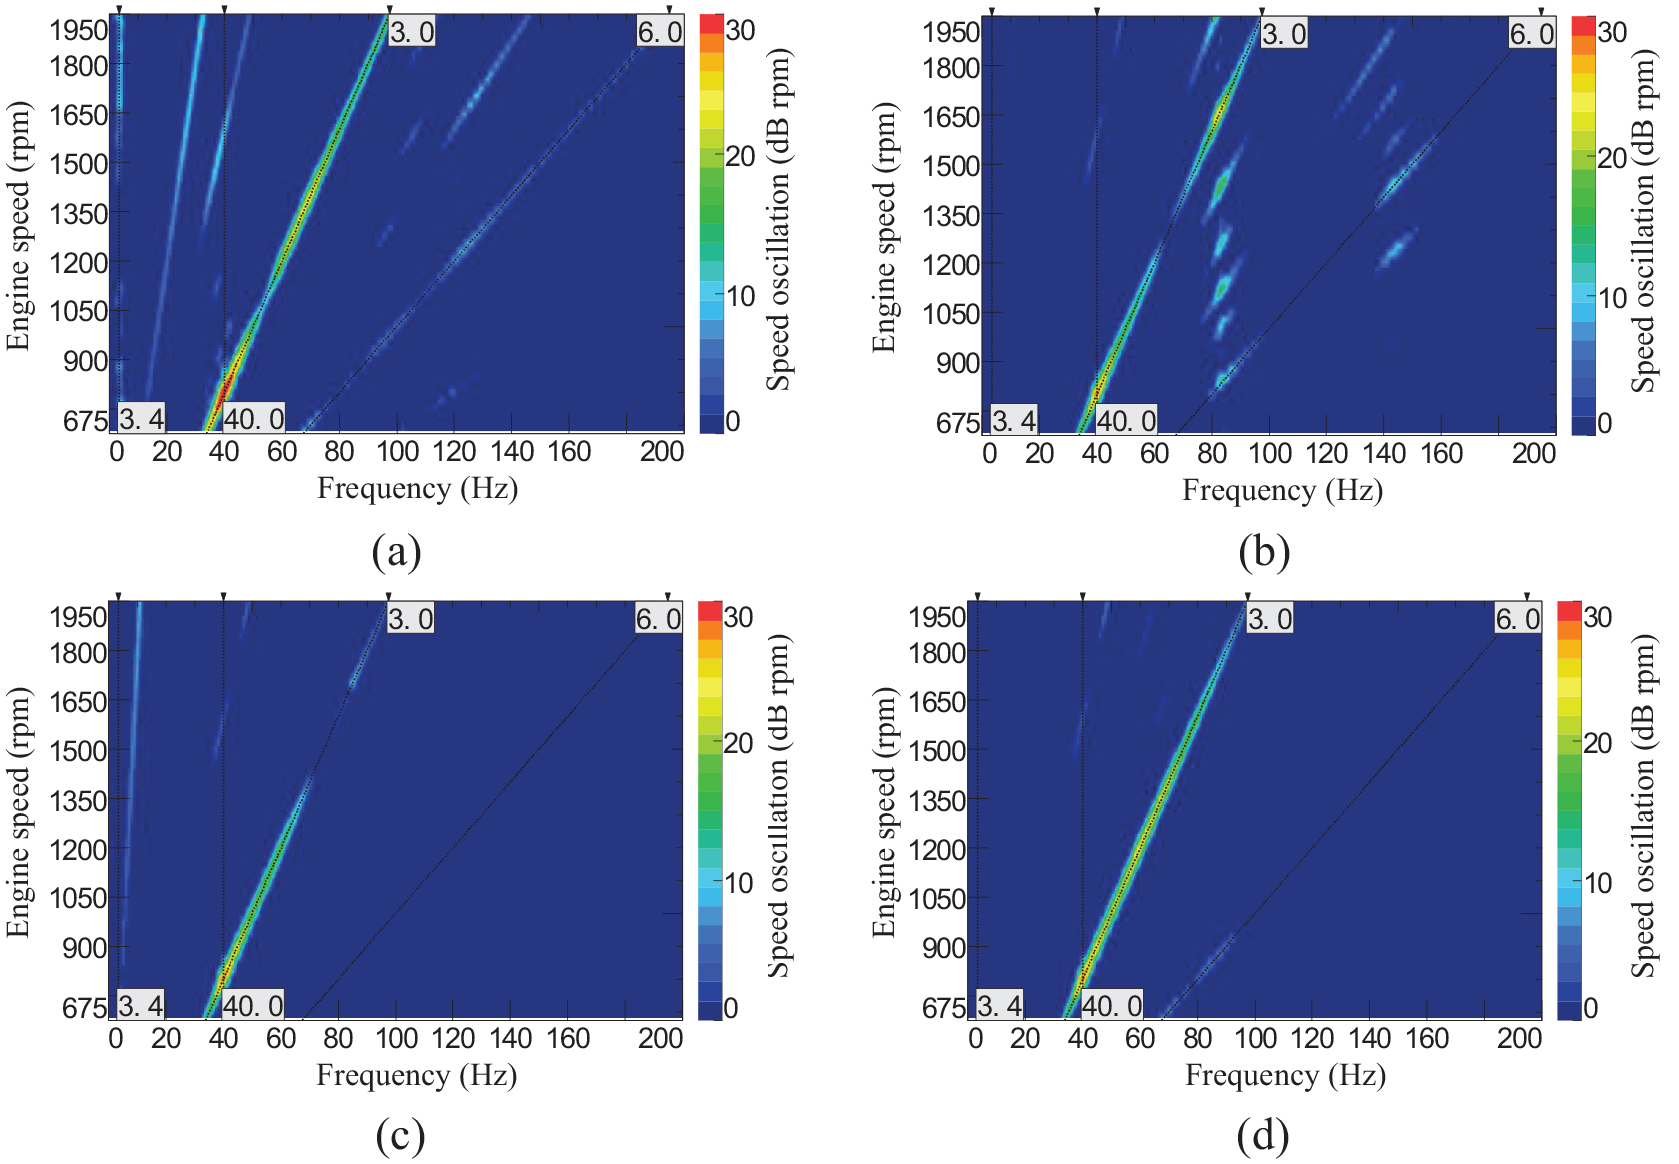
Experimental colormaps of resonant components: (a) gearbox input shaft, (b) gearbox output shaft, (c) middle-axle input shaft, and (d) rear-axle input shaft.
Figure 15 shows the third torsional vibration of the powertrain. It can be seen the vibration amplitudes of GB-O, M-A, and R-A are much smaller than that of GB-I due to the gear ratio, as predicted in Section “Numerical simulation and analysis.” The maximal amplitude of GB-I is 69.3 rpm at 800 rpm (40 Hz). The deviations between the calculated and experimental results are +6.25% for the inherent frequency, and +3.75% for the vibration amplitude, which shows good agreements. On the other hand, the shuffle mode is also observed at the beginning of acceleration shown in Figure 14(a) with the oscillation frequency of 3.4 Hz, close to the calculated second mode (3.3 Hz).

Experimental third torsional vibration of resonant components.
However, some partial vibration peaks and orders exhibited in the experimental results are not predicted by the simulation results, which is because the DOFs of the proposed model are limited so that some partial dynamic characteristics of the powertrain system are not included. Nevertheless, the above experimental results still validate the proposed 16DOF nonlinear model able to capture the principal characteristics of the torsional resonance of the heavy-duty vehicle and be reliable for further investigations.
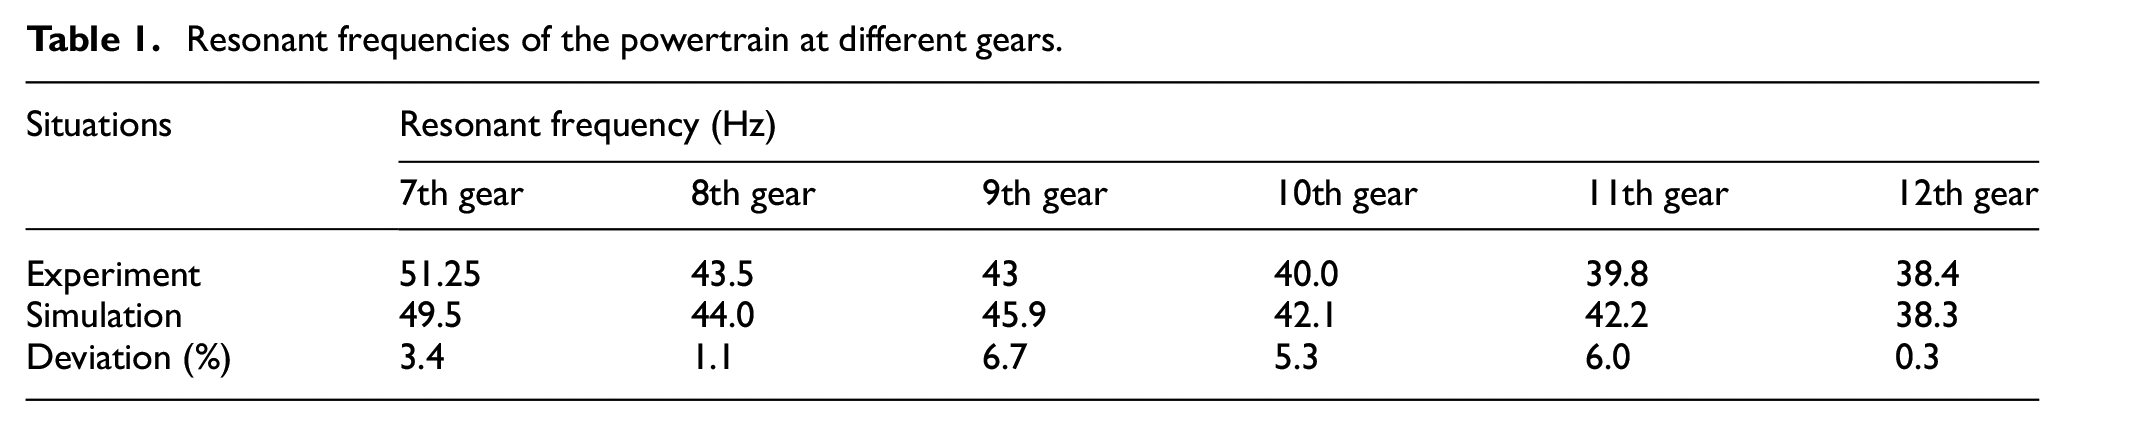
At the other gears, the powertrain torsional resonance is also encountered in the experiment, and their resonant frequencies are listed in Table 1. It is observed that the resonant frequency changes with gears or ratios, exhibiting a decreasing tendency with higher gears engaged. The maximum frequency error in Table 1 is less than 8%, which also verifies the proposed model.
Resonant frequencies of the powertrain at different gears.
In addition, the torsional vibration performances of the powertrain system under different working conditions are studied by experiments, as shown in Figure 16. It can be observed that FL-WOT condition has the maximal vibration amplitude at resonance, then followed by FL-POT and UL-WOT conditions, and the minimal vibration is found under UL-POT condition. The heavy-duty vehicle powertrain tends to exhibit severer torsional vibration when heavier-loaded or applied wider opening throttle. Compared with the unloaded conditions, the heavy-duty vehicle has longer acceleration time under the full-load condition, and the torsional resonance sustains longer, for which the resonance fully develops and accumulates more vibrational energy needing dissipated. On the other hand, the fluctuating torque of the engine excitation increases with the increment of the throttle opening, which accounts for greater vibration responses of the powertrain under WOT conditions. Consequently, the torsional resonance of the powertrain under the full-load WOT condition should be especially concerned and studied.

Measured third order torsional vibration at gearbox input-shaft under different working conditions.
Influence of powertrain parameters on torsional vibration
According to Section “Experimental study,” the most serious torsional resonance of the powertrain occurs under the full-load WOT condition. Therefore, this section focuses on the full-load WOT condition to investigate the influence factors of the powertrain resonance.
Modal energy analysis
The energy analysis is implemented in order to research the influence of powertrain parameters on the modal characteristics of the system. Since the powertrain components’ inertias are generally immutable, the analysis concentrates on the potential energies of stiffness elements. The contribution of the

where
Based on the 15-DOF linearized powertrain model, the energy contributions of the 17 springs to the 14 vibrational modes are calculated, as shown in Figure 17. As evidenced, the powertrain modes can be divided into four clusters (A, B, C, and D) with the shuffle (second) and the resonance (seventh) modes individually left. It can be observed the springs at the modal nodes usually contributes the most modal potential energy. Cluster A includes the four driving wheel modes, and the modal energies are mainly dominated by the corresponding tire stiffness (k t 10, k t 11, k t 14, k t 15) and are also lightly influenced by the corresponding half-shafts (k10, k11, k14, k15). Cluster B is characterized by the rear-axle vibration, and most of the modal energy is stored in the thru-shaft (k8) and the rear driveshaft (k9). Cluster C is about the gearbox and middle-axle vibration, and the torsional stiffness k p , k g 1, k13, k g 2 dominate the energies of the four powertrain modes, respectively. Noteworthily, the coupling effects are quite evident in Cluster C, for which more attention should be paid to the coupling influence during the dynamical modifications to these powertrain modes by adjusting the torsional stiffness. Cluster D is characterized by the engine vibration, and the modal energies are mainly stored in the crankshaft (k2, k3).

Modal energy contribution analysis.
On the other hand, the shuffle mode is mainly dominated by the half-shafts. As for the resonant mode of the powertrain (seventh mode), the clutch damper contributes more than 88% potential energy while the contributions of the half-shafts are relatively slight, which indicates the powertrain torsional resonance is most sensitive to the clutch damper stiffness. In addition, the clutch damper stiffness stores little potential energies in the other powertrain modes, as shown in the “s” column data, so the coupling effect is less evident between the resonance mode and the other modes. Therefore, the powertrain resonance mode can be safely modified by adjusting the clutch damper stiffness without affecting other modes, which is beneficial to the avoidance and suppression of the powertrain resonance.
Parametric effects on powertrain torsional resonance
According to the energy analysis, both the clutch damper and the half-shafts influence the powertrain resonance. Based on the proposed 16-DOF nonlinear model, the effects of the clutch and half-shaft parameters on the powertrain resonance are quantitatively analyzed in this section. The third order torsional vibration of the gearbox driving part (the resolution is 5 rpm or 0.25 Hz) is taken as a measurement of the resonant amplitude and frequency.
Figure 18 illustrates the effect of the main-stage stiffness of the clutch damper
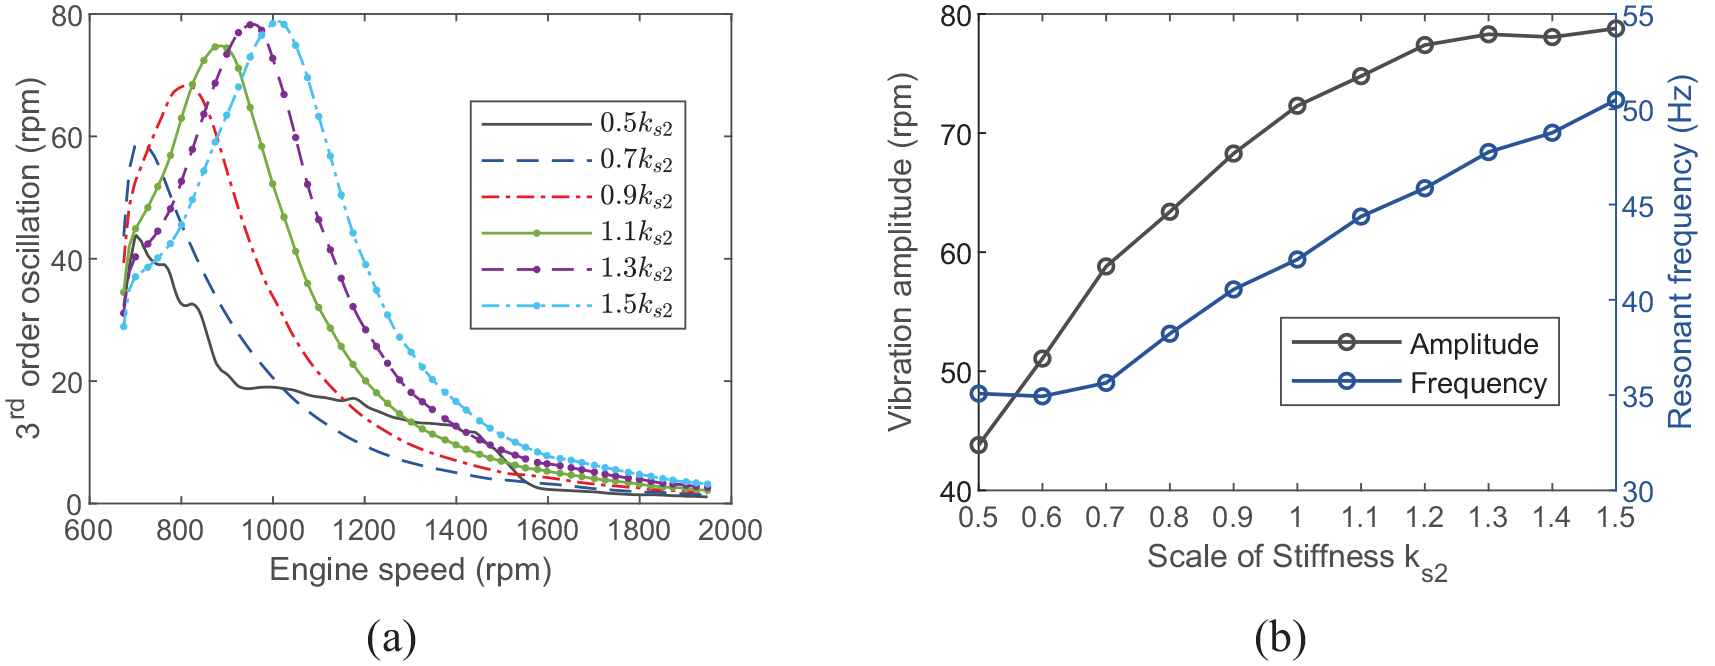
Effect of
The effect of clutch damper main-stage hysteresis

Effect of
Figure 20 shows the effect of the positive transition angle of the clutch damper

Effect of
The variation of the resonant amplitude and frequency of the powertrain system with different

Effect of
Figure 22 illustrates the effect of middle half-shaft stiffness on the torsional vibration of the powertrain system. With the increase of middle half-shaft stiffness, the vibration amplitude of the powertrain system is slightly reduced while the resonant frequency is slightly increased. However, increasing the rear half-shaft stiffness increases both the inherent frequency and the vibration amplitude of the powertrain system, as shown in Figure 23. It can be found the effects of the rear and middle half-shaft stiffness are contrary on the vibration amplitude, but identical on the resonant frequency.

Effect of middle half-shaft stiffness (

Effect of rear half-shaft stiffness (
When simultaneously increasing the middle and rear half-shaft stiffness, the resonant amplitude exhibits an upward tendency despite the contrary effects of rear and middle half-shaft stiffness, as shown in Figure 24. On the other hand, the resonant frequency is also increased with the increasing total half-shaft stiffness, and the variation range is broader, compared with individually changing the middle or rear half-shaft stiffness. In conclusion, directionally changing the half-shaft stiffness can slightly attenuate the torsional resonance of the heavy-duty powertrain, but the effect is very limited.

Effect of total half-shaft stiffness (
Optimization example of powertrain torsional resonance
From the above analysis, it can be concluded that revising the clutch parameters significantly influences the powertrain resonance behaviors. To evaluate the actual attenuation effect, an optimization example is presented in this section. The objective is to minimize the powertrain torsional vibration at resonance, and the optimized variables are clutch damper stiffness

where
The codes of three optimization algorithms, including the Simulated Annealing (SA), the Genetic Algorithm (GA) and the Particle Swarm Optimization (PSO), are developed in MATLAB to find the optimal solution. The population of GA and PSO is 30, the initial point of SA and PSO is the original values of the clutch parameters. The convergence curve is shown in Figure 25(a), and the optimal clutch parameters are listed in Table 2.

Optimization results: (a) convergence curves, (b) amplitude-frequency response, (c) relative speed through clutch, and (d) third torsional vibration.
Optimized parameters.

It can be seen PSO algorithm has the fastest convergence rate and obtains the best solution, hence the results yielded by PSO is adopted as the optimal parameters of the clutch. The powertrain torsional vibration after optimization is illustrated in Figure 25(b) to (d). With the revised clutch, the seventh inherent frequency of the powertrain system decreases from 42.1 to 38.13 Hz whilst the other inherent frequencies have little variance. The third order peak amplitude at gearbox driving part decreases 53.3% (from 71.9 to 33.6 rpm), and the RMS speed fluctuation through the clutch damper decreases 34.8% (from 42.32 to 27.61 rpm). The results indicate that the torsional resonance of the heavy-duty vehicle powertrain system can be effectively attenuated by optimizing the clutch damper stiffness and hysteresis.
Conclusions
Based on the proposed 16-DOF nonlinear model, this paper carries out numerical and experimental studies to analyze the characteristics, mechanism, and influence factors of the powertrain torsional vibration of heavy-duty vehicle. The following conclusions can be drawn:
(1) Fully considering the clutch nonlinearities is necessary for analyzing the powertrain resonance. By considering the important nonlinear factors of the powertrain system, the established 16-DOF dynamic model can capture the principal resonant characteristics of the powertrain system of heavy-duty vehicle, which is validated by the vehicle experiments.
(2) The firing frequency of the engine contains the most exciting energy and always arouses the overall torsional resonance of the heavy-duty vehicle powertrain during acceleration. The torsional resonance exhibits violent speed fluctuations of the drivetrain components between the clutch damper and half-shafts, and the maximal amplitude usually appears at the gearbox input part under the WOT full-load condition for the heavy-duty vehicle.
(3) The clutch parameters perform significant influences on the amplitude and frequency of the powertrain torsional resonance whilst the effects of the half-shafts are very limited. The decrease of the clutch main-stage stiffness evidently reduces the resonant frequency and amplitude, and increasing the clutch main-stage hysteresis can greatly suppress the resonant amplitude with the inherent frequency hardly changed. Smaller extreme friction of the clutch can aggravate the clutch sliding and attenuate the vibration at resonance, and inadequate angular range of main-stage can introduce shocks into the powertrain system. By optimally designing the clutch parameters, the torsional resonance of the heavy-duty vehicle powertrain system can be effectively attenuated.
Footnotes
Appendix 1
Variables and values in the model.

| Parameter | Value | Parameter | Value | Parameter | Value |
|---|---|---|---|---|---|
| (kg m 2 ) | 0.244, 0.54, 1.307, 0.012, 0.196, 0.594, 0.236, 0.053, 0.169, 1.461, 1.461, 0.053, 0.169, 1.461, 1.461, 883.9 | ||||
| (Nm/rad) | 4.15e+6 | (Nm/rad) | 4.93e+6 | (Nm/rad) | 1.05e+5 |
| (Nm/rad) | 1.13e+6 | (Nm/rad) | 4.36e+3 | (Nm/rad) | 4.57e+3 |
| (Nm/rad) | 9.62e+5 | (Nm/rad) | 4.36e+3 | (Nm/rad) | 4.57e+3 |
| (N/m) | 6.73e+8 | (Nm/rad) | 6.83e+5 | (N/m) | 8.05e+8 |
| (Nm/rad) | 1.64e+4 | (mm) | 77.5 | (mm) | 269.8 |
| (mm) | 123 | (kg) | 5.3 | (Nm) | 3200 |
| (°) | 3.5, 11.3 | (°) | 1.5, 9.3 | (rad/s) | 0.01 |
| (Nm/°) | 6.4 | (Nm/°) | 379 | (Nm/°) | 3e+4 |
| (Nm) | 4 | (Nm) | 80 | (Nm) | 100 |
| 1000 | (mm) | 38.2, 114.6 | (mm) | 113.1, 113.1 | |
| b(mm) | 0.04 | 2.78, 1.80 | (mm) | 4.1 | |
| (°) | 15 | B(mm) | 49 | H(mm) | 11.37 |
| z(mm) | 49 | a(m) | 1e-3 | (mm) | 0.001 |
| (°) | 3 | (N) | 1.2e+5 | (m) | 0.54 |
| (m) | 0.4 | m(kg) | 4.84e+4 | ρ(N s 2 m−4) | 1.2258 |
| 0.7 | A(m2) | 8.0 | |||
Handling Editor: Sharmili Pandian
Declaration of conflicting interests
The author(s) declared no potential conflicts of interest with respect to the research, authorship, and/or publication of this article.
Funding
The author(s) disclosed receipt of the following financial support for the research, authorship, and/or publication of this article: This work was supported by the National Key Research and Development Plan of China (2018YFB0106203).