
Abstract
In this study, it was aimed to convey theoretical and practical development of the double eccentric butterfly valve, which would be the first in the sector, with highly efficient, saves energy, has a long life, and requires less maintenance. For this purpose, a prototype with lower weight and higher flow coefficient has been developed by the Computational Fluid Dynamics (CFD) method. Thanks to the use of computer aided design and simulation techniques, environmentally friendly and highly efficient valves have been produced, improving competitive conditions and an innovative product has been obtained in the sector. The design, CFD analysis, and casting simulation were carried out by Solidworks, ANSYS, and Anycasting computer programmes respectively. At the same time, as a result of this study, a design suitable for an innovative production technique that leads to less energy and less waste has been obtained. Innovative material selection and casting techniques were used by optimising the total material weight and valve cost.
Keywords
Introduction
Isolation valves are special types of valves that completely block the flow path of a liquid, thereby isolating part of the system from the flow of fluid. Under normal operating conditions, the isolation valves remain open. Usually, they need to be turned off for safety reasons or in certain special cases, such as maintaining or repairing the system.1–4
Factors that play a role in the selection of isolation valves include whether the flowing fluid is a liquid or a gas, system pressure, fluid temperature and fluid flow rate. Such factors are often considered when choosing not only the type of valve to use, but also the material and valve size.5–8 The expected function of the valve is often also considered in valve selection.
Isolation valves in the industrial valve sector are handled under three groups as: butterfly valves, gate valves, and globe valves.9,10 Figure 1 illustrates the isolation valves used in the industrial valve sector.

A schematic view of the isolation valves used in industrial valve sector (butterfly, gate, globe respectively).
Butterfly valves are produced according to EN 593 standard, and they allow flow in both directions. Although they are generally operated in fully open or fully closed positions, they are also used for fluid control at intermediate angle values.11–13
It is a type of butterfly valve that opens and closes with its flap that moves 90° around the same axis. With its short valve length, it provides an advantage in installations where space is a problem. It allows the flow amount to be adjusted by keeping the flap fixed in a certain position. It gives good results with the low pressure drop it creates when the valve is in the fully open position.14–16
The Computational Fluid Dynamics (CFD) method, which is accepted as a sub-branch of fluid mechanics, is defined as a solution method for fluid-based problems with numerical algorithms. CFD is defined as a simulation tool that is mostly used in processes involving flow (liquid and gas). This method is mostly used to determine the working behaviour of all kinds of convection functions including fluid flow, heat, and mass movements, but the solution of fluid behaviour with the help of analytical equations may not always be possible. In such cases, numerical approaches can be used for the solution. While analytical methods usually produce solutions in the form of mathematical functions, numerical results can usually be obtained in numerical solutions. These obtained results are very close to the actual results and are at a level that can be sensitised to the desired extent. These simulation programmes have become inevitable to be used in valves that are in constant contact with the fluid, such as the valve sector, and are expected to have mechanical strength.17–22
The motivation that started this study is to reduce the friction on the flap surface of existing butterfly valves and to achieve high energy efficiency with a unique design. For this purpose, current products and fluid dynamics calculations with the desired target have been reviewed with simulation studies and the design processes that will minimise the friction on the surface as a result of computer-aided design and prototype manufacturing were explained in detail. Finally, 61.69% in the flow coefficient and 155.32% in fluid resistance coefficient improvements have been obtained. Regarding to the Solidworks sustainability report, total consumed energy value has been improved 24.17% by decreasing the body weight and increasing the flow rate by the revision of the structure.
Material and methods
CFD
In engineering design processes, physical prototyping and testing are commonly used as fundamental tools for design validation, improvement, and optimisation purposes. However, the production and testing of prototypes, which are often required in many fields, can be difficult, expensive, and sometimes nearly impossible. In cases where tests cannot be conducted and/or are not preferred, computer-aided engineering methods are employed. Here, digital prototypes are created (via CAD) and simulations are performed by defining working conditions digitally to gather data about the design and evaluate its performance. The stage of defining these conditions, involving the expression of real conditions through mathematical models, particularly from perspectives such as physics and chemistry, constitutes the most crucial and often challenging phase of computer-aided engineering processes. CFD is the design and analysis method commonly used in the valve industry. In this way, three-dimensional flows inside the valve are simulated using various equations that describe the flow conditions. Its importance for designers is being possible to carry out all the analyses in the virtual environment before the prototype is produced, and to transfer the product to the serial environment conditions, based on the right foundations at the first time and with less labour and material loss. The three-dimensional designs of the products were made with the Solidworks drawing programme. ANSYS computer aided simulation programme was used for CFD analysis and FEA. A butterfly valve with a diameter of 200 mm was selected according to the capacity of the test setup in order to carry out the studies with experimental verifications. In the industry, as defined in the standard, the nominal diameters of the products are classified in mm by adding DN before them, and the pressures at which the products are used are expressed with PN. The designs of the products that can operate under 16 bar pressure, which are the most widely used in applications, have been chosen with DN 200 and nominal pressures were expressed as PN 16. In CFD analysis, it was solved with the K-epsilon turbulence model, and improvements were made in the boundary layers and mesh by keeping the y+ value at 3 and below. 23 Analysis software performs calculations by discretising the solution domain. The most common forms of discretisation are finite element and finite volume methods. When performing discretisation, the existing model needs to be divided into parts. Each divided part, while being a whole, contains the same physical and chemical properties. Each of these divided parts is referred to as a numerical mesh element. The numerical mesh is one of the most crucial elements for achieving accurate and precise solutions. Considering time and computational factors, the numerical mesh has the most significant impact. Therefore, especially in regions with desired or significant variations, precise elements should be used. Conducting a literature review on this matter before starting the analysis and examining numerical mesh elements used in similar analyses will not only guide the project but also provide information about the quantity and quality of the numerical mesh to be used. Depending on the type of numerical mesh used, it is important to be aware of the quality of the numerical mesh by using parameters such as sharpness and aspect ratio after creating the numerical mesh. Especially in analyses where turbulence is effective (such as external flows), it is important to calculate the Reynolds Number and, consequently, the Y+ value before starting the analysis. In addition, in cases where there are special requirements such as geometric complexity and boundary layers, the type of mesh should be considered. It is a crucial aspect to be mindful of, as it affects both the accuracy and precision of the analysis as well as the analysis time. Before proceeding to the final analysis, it is essential to ensure numerical mesh independence, ensuring that the results do not significantly change based on the quantity and quality of the numerical mesh. Otherwise, the obtained results will not be reliable. 24
In summary, proficiency in mathematics, numerical methods, and interdisciplinary collaboration are crucial for the effective utilisation of CFD applications, which encompass a broad spectrum of physical phenomena and require meticulous attention to detail from the initial definition stage to the implementation of numerical solutions.
CFD formulations
Flow coefficient and pressure loss coefficient formulae are defined according to EN 1267:2012 (E) standard. Accordingly, the flow coefficient (Kv) is calculated by equation (1):

Kv (m3/h) in the equation is the flow coefficient, Q is the flow rate in m3/h, ρ is the density of the water in kg/m3, ρ0 is the density of the water at 15°C in kg/m3, Δp (The difference between the inlet pressure and the outlet pressure). It represents the pressure loss in the valve in bar.
The fluid resistance coefficient ζ (zeta) is considered according to equation (2). In equation (2), ΔP is the pressure loss in the valve in pascal, u is the flow rate in m/s, and ρ is the density of water in kg/m3.

According to the EN 1267 flow resistance test standard, the valve was modelled in the Solidworks drawing programme with the valve in the fully open position. The modelling performed is shown in Figure 2.

Disc fully open position solid model of three-dimensional valve.
The analysis of valve performance is a crucial process in engineering applications, often conducted using CFD simulations. These simulations allow for a detailed examination of the flow characteristics passing through the valve. For example, in CFD simulations conducted to analyse flow through a valve in a pipeline, the first step is to transfer the complex geometry of the valve and pipeline into a computer environment to create a detailed geometric model. Subsequently, this geometry is divided into cells (grid) in a suitable number and shape to facilitate numerical solution. During the grid generation process, careful optimisation is performed, considering the complexity and interactions of the fluid. The fundamental equations of fluid dynamics, such as the Navier-Stokes equations, are then solved using numerical methods on the obtained geometric model and grid structure. These equations mathematically describe the movement and interactions of the fluid and require specific numerical algorithms for solution. For successful simulation, the inlet and outlet points of the fluid and the flow conditions applied to the valve surface must be accurately defined. This involves specifying initial and boundary conditions, including parameters such as flow velocity, pressure, temperature, and other fluid properties. After completing the solution process, the obtained results are analysed. This analysis may include factors such as the velocity distribution, pressure profile, turbulence effects, and energy losses within the flow passing through the valve. This information provides important feedback for evaluating the valve’s performance and, if necessary, optimising its design. In conclusion, CFD simulations play a significant role in solving complex fluid dynamics problems encountered by engineers in the processes of improving valve design and optimising flow control. With the design in question, performance evaluation can be conducted without the need for prototype production, allowing for design revisions to be made. This results in significant time and cost savings before final production.
FEA
The strength values of the valve designed in FEA were determined according to the boundary conditions defined in the EN 1074 standard. In FEA, the parts were handled with two different numerical methods, singular and assembled, and interpolation solution was realised with the Rayleigh-Ritz method. Independent of each other by using natural boundary condition modes while obtaining the equations, there are difficulties in terms of both the size and number of mode shapes. This difficulty can be reduced somewhat by reducing the number of mode shapes.
This method was used to reduce the size of the vector representing the form. Moreover, the boundary conditions specified in the standard were applied exactly and were defined as one and a half times the nominal pressure value for the body part and 10% more than the nominal pressure value for the disc part. The importance of FEA is critical on the hydrodynamic test determination, too. The hydrodynamic tests of the produced body and mounted disc were carried out according to EN 1074 standard. Regarding to the definition of this standard, pressure tests were evaluated for the body under 16 bar pressure without showing the leakage and damage on the valve. The reason to choose this procedure was to evaluate the hydrodynamic behaviour of the isolation valves on the tough environment according to the FEA analysis results.
Materials selection
While modelling the body part in contact with the fluid, as a result of the analyses made according to EN 12266 and EN 1074 standards, the body material that can withstand one and a half times the pressure value of the body pressure was selected. The throttle material that will withstand 10% of the pressure value was selected by the same method, and the material was selected according to the stresses and deformation results in the parts according to the body and throttle strength analyses. Referring to the finite element mechanical analysis, EN GJS 400-15 material was selected.
The stresses in the system were handled with the product and process design were carried out in a virtual-simulated environment. In the finite element analysis, pressure was defined on the body fluid contact surfaces and the body was given a curved structure, thus reducing weight. Figure 3 shows the current product’s body (a) and designed curved body structure (b)

Finite element analysis stress distribution. (a) the current product’s body (b) designed curved body structure.
Disc material was selected the same methodology with the body structure and the new design comparison with the previous version was shown in Figure 4.

Old version (left), new designed disc solid model.
Flow simulation
After all the flow and pressure analyses were performed, the analyses of the hydrodynamic forces on the disc were performed. Therefore, Figure 5 shows the CFD mesh analysis image of the hydrodynamic forces on the disc. The purpose of the mesh analysis was to break a complex volume into small segments to be simulated. By definition, a mesh was a network of cells and points. It could have almost any shape in any size.

A schematic view of the mesh FEA of the disc in the curved body structure.
Disc subjected to hydrodynamic load and the pressure position change on the surface is given in Figure 6. This figure indicates the force distribution on the operating disc assembled to the valve body.

FEA of hydrodynamic forces on the disc.
Design verification, validation, and prototype production
The casting model of the valve, which was designed by analysing its hydrodynamic properties, and the production of the core box were carried out on CNC machines with CAM software. After the GGG50 - DDK50 - ASTM 70-50-05 cast iron alloy was prepared by the company, the liquid metal sample taken from the ladle was solidified before casting and analysed in the Foundry-Master Xpert spectroscopy device. Analysis results are shared in Table 1.
The chemical analysis of GGG50 alloy.

Following the trial castings, hot tearing defects were observed in certain parts of the part. The images of the error are shared in Figure 7.
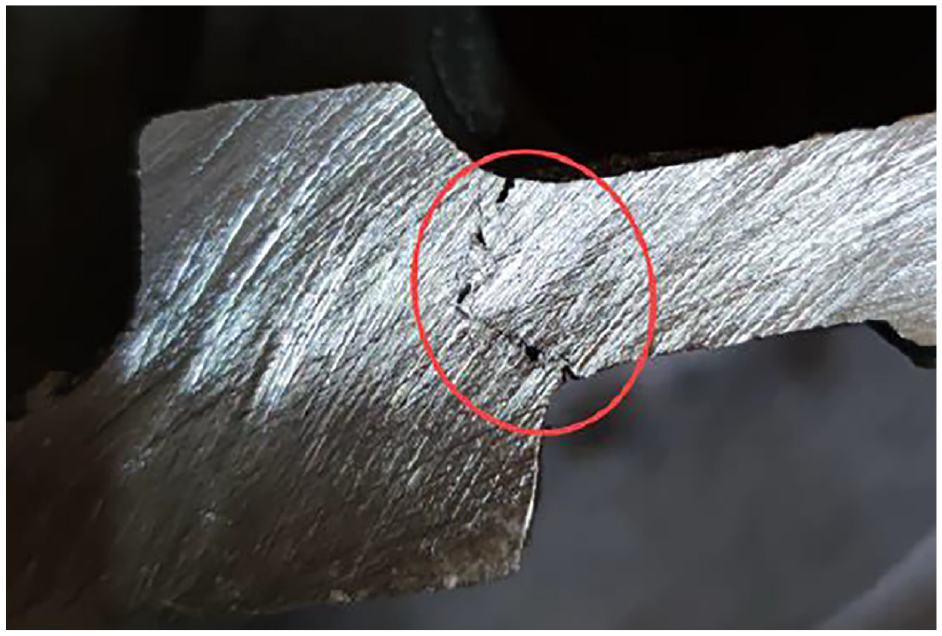
Cross-section view of the hot tear defect encountered in the part.
Hot tearing is one of the most serious defects encountered in castings. When Figure 7. was examined carefully, it was concluded that the cause of the error was the sudden cross-sectional change in that region. The formation and propagation of hot tear is directly related to parameters such as cooling rate, solidification time, temperature gradient, chemical composition of the alloy and casting geometry. The schematic view of the tensile stress occurring in this region is given in Figure 8.

Schematic representation of the hot tear mechanism.
At this stage of the study, considering that the cooling rates are different due to the difference in cross-sectional thicknesses in the defected region, a change was made in the casting design and the simulation study was started by designing the full core, which was made in the wrong product design, in the form of shell core. In order to eliminate the error, it was decided to change the casting design and to return to the shell type core design, considering that the solid core mass causes rapid cooling of the thin areas in the casting. The cooling rate analysis image of the shell type core design casting simulation is given in Figure 9.

Simulation analysis of the cooling rate of the faulty zone (left) and the cooling rate of the zone healed with the shell core (right).
The solid model for verification of the design was carried out by Solidworks. This stage had a final and critical importance in which the manufacturability decision of the product would be made virtually. With the help of computer-aided design and simulation, it was determined that the product could be produced without any problems in the virtual environment, and the production stages in the real environment were started. The prototype developed product was carried out by considering the design parameters and its image is given in Figure 10.
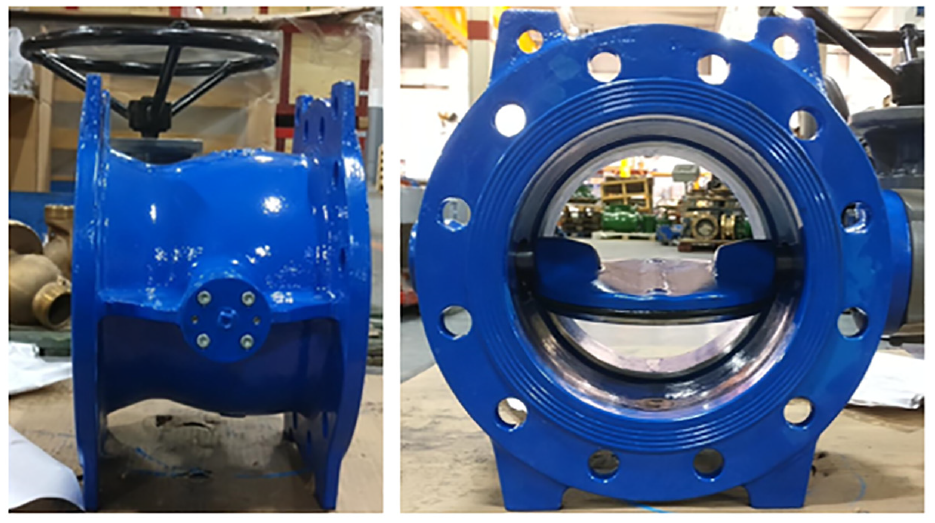
Prototype production image of the body structure and improved disc assembly.
Figure 11 presents microstructure photographs of the cast GGG-50 spherical grafted cast iron sample, providing detailed insights into its composition and characteristics. The microstructure analysis reveals the presence of spherical graphite, ferrite (depicted as white areas), and perlite (observed as dark areas). Notably, the absence of carbide or casting defects underscores the high quality of the microstructure. The spherical graphite morphology suggests a well-controlled casting process, contributing to the material’s enhanced mechanical properties. Moreover, the microstructural examination offers valuable information regarding the hardness of the material. In the as-poured state, the hardness measurement yielded an approximate value of 175 HB (Brinell hardness). This hardness level indicates the sample’s suitability for various engineering applications, balancing strength, and machinability. The absence of casting defects further enhances the material’s reliability and performance, ensuring its integrity under operational conditions. The microstructure analysis serves as a crucial tool for assessing the quality and performance of cast components, providing valuable insights for process optimisation and material selection. In this case, the observed microstructural features validate the efficacy of the casting process and highlight the favourable properties of the GGG-50 spherical grafted cast iron sample.

Microstructure photographs of GGG-50 spherical graphite cast iron specimen: (a) polished and (b) etched surface.
Conclusion
As a result of the study, an innovative product was created in the market by increasing the fluid passage area with an innovative body and disc design and reducing the diameter narrowing caused by the body seating surface in double eccentric butterfly valves. In the simulation analyses carried out with the products designed for use in fluid lines, product and experimental designs were carried out with a line pressure of 16 bar in the system.
The simulation results were examined by going down to the root cause of the error in the first produced part and it was determined that the error was caused by the cooling rate differences. As a result, the casting design was optimised, and a solid product was obtained by performing castings according to this design. It has been determined that the simulation results and the real results overlap.
Cast design is critical in eliminating the hot tear failure. Balanced cooling and solidification ensure that such errors are not encountered during casting. In this study, by reducing the cooling rate differences, hot tearing defects in the part were prevented.
Particularly in recent years, part-based simulation studies have been carried out in almost every engineering product to increase efficiency and mechanical properties, and theoretically, a significant increase in productivity has been achieved. However, any optimisation made without examining the issue of manufacturability may come across as a loss. Therefore, in product-based optimisation studies, production simulation software such as casting simulation should be used by considering the production leg.
Moreover, no plastic deformation or leakage was observed in the final products that are cast and assembled under a line pressure of 16 bar. With the new design, the body wall thickness has been reduced from 22 to 18 mm, and the rate of fluid passing through the disc has been increased by 20%.
In the new design, the flow was more accelerated around the disc than in the old design, and as a result the rear flow separation was relatively greater flow lines in the new design (Figure 12). The flow structures around the valve were more homogeneous, but the eddies were similar.
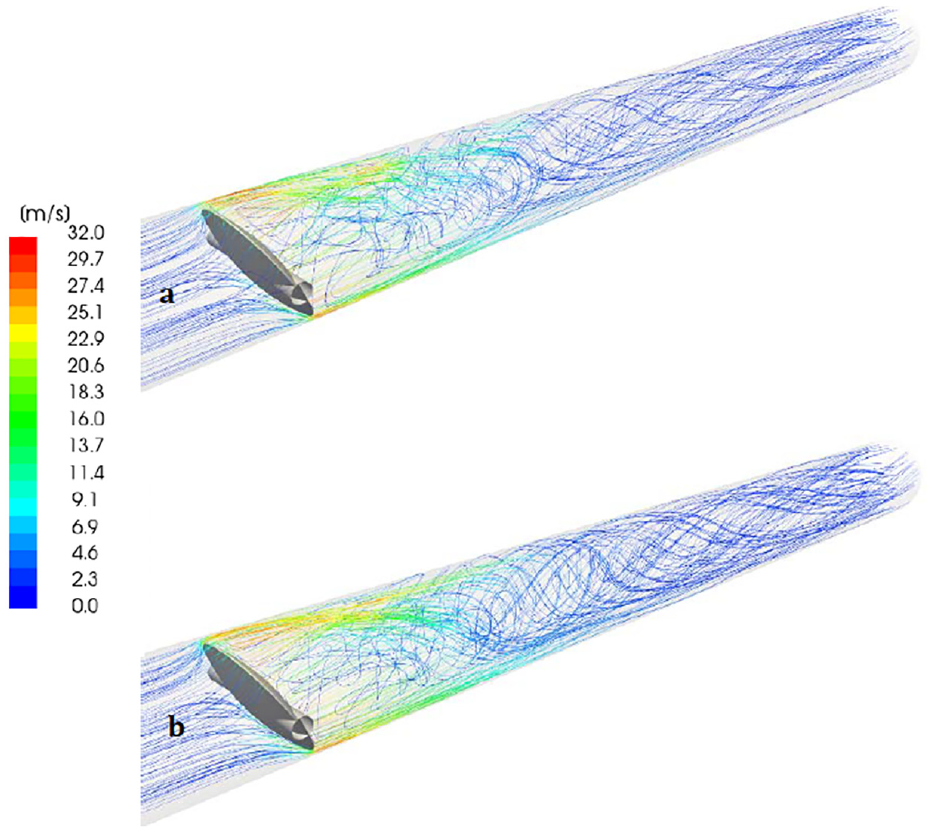
CFD flow line analyses for 75° around the valve (a) new design and (b) old design.
Discussion
The comprehensive analyses, tests, and simulations conducted in the study resulted in significant improvements in system performance. Specifically, the CFD analyses and Solidworks simulations indicated a notable increase in the flow coefficient from 1861 to 3009 m3/h, reflecting enhanced fluid flow efficiency. Simultaneously, there was a significant decrease in the fluid resistance coefficient, dropping from 0.720% to 0.282%.
Furthermore, based on data from the Solidworks sustainability report, the analyses demonstrated a remarkable 24.17% reduction in total energy consumption by the result of the implemented changes. This substantial energy-saving achievement underscores the effectiveness of the optimisation efforts undertaken in the study. As a result of the analyses, simulations, prototype production, and hydrostatic tests, a unique check valve article was presented for the first time in the industry. The project has been a guide in improving and developing the product geometry for the final goal, with various and repetitive applications on flow analysis. At the same time, it has been satisfactory that the needs can be met with the mechanical auxiliary equipment applied. With this completed project, R&D capability for the design of variant products has been increased and national and international patent applications have been made for the curved body and stepped shaft of the product that is the output of this project. Regarding this design, R&D Innovation Project has also been successfully concluded.
All these improvements realised with simulation supported designs and analyses are summarised in Table 2.
The comparison of the developed design and current product.

Footnotes
Acknowledgements
I would like to thank KOSGEB for its support to our project titled ‘New Generation Butterfly Valve with Minimised Flow Resistance, Working with Low Torques, Enhanced Corrosion Resistance, High Performance’, which was supported within the scope of the R&D Innovation Support Programme.
Handling Editor: Jingfa Li
Declaration of conflicting interests
The author declared no potential conflicts of interest with respect to the research, authorship, and/or publication of this article.
Funding
The author received no financial support for the research, authorship, and/or publication of this article.
Data availability
All data generated or analysed during this study are included in this published article [and its supplementary information files].