
Abstract
Bearing faults in gearbox systems pose critical challenges to industrial operations, needing advanced diagnostic techniques for timely and accurate identification. In this paper, we propose a new hybrid method for automated classification and identification of defective bearings in gearbox systems with identical rotating frequencies. The method successfully segmented the signals and captured specific frequency components for deeper analysis employing three distinct signal processing approaches, ensemble empirical mode decomposition EEMD, wavelet packet transform WPT, empirical wavelet transform EWT. By decomposing vibration signals into discrete frequency bands using WPT, relevant features were extracted from each sub-band in the time domain, enabling the capturing of distinct fault characteristics across various frequency ranges. This extensive set of features is then served as inputs for machine learning algorithm in order to identify and classify the defective bearing in the gearbox system. Random forest RF, decision tree DT, ensemble tree ET classifiers showcased a notable accuracy in classifying different fault types and their localizations. The new approach shows the high performance of the diagnostic gearbox with a minimum of accuracy (Min = 99.95 %) and higher stability (standard deviation = 0.1).
Introduction
Bearings are an essential component used in a broad range of industries, including automotive, wind turbine power generation, agriculture, manufacturing, and many others. They are widely employed in rotating machinery 1 and gearboxes2,3 and being crucial transmission devices. In some situations, rotating machinery and gearbox systems may need to operate in conditions that are not ideal. These conditions may include situations where the system is subjected to high levels of stress, such as when it is overloaded or required to work at variable speeds. Additionally, the system may also have to work in environments with high ambient temperatures, which can further increase the stress placed on the system. A defective in a bearing, if it is not detected in time, this can lead to catastrophic machinery failure, prolonged machine downtime, and higher maintenance costs, resulting in significant financial loss. Further, the statistics that have been made show that the bearings defects represent about 76% in wind turbine gearbox. 4 In order to ensure the safety of the system and to avoid damage, condition monitoring refers to the process of monitoring the condition of a system to identify any changes or abnormalities. On the other hand, fault diagnosis identifies the cause of a fault in a system. Applying the concepts of condition monitoring and fault diagnosis can improve the reliability and performance of a system, and the key challenge is to detect any defects at an early stage.
Signal processing approach can be employed to diagnose the bearing fault by utilizing the motor current, 5 acoustic emission, 6 and thermal image. 7 However, numerous research studies have shown that the vibration signal is the most practical method to identify the bearing fault.8–10 In modern industry with rapid development of sciences and technologies, Artificial Intelligence (AI) becomes a powerful tool for diagnosing faults. Therefore, essentially, two crucial steps have to be developed in AI tool: Features extraction, and fault recognition.
Several studies have been developed to improve feature extractions and to describe the bearing conditions. Most of frequency methods applied for nonstationary signals, 11 allow the extraction of the most relevant information from the raw vibration signal. To decompose the signal into an intrinsic mode function (IMF), some authors12,13 use the empirical mode decomposition (EMD) method. However, this method has a disadvantage called mode mixing, 14 which occurs when the intrinsic mode functions (IMFs) obtained from the decomposition process are contaminated by components from other modes. To mitigate the issue of the mixing mode, several techniques have been proposed, such as ensemble empirical mode decomposition (EEMD),15–17 these technique use various methods, such as adding white noise to improve the accuracy and robustness of the decomposition.
Wavelet transforms analyze signals at different scale or resolution through a wavelet basis.18,19 It is used to decompose signals into series of signal-components. This technique is a powerful tool for signal denoising, 20 but its weakness is the split of the high-frequency band which does not occur when the fault information exists. 21 To conquer this issue, wavelet packet transform 22 enable detection of both high and low frequency components with varying levels of decomposition. 23 By decomposing the signal into sub-bands using the wavelet packet transform, we can effectively separate the signal into different frequency components, allowing us to analyze and understand the signal in more detail. The decomposed signal is widely employed in fault diagnosis, particularly in extracting significant feature for the identification and analysis of fault. 24
Now, the challenge for researchers is to build an automatic fault diagnosis system, so that it is able to detect the defect in an early stage, identify and classify fault. The recent work on automatic fault diagnosis have focused on improving accuracy to the fault identification and localization. A variety of studies have been successfully employ artificial intelligent technique for bearing fault classification. Different machine learning algorithms are used such as: Artificial Neuron Network (ANN), 25 Fuzzy Logic System (FLS), 21 Support Vector Machine (SVM), 26 and Random Forest (RF). 27
The structure of this paper is as follows: Section “Introduction” provides an introduction to the study and concise the overview of the existing literature. In Section “Gearbox System Description,” the mathematical model of the examined gearbox is presented. Section “Methodology and Fault Scenario,” we delve into the signal decomposition of both healthy and faulty modes, achieved by employing wavelet packet transform to extract pertinent signal features. Section “Results and Discussions” encompasses the outcomes and discourse on fault classification. Finally, the paper is ended with a conclusion and references.
Gearbox system description
In this paper, a new Gearbox system that has been realized in the laboratory is used to validate the fault detection and classification performance of the data-based methods versus different rolling bearings faults modes.
In this study, a Gearbox system was proposed, the physical model given in Figure 1, is described by the laws of physics to obtain the mathematical model. Hence, the major assumptions of the dynamic model are based upon28–30 and are as follows:
Neglect the resonances of the gear case and the shaft transverse resonances;
Inertia and shaft mass are lumped at the bearings;
Ignore the shaft torsional stiffness (because the flexible coupling torsional stiffness is very low) and inter-tooth friction;
Gear teeth profiles are perfect involutes curves, with no geometrical, pitch or run out errors.

Considered gearbox system: (a) real gearbox system and (b) physical gearbox system.
The system is presented in order to simulate the effects of the bearings faults, over the dynamical behavior of our model. The corresponding mathematical model has been developed.
With 10 degrees of freedom and 10 generalized coordinates the physical model has four angular variables
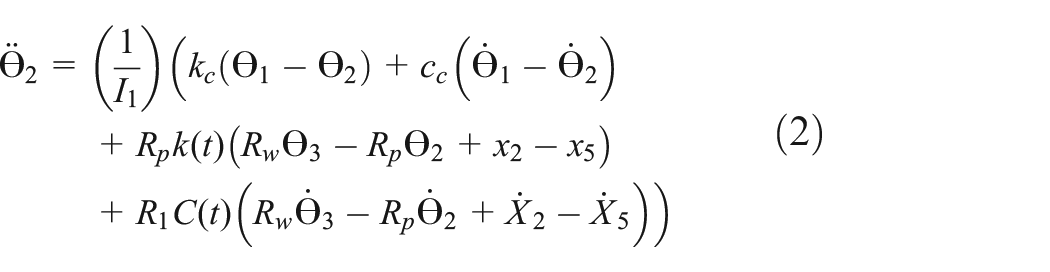
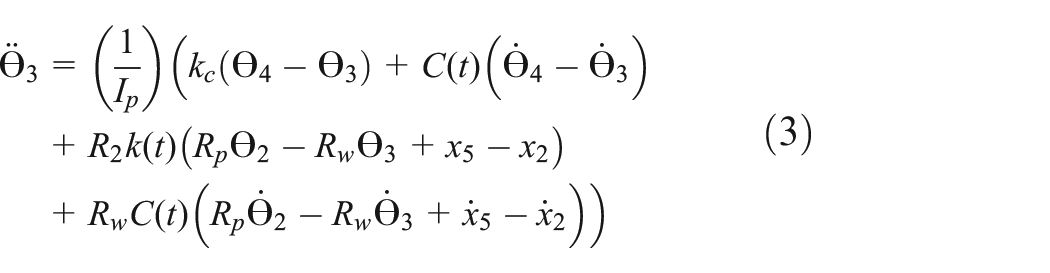
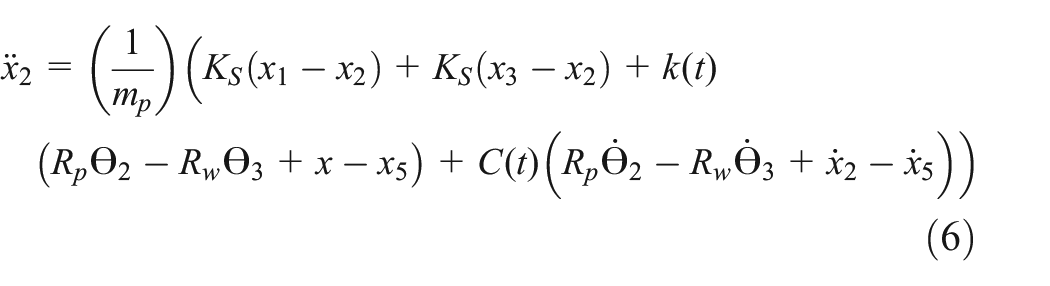
Gearbox mechanical equations
First, it is necessary to write the gear model system in state space representation. In such a way that each second-order differential equation is written in the form of two first order differential equations. Thus, 10 nonlinear first order differential equations with time varying coefficients are obtained. These equations are written such that each equation contains the time derivative of only one variable. Thus, the obtained equations are simulated under Matlab software. The main notation used in the obtained equations are given in Table 1.
Gearbox data parameters.

Circular motion


Movement straight


Vibration in bearings can stem from different origins, each of which can be distinguished by specific force factors. The primary culprits are bearing flaws, imbalances, and misalignments. Table 2 outlines the distinctive force factors linked to the prevailing causes of vibrations.
Fault functions parameters.

Table 3 provides the principal symbols employed to describe the functions related to bearing defects.
Notation of the fault functions.

Methodology and fault scenario
Our objective is to diagnose the bearings in the gearbox and classify the defective bearings using vibration signal. The study focuses on two bearings positioned within the shaft that is linked to the motor. As a result, both bearings rotate at the same speed and have identical dimensions. In order to improve feature extraction and create meaningful attributes for training classifiers, the vibration signal is decomposed.
The developed approach is based on two methods: signal processing technique versus Hybrid signature method. In the first step, we utilize the Autogram to extract the AM-FM modes from the vibration signatures. This technique allows us to precisely decompose the signal into a fixed number of modes. This will show significant results for detecting defects in bearings. The second step, consists of our developed study where we combine between the wavelet packet transform, the statistical feature extraction, and the feature classification by using Random Forest algorithm. Firstly, we decompose the signal using wavelet packet transform into high-frequency band and low frequency components to select the effective modes capture the characteristics of the vibration signatures. Then we calculate the set of features listed in Table 4 for 15 modes, resulting in 180 attributes. Hence, we obtain a more detailed understanding of the underlying characteristics of the vibration signature, which enables us to identify subtle changes and patterns that may be indicative. Finally, using the Random Forest classifier for faults identification and classification.
Features extracted from the WPT.

Signal processing technique using Autogram
However, the proposed signals processing method, namely Autogram method developed by Moshrefzadeh and Fasana 31 has proven to be more efficient than wavelet analysis in many applications.32–34 The Autogram is released fourth-order spectral analysis tool for the detection and characterization of transients in a signal. The paradigm is based on the affirmation that each type of transient is combined with an optimal frequency and frequency resolution (dyad {f, Bw}) that maximizes its kurtosis, and therefore its detection. This could describe the Autogram in the following steps:
Step 1: data signal is filtered and divided in frequency bands and center frequencies using decimated wavelet packet transform (MODWPT).
Step 2: using periodicity of the autocovariance function, we calculate the unbiased autocovariance AC of the squared envelope for each node from signal filtered in step 1.
Step 3: find the most suitable frequency band for demodulating signal to have the successful diagnosis of bearings faults.
Diagnostics using Autogram is one of the most relevant methods; it demonstrated significant results for the detection of defects in bearings.31,35 We will apply Autogram on the signal to shows the squared envelope spectrum for different states of rolling element bearing (healthy/faulty) in the gearbox. The healthy envelope signal is show in Figure 2. There is no frequency that characterizes the rolling element bearing failure in this figure; which means that the system is in a healthy state. The meshing frequency fmesh is the only frequency that appears.

Healthy state of gearbox system.
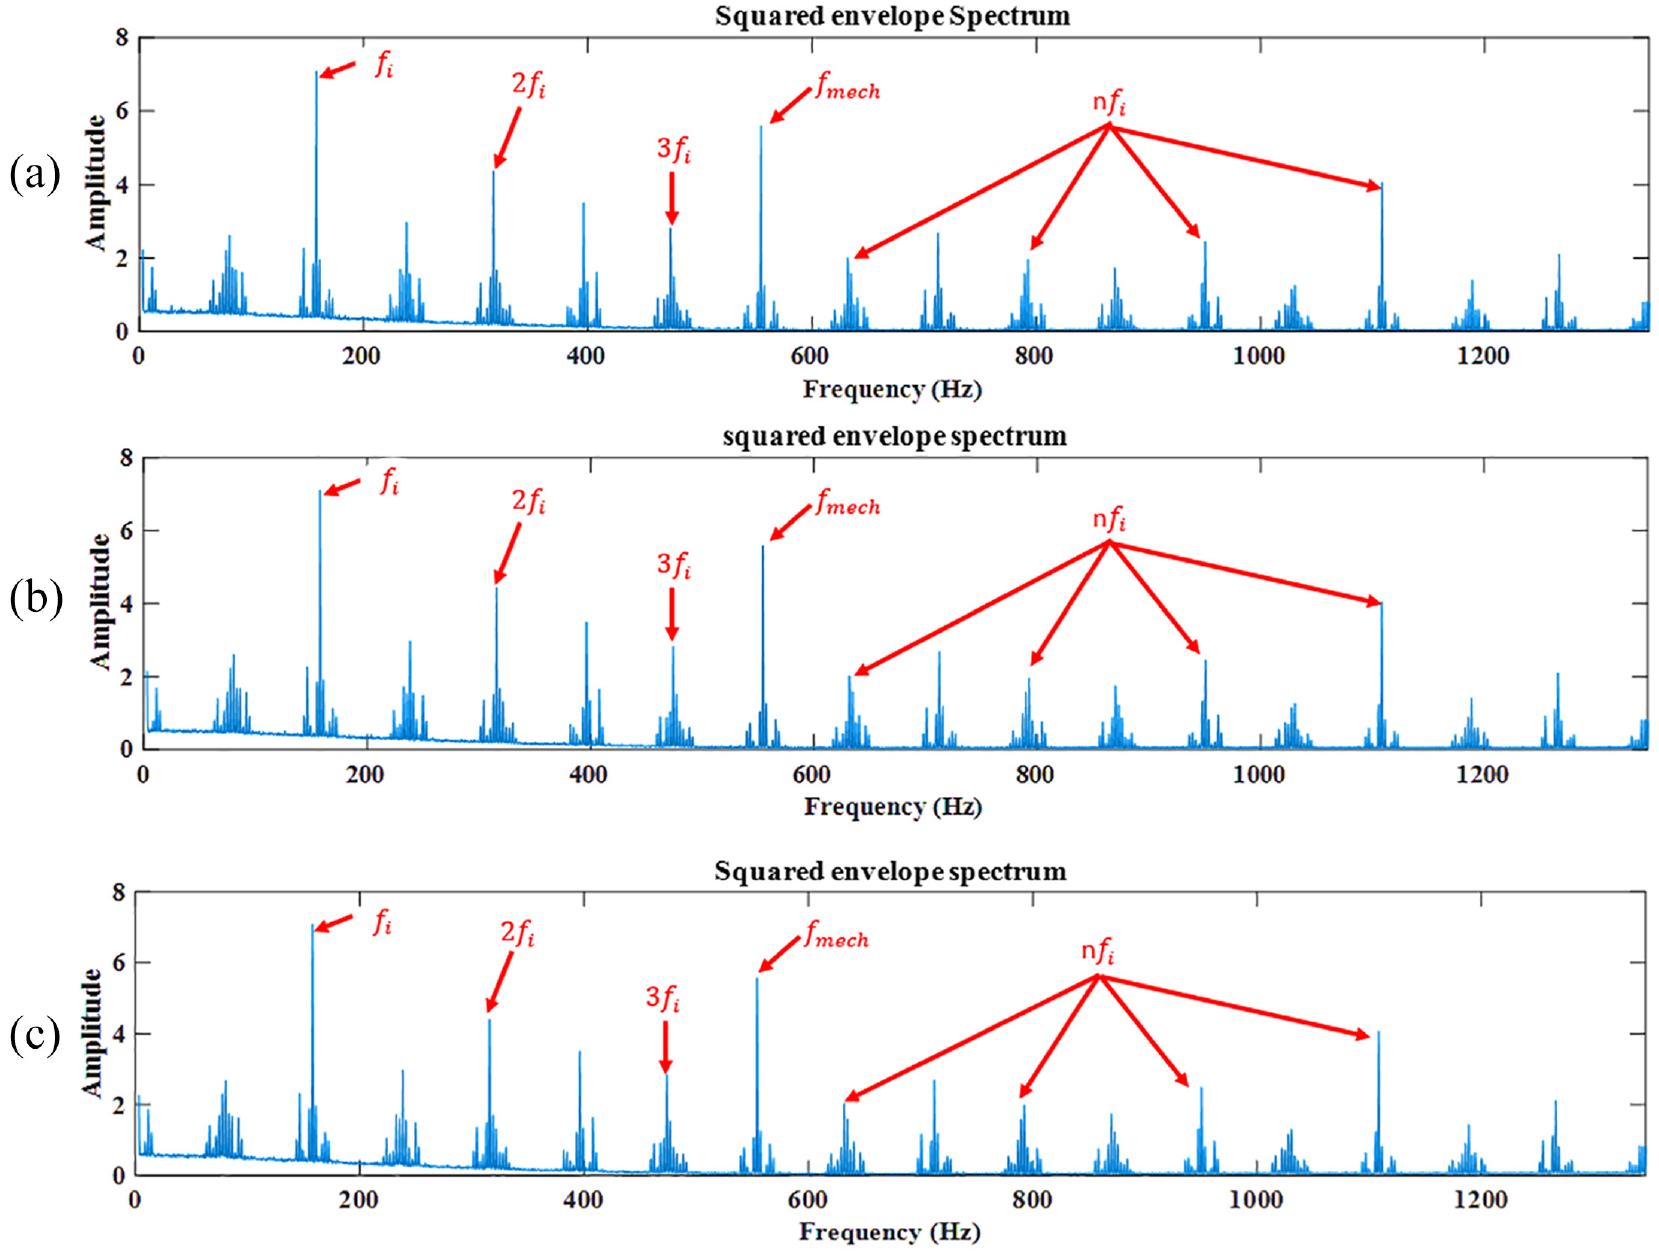
Furthermore, in order to ensure the information provided by Autogram the squared envelope spectrum of the signal with fault for three type of defects of the rolling element bearing (ball, inner race, and outer race faults) are presented in Figures 3 to 5 respectively. This is done under three different cases: case 1: defect in bearing 1, case 2: defect in bearing 2, and case 3: defect in both bearings at faith.

Bearings fault in different scenario at ball fault: (a) bearing 1, (b) bearing 2, and (c) both bearings simultaneously.
Bearings fault in different scenario at inner race fault: (a) bearing 1, (b) bearing 2, and (c) both bearings simultaneously.

Bearings fault in different scenario at outer race fault: (a) bearing 1, (b) bearing 2, and (c) both bearings simultaneously.
According to the obtained results based on the squared envelope spectrum, this approach allows us the detection of the fault in bearing whatever the type of defect either for ball, inner race or outer race. The gearbox system considered by this study contains four bearings with identical dimensions (same frequency characteristics of the defect) and the same rotation frequency of each pair of bearings (the rotation frequency of the motor shaft and the rotation frequency of the load).
As a consequence, the current approach is not be able to locate the fault. From these figures we can see that it is not possible to determine the exact location of the defect using envelope analysis, as this approach does not provide information about whether the defect is present in bearing 1, bearing 2, or both bearings simultaneously.
A hybrid signature methods
In this section, the decomposition process of the proposed method starts by applying the wavelet packet transform to the original signal and then dividing the resulting into high-frequency band and low frequency components until the desired level of decomposition is reached. The proposed study-based wavelet packet decomposition and machine learning are presented in the following flowchart given in Figure 6.
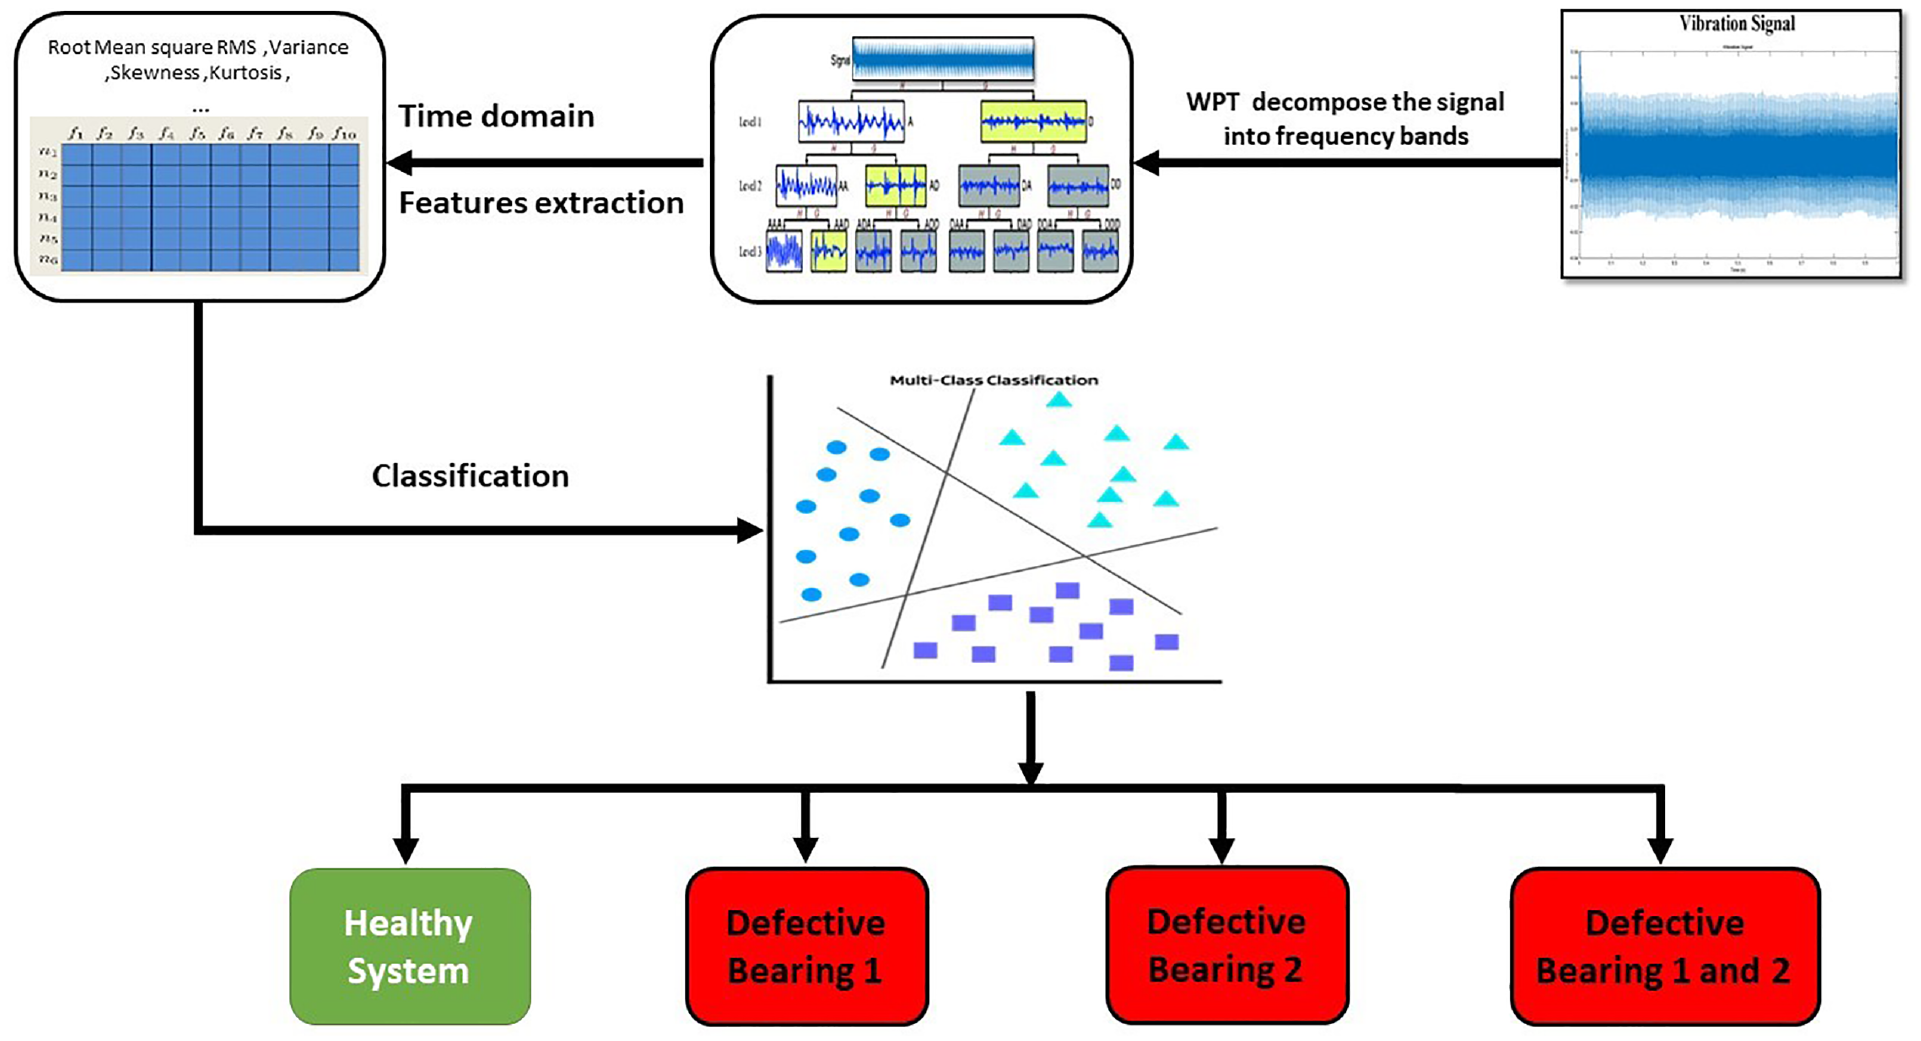
Flowchart of the proposed approach.
Ensemble empirical mode decomposition
Empirical mode decomposition serves as a self-adaptive approach for analyzing nonlinear and non-stationary signals. It works by breaking down complex signals into a set of intrinsic mode functions (IMFs), which are determined based on the signal’s local characteristic time scale. An IMF is defined by two key conditions: firstly, within the entire dataset, the count of extrema and zero-crossings must be either equal or differ by at most one; secondly, at any given point, the mean value between the envelopes formed by local maxima and minima is zero. The EMD process of a signal x(t) can be described as follows:

Where
(1) Identify the local maxima and local minima to produce upper envelope and lower envelope.
(2) Obtain the first component
(3) Consider
The final result, denoted as
To address mode mixing in EMD, Wu and Huang 15 introduced ensemble empirical mode decomposition (EEMD), an enhanced variant of EMD. EEMD employs a noise-assisted approach by introducing finite white noise to the signal under investigation. This addition effectively resolves the mode mixing issue across all scenarios automatically. Consequently, EEMD stands as a significant advancement over traditional EMD methods.
Considering the characteristics of EMD, the proposed EEMD is formulated as follows:
add a white noise series to the targeted data;
decompose the data with added white noise into IMFs;
repeat step 1 and step 2 again and again, but with different white noise series each time; and
obtain the (ensemble) means of corresponding IMFs of the decompositions as the final result.
Based on the principle and observations above, the EEMD algorithm can be given as follows:
(1) Set the initial values for the ensemble number
(2) Execute the
(a) Add a white noise series with the given amplitude to the investigated signal

where
(b) Apply the EMD method, as described earlier, to decompose the signal
(c) If
(3) Compute the ensemble mean

(4) Report the mean
Empirical wavelet transform
Gilles
36
recently introduced the Empirical Wavelet Transform (EWT) within the realm of non-stationary signal processing. The primary aim of the EWT is to construct adaptive wavelets capable of effectively extracting amplitude modulation-frequency modulation (AM-FM) components from a signal. To achieve adaptability concerning the analyzed signal, the selection of the wavelet filter bank is guided by Fourier supports. The information extracted from the processed signal spectrum is used to identify Fourier supports. This involves locating local maxima and defining the support boundaries
We begin by partitioning the Fourier support

Segmentation of the Fourier axis and construction of EWT wavelets.
Hence, establish the empirical scaling function and empirical wavelets using the expressions provided in equations (14) and (15), respectively.


The function
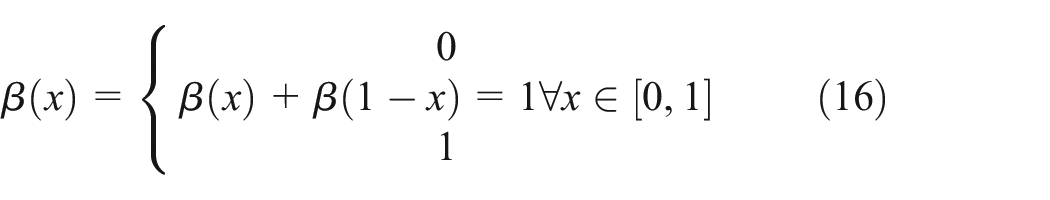
Note that the most used function that satisfies this property:

The detail coefficients

The approximation coefficients with scaling function is given:

Finally, the original signal is decomposed into various empirical modes

The signal can be reconstructed as follows:

Wavelet packet transforms
The wavelet transform has been widely used in signal processing and signal denoising. 18 The wavelet method uses the time-frequency representation of a signal through a set of wavelets.
The wavelet packet transform is an extension of the discrete wavelet transform (DWT).
37
In the DWT the signal (

(a) Decomposition signal using DWT and (b) tree decomposition of signal.
In practice, the Discrete Wavelet Transform (DWT) can be realized using a set of low-pass and high-pass wavelet filters, represented as
These filters are derived from the chosen wavelet function

Using the wavelet filters, the signal is decomposed into a set of low and high frequency components as 38

Equation (23) defines
The WPT splits the approximations and details into finer components. Therefore, it can decompose the high frequency part.
To conduct Wavelet Packet Transform (WPT) of a signal at a specific level (e.g. level 3), the functions described in equation (22) are combined as follows:
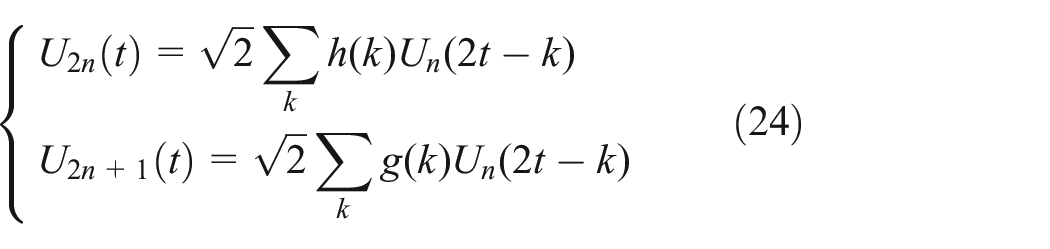
where

where

Illustration of wavelet packet transform.
The vibration signals analyzed in this study covering both bearings for the normal (Healthy H) operating condition and three distinct bearing defects of each one: Inner Race Fault (IRF), Outer Race Fault (ORF), and Ball Fault (BF). In Figure 10, the vibration data corresponding to various fault types, along with the healthy state, is presented.

Original vibration signals of different bearings health state.
In this situation, we choose to decompose the signal into three levels of decomposition, which means that the resulting wavelet packet tree will have three levels of sub-bands. Each sub-band in the tree represents a different frequency range and resolution of the original signal. By decomposing the signal into sub-bands using the wavelet packet transform, we can effectively separate the signal into different frequency components. Signal decomposition with the Daubechies 4 mother wavelet is given in Figures 11 and 12.

Signal decomposition results using WPT for bearing 1.

Signal decomposition results using WPT for bearing 2.
The vibration acceleration signals of rolling bearing in different conditions modes are shown in Figures 11 and 12, which represent the bearings in different modes of faults, outer race, inner race, and ball faults. These figures show that the vibration signals in the four conditions mode are highly complex, which lead to the incapability of making difference between the faults in each case.
Features extraction based on signal processing
Feature extraction is a critical step in data processing that involves identifying and transforming relevant variables from raw data. This technique is essential for preparing data for further analysis, modeling, or visualization. Raw data often contains numerous variables that can lead to increased computational complexity and memory usage. Feature extraction aims to reduce data dimensionality while retaining essential information.
At this level of development, we focus our study by determining 12 statistical feature parameters through the approximation and detail of decomposition until level 3. To calculate the statistical feature parameters, a range of statistical measures are employed for both the approximation and detail signals at each level of decomposition. These measures encompass a variety of statistical indicators, such as max, min, rms, mean, variance, skewness, kurtosis, energy, entropy …, etc.
Feature selection and classification
In the last decay, machine learning has produced considerable results in a number of application areas, including Rolling bearing problems. In this contribution, we have used a random forest algorithm, which is a supervised machine learning method adapted to both binary and multiclass failures. 40
This algorithm has been successfully used to solve a number of complex applications and has several desirable features. The main features of this algorithm are:
Ensemble method combined with several decision trees
Each forest tree selects best prediction
Random feature selection avoids over-fitting by de-correlating trees
Keeps track of incomplete data and non-linear variables between features and target variable.
Handle both binary-faults and multi-faults issue.
The standard equation employed in Random Forest is the Gini impurity, which is designed to identify the quality of the decision tree split. Gini impurity is a probability a function of randomly selected components in the data set being misclassified. It is defined as follows:

Where
The random forest algorithm is an ensemble learning technique that has been developed to combine several decision trees to form a more robust model (Figure 13). Several trees are trained on different subsets of data and features, which reduces over-fitting and improves accuracy. 41

Random forest flowchart.
Results and discussions
This section presents the outcome achieved through three signal processing techniques, namely ensemble empirical mode decomposition (EEMD), wavelet packet transform (WPT), and empirical wavelet transform (EWT). For each technique, we generate a feature matrix based on the time domain parameter listed in Table 4, which is then prepared for classification defective bearing in gearbox.
The classification process is performed using six different classifiers, which include random forest (RF), decision tree (DT), k-nearest neighbors (KNN), support vector machine (SVM), ensemble tree (ET), and Gaussian mixture models (GMM). The classifiers are evaluated through a 10 iteration loop, while the stability of the machine learning techniques is assessed using the standard deviation formula (STD).
The used ML tools demonstrate the varying outcomes regarding to the accuracy and stability. Where the ML inputs are the time domain feature obtained from EEMD, WPT, and EWT. Knowing that the output are the bearing states which can be in healthy mode, either defectivity in 1st or 2sd bearing, or defectivity in both bearings. Then we locate the faults at the ball, in the inner race or the outer race. Eighty percent of data are used for training and 20% of data are used for testing the model.
Table 5 shows the classification accuracy results and the classifier stability of the model. We observe that signal processing with WPT gives the best classification results compare to EEMD and EWT. This table, we notice that it indicates only the global accuracy. There is no credible indicator which allows us to conclude that the model gave the best classification.
Classification results using WPT with different classifiers.

We know that generally, sometimes we may have a high global accuracy, which may contain classes with a low precision. To enhance the performance accuracy and stability of the system, we have implemented four key metrics which are the mean, max, min, and standard deviation. By doing, this we can appreciate better the performance of the RF classifier’s. This RF classifier yields us to the best outcome in terms of stability (Std = 0.01) and mean accuracy (99.99%). Even though, the RF, DT, and ET, also show best classification in terms of accuracy and stability.
To assess the capability of fault prediction detection we have provided various types of fault to test the proposed approach. The obtained prediction confusion matrixes for different considered faults are given in Figures 14 to 16. Through these figures we can see the accuracy from classifiers RF, DT, and ET of each class for fault classification of bearing defect.

Prediction confusion matrix for fault diagnosis based WPT-RF.

Prediction confusion matrix for fault diagnosis based WPT-DT.

Prediction confusion matrix for fault diagnosis based WPT-ET.
Figure 14 shows the WPT in tandem with the RF algorithms, that the vast existing numbers of sample for the considered bearing faults in the proposed approach are predicted successfully with highest percentage scales between 99.76% and 100%.
We can conclude that the proposed approach based on WPT in tandem with RF classifier, enables us to improve the system performance in terms of reliability, stability, and accuracy.
Conclusion
In this study, the dynamic model of a gear-box bearings defective system was developed to examine the vibration behaviors in presence of bearings faults. We modeled these two faults by an amplitude reduction and phase change in gear stiffness. Firstly, the fault diagnosis of bearings is performed using the squared envelope spectrum obtained from Autogram. The analysis was conducted for healthy bearings showing only the gear mesh frequencies (Figure 2). These frequencies happen to appear also in the first bearing or the second bearing or for both bearing defects (Figure 3). Nevertheless, we see the appearance of new frequencies providing information about the fault types (ball fault, inner race fault, and outer race fault). As a result, the obtained spectrums based on Autogram cannot differentiate between these bearing defects
Secondly, the proposed approach based on hybrid method for bearing fault diagnosis is based on wavelet packet decomposition and machine learning. Moreover, the vibration signal is decomposed into different frequencies bands with WPT. The decomposition at each level provides a set of sub-bands that allows us capturing specific frequencies components of the signal. From the time domain, relevant features are extracted from each sub-band to capture the fault characteristics at different frequencies ranges. Furthermore, the extracted features are then used as inputs to the machine learning algorithm to train the different classifiers to build the model for defective bearing classification in the gearbox.
The obtained results from the random forest (RF), decision tree (DT), and ensemble tree (ET) classifiers show that the approach is highly sensitive and efficient method for locating and differentiating defective bearings in gearbox systems. The classifiers enhance the accuracy in identifying the faulty bearings. This approach can help modern industries to diagnose the gearbox system and enable timely maintenance, and reduce the risk of catastrophic failure.
Footnotes
Handling Editor: Chenhui Liang
Declaration of conflicting interests
The author(s) declared no potential conflicts of interest with respect to the research, authorship, and/or publication of this article.
Funding
The author(s) received no financial support for the research, authorship, and/or publication of this article.