
Abstract
The valve positioner is an important supporting component of the regulating valve. The pilot valve is a crucial component of the valve positioner, and its major job is to reverse the gas route. The current lack of efficient solutions for internal pilot valve blockage is due to the unavoidable oil loss inside the positioner and the simple entry of external dust and other contaminants into the valve, resulting in oil blockage inside the pilot valve. The fault tree theory is utilized in this study to evaluate the reason of the pilot valve blockage problem, and it is coupled with 39 engineering factors in TRIZ theory to innovate the internal structure of the pilot valve using a contradiction matrix and 40 invention principles. The product’s dependability was then confirmed by fluid analysis using Ansys fluent.
Introduction
Overview
The regulator’s valve positioner is a crucial auxiliary part. It works in tandem with the actuator to increase the linearity of the regulator opening, remove valve stem friction, balance the regulator’s unbalanced force, and make sure the output signal is precisely output in accordance with the regulator’s given signal. 1 The primary purpose of the pilot valve, which is a crucial part of the valve positioner, is to carry out the gas path reversal by supplying gas to one cylinder while releasing gas from another cylinder to activate the actuator. The actuator drives the valve to move in one of two directions: closing or opening. The pilot valve modifies the air pressure output from the positioner to the valve actuator and outputs various air pressure values to out1 and out2 to create a pressure difference between the two chambers of the actuator.
Reasons for the blockage of existing pilot valve holes
Inside the valve positioner, oil leakage is unavoidable. Due to the challenging working conditions, it is simple for dust and other pollutants to enter the positioner, which sticks to the lubricating oil’s surface to produce oil. The inside components of the pilot valve have a tiny opening for gas passage, as seen in Figure 1. The air flow is blocked by the oil pollution that has built up in the valve and is linked to the tiny hole.

Schematic diagram of small holes inside pilot valve.
When this component breaks down, it is simple to get the valve stuck in the open or closed position and unable to work, which makes the pilot valve blockage phenomena simple to happen. It is simple for water or other contaminants in the air source to build up in the valve and form a blockage, which prevents the positioner from operating correctly.
Existing solutions
Currently, businesses have access to the following methods for clearing a blocked pilot valve: Clean the pilot valve, remove the pilot valve from the positioner, clean the valve body and valve core with a cleaning solution or solvent, and remove the obstruction; If the pilot valve’s seals are worn out or broken, replacing the seals might result in blockage. Currently, a fresh seal must be installed; Verify the hydraulic oil’s quality. The pilot valve may clog if the hydraulic oil has impurities or pollutants in it. Regularly check the hydraulic oil’s quality and replenish it as needed. In some cases, the failure of other hydraulic system components results in the pilot valve becoming blocked. Check these other components. Verify the functionality of additional hydraulic system components, including oil pumps, tubing, etc.; High-pressure gas purging is a simple procedure, but because of the strong oil adhesion and ease with which the precision valve components can be damaged, it is difficult to achieve the desired dredging effect. If the above procedure is unsuccessful, a new pilot valve must be installed.
Modth
Fault tree (FAT) analysis of pilot valve clogging
Event tree analysis is a deductive logical analysis technique that identifies the direct and secondary causes of accidents as well as their interactions. 2 It describes the dynamic process of accident occurrence and evolution. Utilizing an accident tree analysis involves gaining a deeper understanding of the system, figuring out the internal relationships between different system components, determining the ways and extents to which various potential factors can influence the likelihood of accidents occurring, and looking for ways to mitigate the effects. 3
Establishment of accident tree
The meanings of symbols in the Figure 2 are shown in Table l.

Pilot valve clogging accident tree.
Meaning of accident tree symbols.

Qualitative analysis of accident tree
The set with the smallest number of fundamental events that can result in the occurrence of the top event is referred to as the minimum cut set. It shows which fundamental occurrences take place simultaneously and can lead to the occurrence of the top event. The phrase “minimum path set” refers to the set of the bare minimum of fundamental events that can prevent the occurrence of the top event. It denotes the accident mode that, if the fundamental events do not take place simultaneously, can prevent the top event from occurring. 4
Using Boolean algebra, the accident tree above can be made simpler:

Eighteen kinds of minimum cut sets are obtained: see Table 2.
Table of all minimum cut sets.

The accident tree’s minimal cut set is 18, per the Boolean algebra rule for simplification. The filling pipeline clogging accident tree becomes a success tree when “and gate” and “or gate” are switched, and the minimum path set of the success tree is the same as the minimum cut set of the pilot valve clogging accident tree.
The success tree’s minimal set is resolved as follows:

By expanding the above formula, the smallest set of the pilot valve clogging success tree is obtained:

Structural importance analysis of basic events
The structural importance analysis examines the level of the primary event’s influence on the secondary event. The order of the structural importance of the basic event can be more precisely determined using the structural importance coefficient of the basic event. The structural significance of the incident is often assessed using the minimal cut set or minimum path set of the accident tree.
If fundamental event Xi’s cut set importance coefficient is I k (i), then:

Where k is the number of minimum cut sets; E r is the RTH smallest cut set, r = 1, 2, … k; m r is the RTH smallest cut set E r meaning the number of basic events.
After analyzing the 18 minimum cut sets of the pilot valve clogging accident tree, the structural importance order of the fundamental events was determined:

Cause analysis of pilot valve clogging accident
A potential top event is represented by each little cut set. The two most significant causes of pilot valve clogging accidents can be determined by combining the problem structure importance analysis and accident tree event analysis discussed above:
(1) The pilot valve’s little hole aperture is too small, creating a narrow internal pipeline that is simple to clog with oil when the accumulation is significant. The pilot valve has more small holes than other valves since it is made up of more parts; as a result, the smaller holes in the pilot valve must be screened, and those with larger apertures must be filled in. The types and precise dimensions of pilot valve holes are listed below. Figure 3 depicts a schematic of the small hole’s inner diameter, while Table 3 provides data on the aperture.

Schematic diagram of the inner diameter of the hole.
Aperture data.

The preceding chart shows that there is no obstruction in the reproduction practice’s little hole with a huge diameter. When the holes that do not penetrate the parts are discharged, the hole aperture that actually causes blockage is often a 2 mm hole, and the holes that potentially cause blockage may be 4, 5, 7, and 10.
(2) The material’s surface roughness is larger due to the small hole’s low processing precision, which raises the contact friction between the obstruction and the pipeline’s inner wall and makes it more challenging to dredge the oil.
The small hole’s inner surface roughness and processing accuracy are related, so as processing accuracy improves, production costs climb along with it, increasing the need for manufacturing equipment for the business. The internal aperture and structure of pilot valve holes will be improved in this study.
Small hole improvement of pilot valve based on technical contradiction
Technological contradiction is the term used to describe a conflict between two factors in a technological system that limit one another. Contradiction between distinct parameters of the same system occurs when certain system parameters are enhanced using accepted ideas and techniques, while other system parameters worsen. 5 He discovered that 40 principles of innovation could resolve the majority of the technical paradoxes in engineering, and that 39 engineering characteristics were adequate to characterize them. Figure 4 illustrates the TRIZ theory’s approach for solving problems using contradiction analysis.
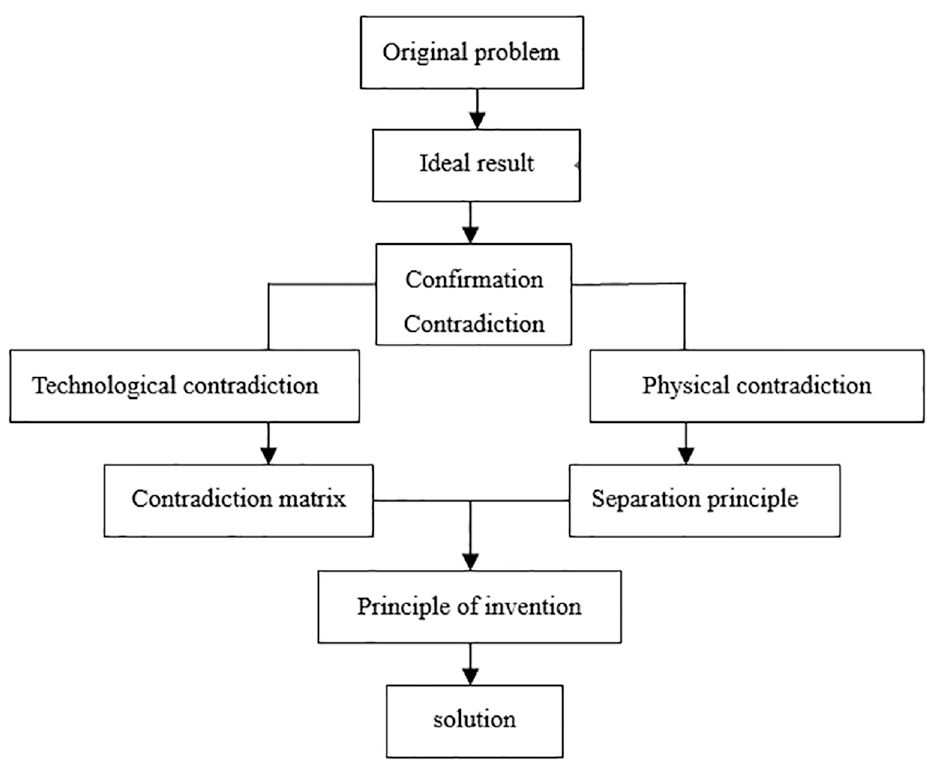
Problem solving flow chart of TRIZ theory contradiction matrix.
Current problem analysis
The positioner’s airflow transmission mechanism is shown by the tiny hole inside the pilot valve. It is simple to block the positioner during operation because of its narrow aperture. The following are the key causes: Before passing through the pilot valve, the internal air flow of the valve positioner must pass via the filter pressure lowering valve. To provide lubrication, the filter pressure lowering valve requires lubricating oil atomization to generate an oil mist. Although the majority of the oil can be filtered within, a tiny quantity of oil and water will unavoidably pass through the filter pressure lowering valve and be conveyed to the pilot valve via the air channel, and a small amount of oil and water will be attached to the pilot valve inside the small hole. The position of the valve positioner during installation is relatively fixed, but if dust or other impurities are present, they can enter the positioner through small holes in the pilot valve’s internal shell or through the air source output air flow. If there is oil and water present in the hole, the dust will become attached to the formation of oil, and if the oil accumulation is significant, it will cause the hole to become larger.
Increased aperture of the small hole cannot be used as a solution to the blockage issue because the valve positioner is a relatively precise control device, and the aperture of the small hole inside the pilot valve is a fixed value. Changing the aperture of the small hole will result in changes in the positioner’s control flow, which will reduce the control accuracy.
As shown in Table 4, the internal pipeline structure of the pilot valve small hole is altered under the assumption that the minimum aperture of the small hole will remain unchanged in order to achieve the goal of preventing clogging, which can be viewed as improving the parameters of shape (12) and degrading the parameters of reliability (27), manufacturing accuracy (28), and manufacturability (32).
Pilot valve hole innovation design contradiction matrix.
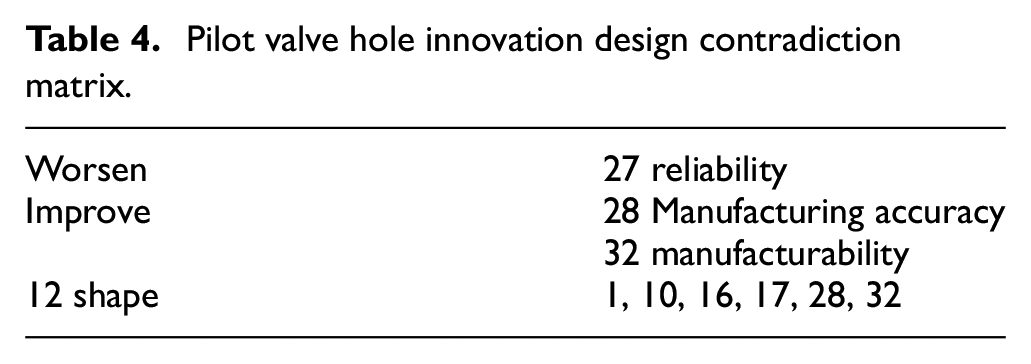
The following inventive concepts can be derived from the contradiction matrix: 1 Segmentation, 10 pretreatment, 16 unfulfilled or surpassed role, 17 dimensional change, 28 mechanical system substitution, 32 color change, and 1 segmentation are some examples.
Analysis of the obtained invention principle article by article
Article 1. Segmentation. Increase the degree of independence between items by dividing an object into independent sections or into parts that are simpler to assemble and disassemble.
Article 10. Pretreatment. To produce the desired change in part or in whole of the object before operation; Objects are specially arranged in advance so that they are ready in time, or in a position that is easy to manipulate.
Article 16. A role not met or exceeded. If achieving exactly the desired effect is difficult, slightly underachieving or slightly exceeding the desired effect will greatly simplify the problem.
Article 17. Dimension change. Change a moving or stationary object in one dimensional space into a moving or stationary object in two dimensional space, and a moving or stationary object in two dimensional space into a moving or stationary object in three dimensional space; Replace single-layer objects with multi-layer objects.
Article 28. Mechanical system replacement. Replacing mechanical systems with visual, auditory, and olfactory systems; Use electric, magnetic, and electromagnetic field interactions to complete the interaction with the object; Change the fixed field into a moving field and the static field into a dynamic field.
Article 32. Change the color. Changing the color of an object or environment or its external environment; Changing the transparency of an object, or changing the visibility of a process.
Analysis of innovation points in this experiment:
The pilot valve hole is a small internal structure that cannot be easily divided, and its sole function is to conduct air flow. Dividing it into multiple systems would increase processing difficulty and compromise its original function. Adopting a segmentation principle would also raise manufacturing difficulty and production cost, making it impractical for enterprise production practices. Furthermore, achieving the desired anti-blocking effect may not be guaranteed. If oil accumulates in the pilot valve hole without achieving the intended blockage effect, over time it will eventually lead to blockage. Therefore, proposing a solution based on an unreached or exceeded action principle is not feasible. Revised sentence: Apply Invention Principle 10, which offers two solutions to address the current issue. Firstly, locally enhance the internal structure of the small hole in the pilot valve by measuring and analyzing each small hole’s values. Modify one of its structures to create an internal small hole structure that is less prone to blockage. Alternatively, install a gas pretreatment device outside the pilot valve to preprocess the gas flowing through it and prevent external impurities from entering, thus achieving a protective effect. Based on this analysis, this chapter ultimately adopts Invention Principle 10 – pretreatment for enhancing the pilot valve.
Pilot valve small hole anti-clogging scheme design
Solution 1: Pre-filter device for pilot valve
The addition of a filter device to the main gas pipeline, as shown in Figure 5, removes water from the gas through a two-stage filter and collects oil, dust, and other obstructions in the pipeline through a centrifugal mechanism in the filter cartridge before centrally discharging them. This significantly extends the life of the pilot valve diaphragm and allows for filter device repair rather than complete replacement. has no impact on the pilot valve, making sure that the gas is filtered before it enters the pilot valve.
Filter device.
According to Figure 5, the pilot valve is equipped with a filter valve device. The filter valve device is made up of a shell, a filter screen, a filter element, and a centrifugal mechanism. The device and the pilot valve device work together as a whole to filter out impurities in the gas and prevent them from adhering to the pilot valve inside.
In Figure 6, the filter device’s assembly diagram is displayed. The major components of the device are three, and the filter device’s central cuboid structure is its principal mechanism. An inlet and an outlet are located at the top and bottom of the mechanism’s body, respectively. A layer of filter screen is fitted at the inlet, serving as the filter device’s main filter. The filter device’s secondary filter is a centrifugal mechanism set up in the interior cavity of the shell. To give power for its centrifugal action, the centrifugal mechanism is coupled to a motor. The shell’s side features a transparent glass through which one can see the filter device’s operational state when it is in use. The bottom of the shell serves as the discharge outlet, where solid and fluid impurities are collected and discharged after exiting the filter valve. The top is a collecting device that collects and stores solid impurities after centrifugal movement. After installing the control switch, connect the power source outside the housing.

Assembly diagram.
Scheme 2: Improvement of small-hole pipeline based on Venturi effect pilot valve
The phenomenon known as the Venturi effect is when a limited flow passes through a decreased flow section and causes the flow rate or flow rate of the fluid to rise. The flow rate is inversely proportional to the flow section. Bernoulli’s law states that a reduction in fluid pressure occurs as flow velocity increases. 6 The result of employing a local low pressure zone created by a fluid traveling at a fast speed to pump fluid from a region of higher pressure into a region of local low pressure. According to Figure 7.

Diagram of Venturi principle effect.
According to fluid mechanics, the fluid continuity equation is:

in an ideal condition.
A1 and A2 in formula (1) stand for the pipeline circulation area m2 and v1 and v2 are fluid velocities in m/s.
The Bernoulli equation for continuous fluid flow on the same horizontal plane is:

According to the law of conservation of energy, without taking into account the heat loss resulting from heat transfer and the frictional pressure loss during gas flow.
P1 and P2 in formula (2) represent the fluid pressure Pa at the relevant section, and kg/m3 stands for the fluid density.
The flow velocity rises as the cross-sectional area of the fluid flowing through the channel decreases, as shown by equations (1) and (2). The total pressure of a fluid, which is the sum of its static and dynamic pressure, doesn’t vary, according to Bernoulli’s principle. The fluid will experience a fall in static pressure as the flow velocity rises, which will cause a fast drop in pressure. When the flow rate hits a specific level, the pressure becomes negative and below atmospheric pressure, creating a suction. This suction is then used in manufacturing to remove obstructions.
Using the Venturi effect, design pilot valve holes of various lengths: The little hole’s equivalent length varies as a result of the pilot valve’s interior components’ various thicknesses. The pilot valve was disassembled and measured; the length of the tiny hole was divided into segments of 2, 6, and 8 mm, and the diameter of the small hole was 2 mm. This paper will enhance the 6 and 8 mm holes since the 2 mm holes are difficult to fill.
In this experiment, different numerical values will be employed for small holes of various lengths to verify simulation results for the contraction section, throat, and diffusion section. The following is the numerical selection method: the length of the contraction exceeds the width of the throat; (a) The length of the contraction is the same as the length of the throat; (b) The length of the contraction is shorter than the throat. As the ideal solution interval for this experiment, the structural value of the maximum pressure in the neck, contraction section, and diffusion section was chosen.
The Venturi tube is a rotationally symmetric structure, and two-dimensional modeling may be used to create its concept diagram. In this research, it is modeled using CAD and may be used as a calculation model to choose half of the Venturi tube’s axial section along the symmetry axis.
(a) Improved 8 mm tiny hole design
Figure 8 depicts the geometric model of a venturi tube with an 8 mm-long tiny hole. The measurements of the structure are as follows:
(1) The pipe diameter is 6 mm, the throat diameter is 2 mm, the throat length is 1.5 mm, the contraction length is 2.5 mm, and the expansion length is 4 mm.
(2) Pipe diameter is 6 mm, throat diameter is 2 mm, throat length is 2 mm, contraction length is 2 mm, expansion length is 4 mm.
(3) The pipe diameter is 6 mm, the throat diameter is 2 mm, the throat length is 2.5 mm, the contraction length is 1.5 mm, and the expansion length is 4 mm.
(b) 6 mm small hole improvement design

Structure diagram of Venturi tube with 8 mm small hole.
Figure 9 depicts the geometric model of a venturi tube for tiny holes with a length of 6 mm. The measurements of the structure are as follows:
(1) Pipe diameter is 6 mm, throat diameter is 2 mm, throat length is 2 mm, contraction length is 1 mm, expansion length is 3 mm.
(2) The pipe diameter is 6 mm, the throat diameter is 2 mm, the throat length is 1.5 mm, the contraction length is 1.5 mm, and the expansion length is 3 mm.
(3) Pipe diameter is 6 mm, throat diameter is 2 mm, throat length is 1 mm, contraction length is 2 mm, expansion length is 3 mm.

Structure diagram of Venturi tube with 6 mm small hole.
Final solution selection
Because of the limited internal space of the positioner and the large space occupied by the filter, it is necessary to improve the positioner housing before installation, which increases the production cost of the equipment, and the filter screen needs to be replaced on a regular basis, making it difficult to install the filter device outside the pilot valve; the parts mechanism with small holes in the pilot valve is simple, easy to improve, high reliability, and requires only a minor change to the original st The construction of the pilot valve in the second scheme is constructed in an original manner in this study.
Simulation analysis based on ANSYS
The pathology of pilot valve failure is the pathology that guides the physical, chemical, mechanical, electrical, or human causes of pilot valve failure and their causation. There are numerous examples of valve failure mode analysis at the moment, but few investigations on the reason of pilot valve failure. The study of pilot valve fault mechanism necessitates extensive fundamental theoretical research as well as engineering practical data support. In general, the basic mathematical model of fault mechanism must be established, and it must be modified and improved using real fault data. Because it is nearly impossible to gather comprehensive fault data of all types of valves due to the broad diversity of valves and considerable variances in operating circumstances, simulation is an excellent technique of analyzing the failure mechanism of pilot valves. 7
ANSYS FLUENT software is used in this article to simulate pilot valve tiny hole research. ANSYS Fluent is suited for modeling complicated incompressible and compressible fluid flows. The parallel solver in ANSYS Fluent allows you to calculate solutions for instances with very large grids on several processors, whether on the same computer or on machines in a network. ANSYS also provides various techniques for dealing with diverse flow regimes and employing different physical models. 8
Establishment of simulation model
The entire simulation procedure is as follows:
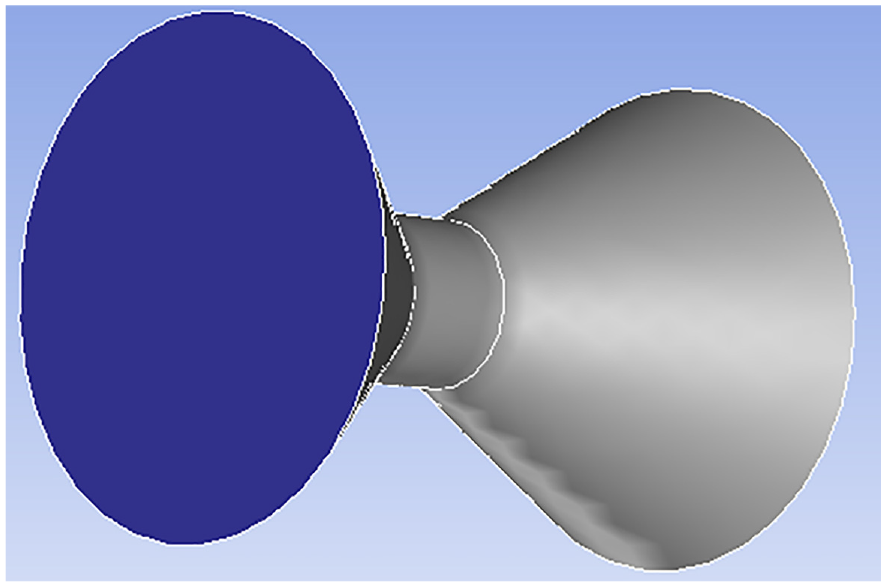
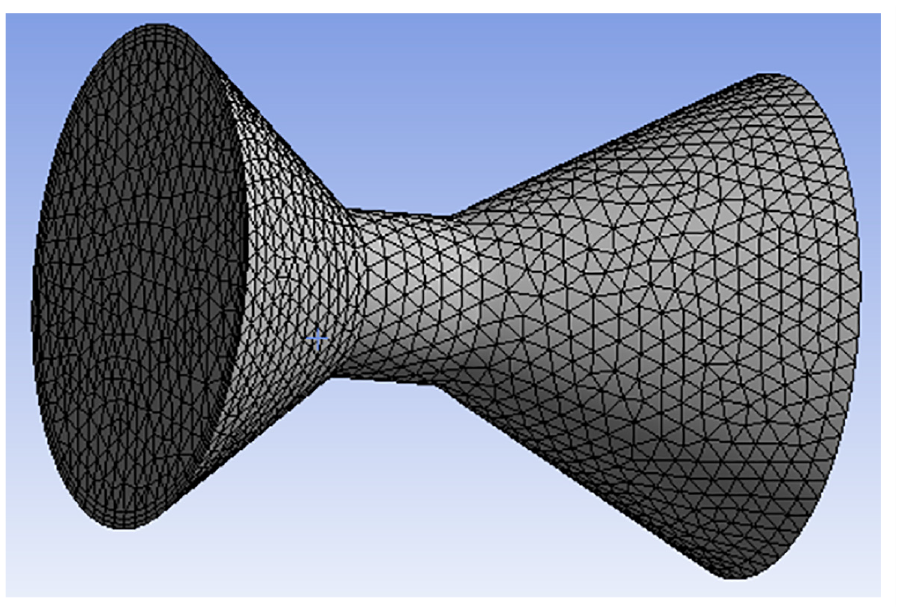
(1) SolidWorks was used to create pilot valve 8 and 6 mm small hole models, with the following dimensions: 8 mm small hole, large diameter D is 6 mm, small diameter d is 2 mm, throat length is 1.5 mm, contraction length is 2.5 mm, expansion length is 4 mm; 6 mm small hole, large diameter D is 6 mm, small diameter d is 2 mm, throat length is 1 mm, contraction length is 2 mm, expansion length is 3 mm. Figure 10 depicts the finished model profile.
(2) Fluid domain determination: The file format of the solid works model was saved as x-t type, and the fluent module was loaded in workbench. The volume extraction function was employed to create the pilot valve pore fluid domain model, and the outside wall area of the pilot valve pore was chosen to execute physical inhibition. Finally, a comprehensive pilot valve pore basin model was obtained. As seen in Figure 11.
(3) Load calculation and application method: The pressure output of the air pump received by the valve positioner varies from 2 to 12 kg, with a typical output pressure of 3–6 kg. It is assumed that the pressure received by the little hole in the simulation is constant and unaltered. In this experiment, the pressure received by the little hole of the pilot valve is proposed to be 4 kg, and the receiving surface is the top portion at the contraction port, as illustrated in Figure 12.

Schematic diagram of the pilot valve hole geometry model.

Orifice fluid domain model of pilot valve.
Schematic diagram of pressure receiving surface.
Grid division
Name selection
Select intake as the port in the pilot valve’s tiny hole contraction portion, outlet as the port in the expansion section, wall as the outside side, and fluid as the inner region of the wall.
Flow field inlet: Total pressure, flow rate, and fluid direction must be sent to the input and outflow. Because the valve positioner’s air source is the air pump’s supplied pressure input, a mass intake is required.
Flow field outlet: Boundary conditions, such as pressure, must be provided at the flow outlet’s boundary; in this study, the pressure output is utilized to calculate the outlet’s static pressure.
Roughness selection for the solid wall: pilot valve as a more accurate positioner device, its processing accuracy is excellent, roughness selection is 0.3.
Add a boundary layer and configure its characteristics
When the fluid flows at a high Reynolds number around a solid wall, the viscous force is significantly lower than the inertial force at a distance from the solid wall, which may be ignored. However, the impact of viscous force cannot be ignored at the thin layer near the solid wall. The boundary layer is defined by a significant velocity gradient along the normal direction of the wall.
Fluent mesh division frequently calls for the boundary layer to be fine-tuned, and since the mesh density there is finer than it is elsewhere, the inflation approach may be applied.
Solution: The fluid barrier should have three to five layers of inflation (boundary layer). The boundary layer number is suggested to be 3, due to the tiny inner diameter of pilot valve holes.
Grid creation and assurance of independence
The quality of grid division has an impact on the numerical simulation’s quality. The mesh density rises as a result of grid division, and the simulation data becomes more precise. The default mesh division is first utilized to mimic during the procedure. The mesh size is split more finely when there is a significant departure from the predicted value in the simulation result. The thickness of the grid division affects how quickly the solver completes a problem. The more time the solver requires to solve a finer grid, the more complex the hardware configuration is required. The grid quality is further enhanced when the grid quality criteria are reached, which has no noticeable effect on the calculation results but influences the calculation speed. 9 The calculation results of the structured grid and unstructured grid are identical when the grid quality requirements are met.
Verifying the independence of the grid and the independence of the step size is also important for meshing the tiny hole flow field within the pilot valve. Figure 13 depicts the technique for confirming independence.

Grid independence verification of pilot valve orifice fluid domain.
Division of mesh quality
Typically, the following three mesh quality are chosen for fluid simulation:
Triangular or quadrilateral mesh quality is frequently assessed using the aspect ratio. Ten allows for a 100 relaxation of the boundary layer.
Skewness One important parameter for mesh metrics is skewness slope/skewness (0–1). An increased value denotes a lower mesh quality. By default, meshing demands the greatest bias slope 0.90.
Orthogonal character Orthogonal quality (0–1) is used to assess the grid’s orthogonal quality. The grid quality increases with increasing value. Fluent defaults to an orthogonal quality requirement of 0.01.
In the simulation process, it is found that the maximum slope of the pinhole model is 0.78, which is less than the default maximum slope requirement of 0.90. Therefore, Skewness is selected to divide the mesh quality and finally generate the grid diagram of the pinhole model, as shown in Figure 14.
Grid generation diagram.
Result analysis
The convergence of the numerical findings
The fluid domain of the pilot valve hole’s calculation results will be impacted by the convergence of the calculation findings. It cannot be computed in the following step if the calculation results are not convergent since the outcomes of the calculation are likewise incorrect. As a result, the convergence standard is a crucial indication to evaluate the precision of the computation results.
1. Residual monitoring chart
A common indicator to determine the likelihood of convergence is the residual curve. We must select a value that satisfies the convergence requirements prior to iteratively computing the residual curve’s output. After performing the repeated computation, the residual curve output is next scrutinized to see whether the data has reached the predetermined value. Following the repeated computation, the calculation converges if it achieves the value we set beforehand; otherwise, it does not converge and the subsequent flow field calculation cannot be performed. 10
2. Determine if convergence
In addition to watching if the final value satisfies the requirements, one should also keep an eye on how the value has changed over time. If the iterative computation terminates and the result converges, the value does not change. The aforementioned signs are simpler to spot, and convergence may be confirmed simply by observing if the value changes.
3. The final technique relies on the final report rather than the residual plot to assess convergence. The system will automatically prepare a report at the conclusion of each loop, and the report will show any data errors. If it complies, it can be deemed to have reached convergence and the calculation is finished.
The report following the conclusion of the iteration is used in this research as the benchmark for the convergence of the calculation results, and the convergence outcomes are displayed in Figure 15.

Convergence diagram.
Examination of simulation results
In this study, fluent software is used to post-process the orifice fluid domain of a pilot valve, and the simulation results’ pressure cloud diagram, velocity vector diagram, and pressure curve are generated.
Different colors in the static pressure cloud image correspond to different pressure values, which are proportional to the spectral wavelength (the pressure values gradually decrease in the order of colors such as red, orange, yellow, green, and blue, etc.). Red denotes large pressure values, and blue denotes small pressure values. 11 Different colors in the velocity vector diagram denote different velocities, and the velocities are related to the spectral wavelength, with red denoting high velocities and blue denoting low velocities.
After analyzing Figures 16 and 17, it is evident that the pressure and flow velocity largely consistent following the two improvements. In the pressure cloud image, a greater spectral wavelength is observed at both the contraction section and diffusion section compared to the throat, indicating higher pressures in these sections. The pressure distribution in the diffusion section of the 6 mm venturi tube is slightly lower than that of the 8 mm Venturi tube’s diffusion section. In the velocity vector diagram, a smaller spectral wavelength can be observed at both the contraction section and diffusion section compared to the throat, suggesting lower gas flow velocities in these areas as well. Moving from the contraction section toward the throat, due to gradual reduction in cross-sectional area, gas flow rate gradually increases while internal pipeline pressure decreases. The smallest cross-section at throat corresponds to highest gas flow rate and lowest pressure. From throat through diffusion section, flow rate decreases while pressure gradually increases until reaching stable outlet pressure.

Pressure distribution of the orifice pipe of the new pilot valve: (a) small hole pressure cloud image of 8 mm pilot valve and (b) small hole pressure cloud image of 6 mm pilot valve.
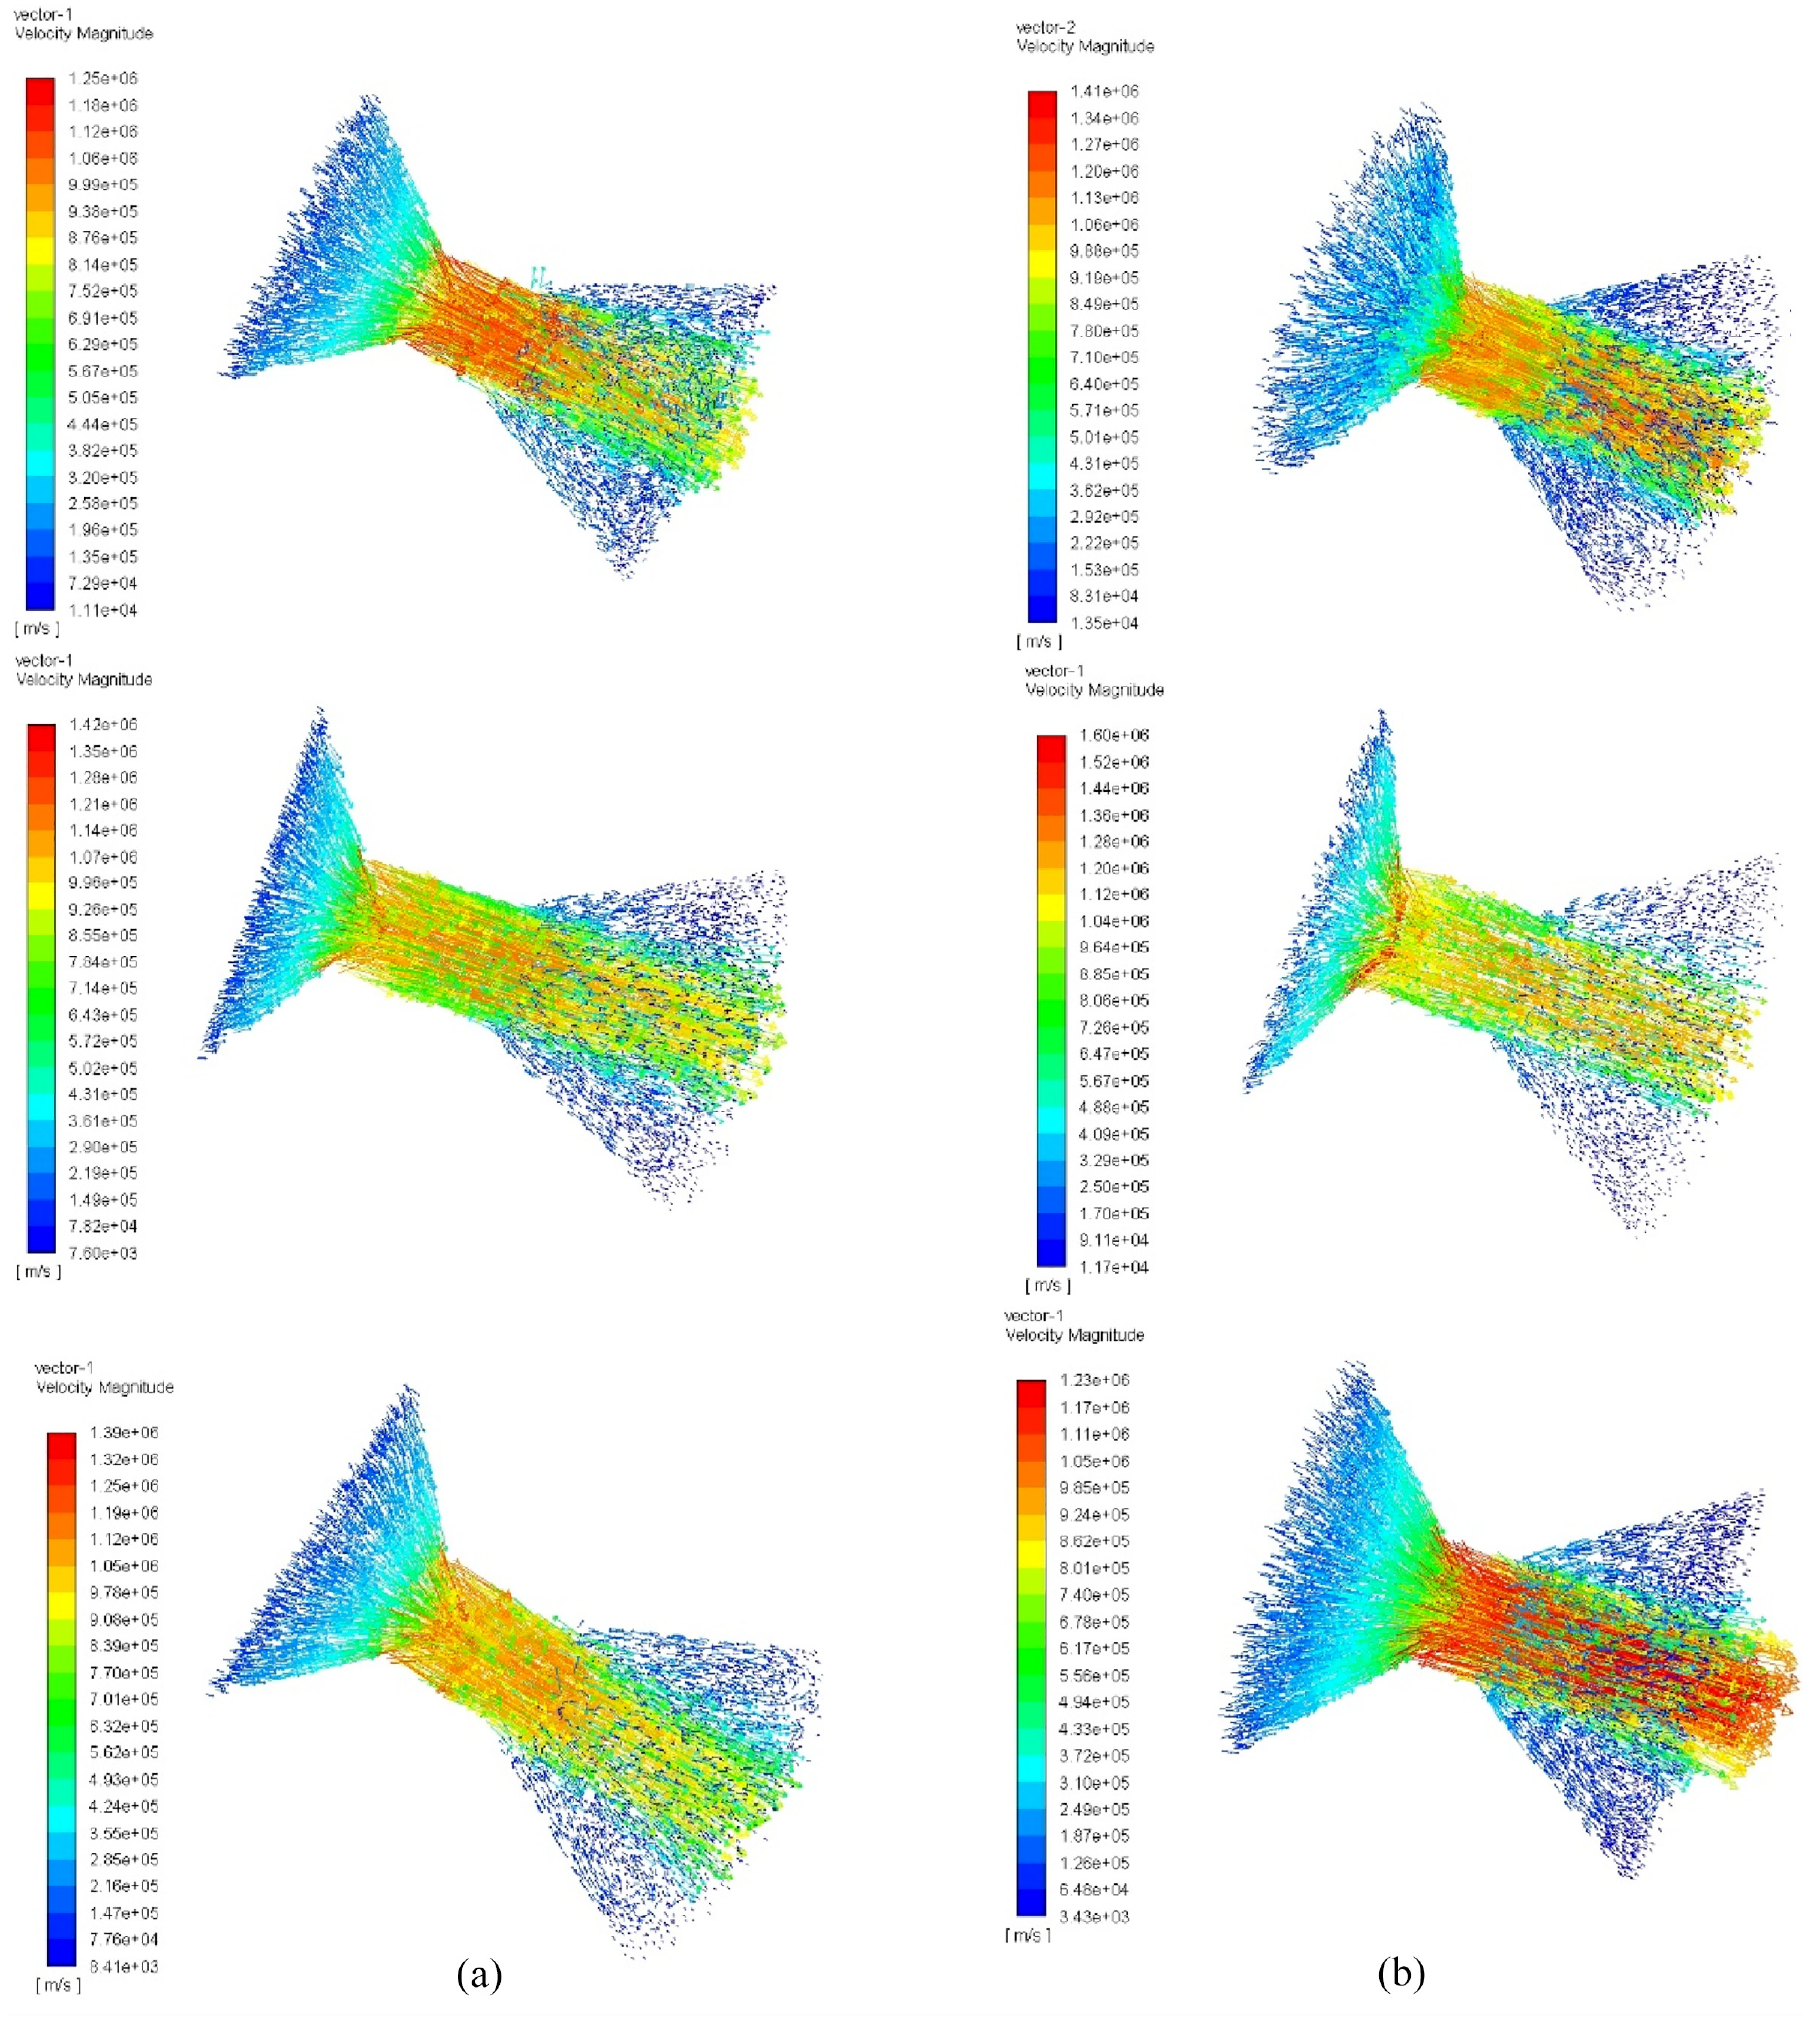
Velocity vector diagram of small orifice tube of new pilot valve: (a) 8 mm pilot valve orifice velocity vector and (b) 6 mm pilot valve orifice velocity vector.
The Venturi tube’s fluid domain pressure curve is shown in Figure 18. As seen in Figure 18, when the valve positioner operates normally, the fluid pressure rapidly decreases, reaches its lowest point in the throat section, gradually rises in the diffusion section, and then reaches the outlet position where the pressure is stable, and the distribution law is consistent with the above pressure cloud diagram.

Pressure curve of orifice fluid domain of new pilot valve: (a) fluid domain pressure curve of 8 mm Venturi tube and (b) fluid domain pressure curve of 6 mm Venturi tube.
The values from the above pressure cloud map were summarized in the pressure difference table, as shown in Table 5, to help choose the best structural value interval for pilot valve holes. The ideal interval of the value of pilot valve holes was then selected by computing the pressure difference value of each interval.
Differential pressure table.

By comparing the values in Table 5, it can be observed that in the pilot valve orifice-length 8 mm scheme, the length of the contraction section is smaller than that of the throat (with a contraction section length of 1.5 mm and a throat length of 2.5 mm), while the diffusion section is 4 mm. This scheme exhibits a higher pressure difference compared to the other two schemes where either the contraction section length equals or exceeds that of the throat. Similarly, consistent results are obtained for the pressure difference observed in the pilot valve orifice-length 6 mm scheme, where again, when the contraction section length is less than that of the throat (with a contraction section length of 1 mm, a throat length of 2 mm, and a diffusion section length of 3 mm), there exists an elevated pressure difference compared to other schemes. Therefore, achieving optimal anti-clogging effect the inner shrinkage section’s length in pilot valve hole remains smaller than that of its corresponding throat.
The ideal solution interval for the two pilot valve holes was finally determined to be 4 mm for the 1.5 mm throat contraction portion in the 8 mm scheme and 3 mm for the 2 mm throat diffusion section in the 6 mm scheme.
Conclusion
(1) The accident tree analysis technique in safety system engineering is used to create the pilot valvehole blockage accident tree model and carryout a thorough qualitative and quantitative analysis after analyzing the various causes and processes of pilot valve hole blockage. According to the accident tree structure, there are more “or doors” than “and doors,” but three “and doors” relations account for the majority of the blockage, showing that the pilot valve hole is simple to block when the small-hole pipeline structure is irrational, oil leakage, and dust adhesion in the valve exist simultaneously. The accident tree’s minimal cut set demonstrates that there are more methods to induce blockage than to prevent it. The best option is to enhance the internal structure of the pilot valve when external environmental elements are discharged as well as the unavoidable oil leaks in the valve. The structural importance analysis shows that the priority order of plugging prevention and control of filling pipeline can be determined according to the order of structural importance, providing a solid theoretical foundation and allowing for more focused prevention and control countermeasures.
(2) Using the innovation concept in TRIZ, an anti-clogging pilot valve hole is created on the basis of a thorough investigation of the existing pilot valve holes. The TRIZ conflict matrix offers recommendations for the hole’s design. The paradoxical matrix, which is made up of 39 engineering parameters and 40 invention principles, is used to optimize and innovate the small-hole pipeline structure, which can effectively improve the airflow path and maintain the normal operation of equipment. The paradoxical matrix is applied to analyze the practical problems that exist in the small-hole structure of the pilot valve. Use a basic and dependable design wherever feasible to accomplish functionality, provided that the issues present in the actual production process are properly taken into account.
(3) When used in conjunction with ANSYS FLUENT, fluid analysis of the pilot valve orifice may examine the pressure and velocity variations in the fluid domain inside the orifice pipeline and give data support and a theoretical framework for real-world engineering applications. The needed pressure cloud map, velocity vector diagram, and pressure curve are produced once the numerical simulation is completed, providing a crucial theoretical foundation for the new pilot valve orifice’s capacity to prevent clogging. According to the simulation experiment, the length of the throat and the shrinking section cannot be compared to determine the best design value range because the shrinking section’s change length is shorter than the throat’s, the pilot valve hole reaches the maximum pressure difference, and the anti-clogging effect is best.
Footnotes
Handling Editor: Chenhui Liang
Declaration of conflicting interests
The author(s) declared no potential conflicts of interest with respect to the research, authorship, and/or publication of this article.
Funding
The author(s) received no financial support for the research, authorship, and/or publication of this article.