
Abstract
Improving gear precision and achieving green sustainability in gear machining are two important aspects of the gear manufacturing process. However, to achieve these two goals simultaneously, it may be necessary to make trade-offs when selecting the gear processing parameters. In this work, both energy consumption and gear geometric deviations were considered simultaneously to optimize the hobbing parameters. The relationships between the hobbing parameters, energy consumption, and gear geometric deviations were modeled using the response surface method (RSM). The statistical significance of the model was tested using analysis of variance (ANOVA). An improved multi-objective particle swarm optimization (IMOPSO) was then performed to solve optimization problems that involved multiple and conflicting objectives in the hobbing process. The results obtained indicate that both the energy consumption (E) and the gear geometric deviations are parameter-dependent. The feed rate (f) and the spindle speed (n) have opposing effects on both energy consumption E and the gear geometric deviations. The optimum hobbing parameter sets obtained from the calculated Pareto frontier can provide a feasible solution for manufacturers to solve the trade-off problems that occur in the hobbing process, and the experimental results confirmed the effectiveness of the IMOPSO approach.
Keywords
Introduction
As a result of the rapid developments in the medical equipment, automotive, wind power, aerospace, and other industrial sectors, the demand for gears is increasing sharply. The output value of the Chinese gear industry was more than US$34 billion in 2018. The gear industry accounts for the largest proportion of China’s basic machine parts industry. As an efficient and low-cost tooth-making process, hobbing is used widely in the gear making industry. In some countries, hobbing machines account for 45% to 50% of all gear manufacturing machines. In the automotive production field in particular, hobbing constitutes approximately 70% of the automotive gear machining process. 1 However, the fast growth of the gear manufacturing industry has inevitably led to increased energy consumption and has caused environmental issues. Reduction of overall energy consumption has been recognized as an effective way to achieve sustainable development. 2 If it was possible to minimize energy usage, then the environmental impact from energy generation would be reduced. 3 However, blind pursuit of the minimization of energy consumption alone may lead to rough surfaces and low precision. Under these circumstances, the workpiece may be scrapped and may then need to be remade, which would result in increased material waste, energy losses, and environmental problems. Therefore, an optimal combination of appropriate energy consumption and gear geometric deviations is required to realize a sustainable hobbing process. The ability of a hobbing machine to produce the expected accuracy with minimal energy consumption depends on the processing parameters and the characteristics of the hobbing machine, the workpiece, and the hob. 4 The correlative dependence between the gear geometric deviations and the energy consumption of a hobbing machine is close. This closeness can be beneficial for accuracy improvement during the hobbing process if the hobbing precision can be enhanced to meet the requirements of specific gear types, e.g., the fine-pitch gears used for automotive steering pinions and the gears used in small reduction gearboxes. 5 Additionally, improving the accuracy of the hobbing process is quite meaningful because it can partially substitute for the grinding process or greatly reduce the gear grinding time and thus minimize the environmental impact of the process.
In general, the precision of hobbed gears is mainly affected by the hobbing machine, the hob cutter, and the hobbing processing technique. 5 There has been considerable research concentrated on these three factors. In terms of the hobbing machine, Bouzakis et al. 6 considered the hob teeth wear performance to optimize the shift displacement and the corresponding shift amount of the hob. Based on their finite element simulation results, Deng et al. 7 developed a force-induced error model for a dry hobbing machine and then studied the connection between gear accuracy and force-induced errors. Li et al. 8 developed a model of the coupling effect between thermal errors and force-induced errors and studied the effects of these errors on the hobbing accuracy based on simulations and field measurement methods. Yang et al. 9 investigated the effects of the vibration characteristics of the workpiece spindle on the hobbing accuracy. Hu et al. 10 established a multi-objective optimization model with the aim of balancing manufacturing costs with the overall accuracy of the hobbing machine, and they achieved ideal optimization results. For the geometric aspects of hob cutters, Chiu et al. 11 developed an experimental procedure to reduce gear tooth profile errors by adjusting the hob eccentricity. Radzevich et al. 12 developed a computational method for the parameter design of a hob with straight-line lateral cutting edges to enable manufacture of precise involute gears. Wang et al. 13 established a quantitative mapping relational model of the relationships among the hob helix error, the radial runout error of the hob installation angle, and the gear tooth profile error based on the principles of differential geometry and envelopes. Liang et al. 14 designed a novel hobbing cutter for involute-helix gears by using the normal sections of convex and concave tooth profiles. Janßen et al. 15 analyzed the influence of asymmetric tooth profiles on hob wear behavior, thus providing a reference work for hob design. With regard to the processing technique, Bouzakis et al. 16 generated a method to predict tool wear and optimize the cutting process. Brecher et al. 17 selected hobbing parameters using a gear machining simulation procedure. Sabkhi et al. 18 investigated the cutting edge effect and calculated the changeable cutting force in the hobbing finishing procedure using a coupled thermomechanical method. Sun et al. 5 proposed a model that combined the improved particle swarm optimization (IPSO) algorithm and the backpropagation (BP) algorithm to predict the hobbed gear geometric deviations. Kühn et al. 19 studied the effects of the cutting edge radius, the shape coefficient, and the preparation technology on hob wear, which provided principles by which hobbing technology could be improved.
The gear geometric deviations consist of the total deviation of the tooth profile (F α ), the total helical deviation (F β ), the single pitch deviation (f p ), and the accumulated pitch deviation (F p ) of the tooth surface (Figure 1). These factors all affect the transmission accuracy and the noise levels of geared transmission systems significantly. To improve hobbing accuracy and minimize energy consumption, when compared with hob cutter profile optimization and hobbing machine tool error compensation, it is easier to select appropriate values of processing parameters such as the feed rate f, the spindle speed n, and the depth of cut ap.

Schematic diagram illustrating the hobbing parameters and gear error terms. 5
Many researchers have tried to optimize the hobbing parameters and the energy consumption of hobbing machines. Sun et al. 5 selected the required hobbing parameters while predicting the gear geometric deviations, but they did not consider energy consumption. Cao et al. 20 developed a hybrid support vector machine/ant lion optimizer/gear hobbing algorithm to optimize the hobbing parameters for small-sample problems in mass production. Zhang et al. 21 established a model to optimize the hobbing parameters with the aim of improving the hobbing efficiency. Cai et al. 22 analyzed and compared the energy efficiencies of high-speed dry cutting and wet cutting types of computer numerical control (CNC) hobbing machines. Cao et al. 23 used k-means clustering and case clustering in combination with an analytic hierarchy process to optimize the hobbing parameters; this approach effectively solved the numerical fluctuation problem of the optimization results obtained when using conventional optimization methods. Using the multi-objective imperialist competitive algorithm (MOICA), Xiao et al. 24 proposed a multi-component energy model to optimize the machining parameters for a dry gear hobbing machine. Li et al. 25 developed an analytical model to analyze the thermal stability of the motorized spindle system (MSS) of a high-speed dry hobbing (HSDH) machine. Ni et al. 26 used the multi-objective grey Wolf algorithm to optimize hobbing parameters with required carbon footprints and manufacturing times as targets. Lv et al. 27 established a comprehensive optimization model of the hob displacement and the energy consumption of a hobbing unit, and realized energy savings and the hob displacement for this hobbing unit. At present, almost all research with regard to hobbing parameter optimization has been performed by splitting energy consumption and hobbing accuracy.
Recently, natural evolution algorithms have been used widely in the optimization of processing parameters because of their outstanding performance in solving complex, nonlinear, and multi-dimensional optimization problems. These techniques include particle swarm optimization (PSO), the artificial bee colony (ABC), ant colony optimization (ACO), genetic algorithms (GAs), teaching learning-based optimization (TLBO), and the non-dominated sorting genetic algorithm-II (NSGA-II). 28 Special attention has been paid to PSO because of its simple structure, small number of adjustment parameters, ease of implementation in engineering, and high optimization accuracy. Teimouri et al 29 used simulated annealing (SA) and PSO to maximize the percentage of surface roughness variation and select optimal process parameters for a magnetic abrasive finishing process, and their results indicated that SA and PSO could determine the optimal answers logically and with high precision. Chenthil et al. 30 optimized the processing parameters used in electrochemical machining through PSO. Singh et al. 31 used PSO and bacteria foraging optimization (BFO) to obtain the optimal processing parameters for milling of Inconel 718 alloy, and their results indicated that PSO was more effective. Vijayan et al. 32 used response surface method (RSM) hybrid PSO to optimize the parameters for drilling of carbon fiber-reinforced polymer (CFRP). Gupta et al. 33 optimized the processing parameters for machining of a nickel-based superalloy by combining PSO with TLBO. Yang et al. 34 used a group search PSO (GSPSO) algorithm based on window movement to optimize the feedrate curve and verified the effectiveness of their optimization algorithm on an open two-turntable five-axis machine tool.
The works discussed above demonstrate that researchers have made significant efforts to explore error analysis of hobbing machines, optimization of the hob cutter geometry, hobbing parameter optimization in terms of improved efficiency or cost, and research into hobbing machine energy consumption. However, very few of these previous studies have considered the influence of the machining parameters on gear geometric deviations. Research on simultaneous optimization of energy consumption and the gear geometric deviations has not been reported to date. Because high-precision gears play an important role in enabling high-end transmission systems to meet their requirements under extreme working conditions, reduction of energy consumption provides an important way to enhance the sustainability of the gear manufacturing process. To acquire the ideal overall processing effect, this paper aims to optimize the gear geometric deviations and the energy consumption of the gear hobbing process simultaneously. Because the conventional experimental methods intended to optimize the hobbing parameters are both cumbersome and costly, the complex, nonlinear, and stochastic relationships among the hobbing parameters, energy consumption, and the gear geometric deviations were modeled using the RSM. The statistical significance of the resulting models and the effects of the hobbing parameters on the response were tested using analysis of variance (ANOVA). Then, an improved multi-objective PSO (IMOPSO) was conducted to solve optimization problems for multiple and conflicting objectives during the hobbing process. The workflow and the methods used to perform this work are illustrated in Figure 2.

Workflow and methods used.
The remainder of this paper is organized as follows. Section 2 introduces the methods, materials, and equipment used in the experiments, the modeling processes, and optimization approaches in detail. The influence of the hobbing parameters on given responses, ANOVA testing, the multi-objective optimization results, and the confirmatory test results are then analyzed in Section 3. Finally, Section 4 summarizes the conclusions drawn from this work and discusses potential future work.
Method
Experiments
The experiments were conducted on a YS3150CNC6 hobbing machine. Gears made from 17CrNiMo6 were machined. Because factors such as hob wear, machine tool movement, and thermal errors could affect the precision of the hobbed gear, certain measures had to be put into practice. First, a specially coated new hob cutter was used. Because the number of experiments in this work reached 17, the influence of the hob cutter can be considered to be negligible. Second, before the experiments, the hobbing machine was idled for 4 h to attain a thermally balanced state to minimize the effects of thermal errors. Third, the repeatable positioning accuracy for the hobbing machine was 1 μm per axis, and the effects of axis movement could be ignored. 5 The parameters of the main constituent components used in the experiments are listed in Table 1. Figure 3 shows a schematic of the setup and the actual experimental setup, illustrating the equipment used in the experiments.
Specifications of the hob and the workpiece.

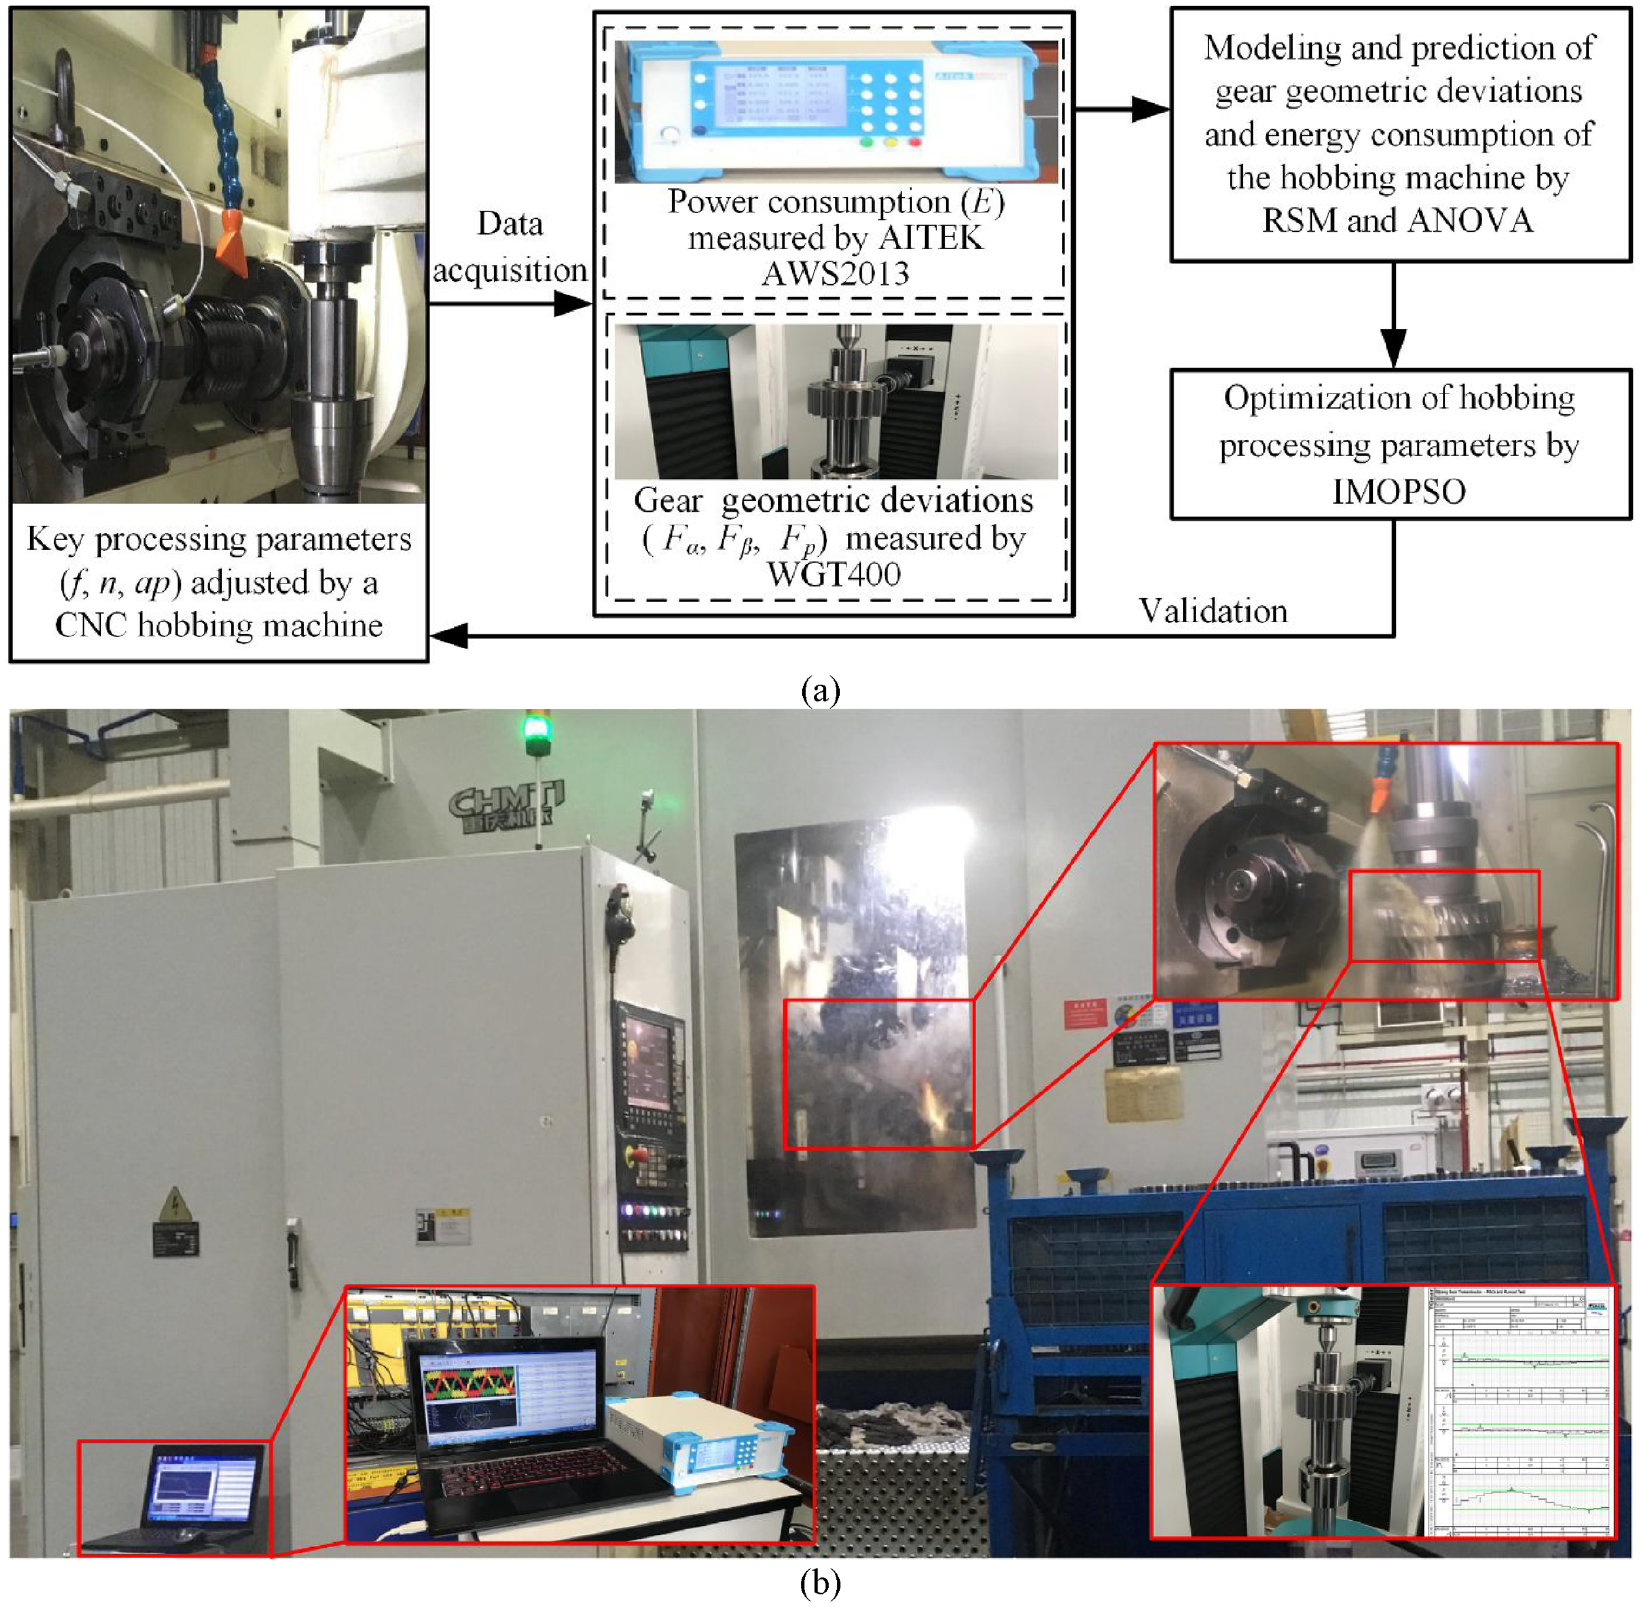
Experimental setup used for the hobbing process. (a) Schematic diagram. (b) Actual experimental setup.
The capabilities and limitations of the cutting conditions of the hobbing machine and the recommendations of the manufacturer were considered during selection of the hobbing parameters. The modulus of the machined gear was 6, and thus two cutting steps were performed. The machining parameters of the second cutting step were selected as the control variables. The energy consumption of the machine tool in the second step and the gear geometric deviations after machining were then recorded as the responses. Table 2 shows the three levels of the three relevant hobbing parameters. The experiments were performed using a Box-Behnken design (BBD) of the RSM. The combinations of the hobbing parameters and the corresponding responses are shown in Table 3.
Machining parameters and their corresponding levels.

Experimental combinations of hobbing parameters and results.

E: energy consumption; F α : total deviation of the tooth profile; F β ; total helical deviation; F p : accumulated pitch deviation.
An AITEK AWS2013 three-phase AC power meter was used to monitor the power consumption of the hobbing machine. The voltage range, the current range, and the maximum power collection limit of the power meter were set at 500 V, 50 A, and 25 kW, respectively. The power meter was connected to the computer through an RS232 communication interface. The real-time power data of the machine tool were displayed and stored using measurement software. The raw data for each group were acquired appropriately according to the corresponding machining parameters. Thereafter, the energy consumption E was calculated by integrating the power and time. The power acquisition process is illustrated in Figure 4.

Power acquisition process.
Each gear was numbered according to the corresponding machining parameters after machining and was then de-burred and cleaned appropriately. Each gear was measured using a gear accuracy measurement center. The gear geometric deviations, including F α , F β , and F p , were then recorded. The relevant parameters, including the gear design parameters and the test standards, were input into the measurement center before the measurements were conducted. Three teeth were measured for each gear. Each tooth was measured on both its left and right flanks, the average values were calculated, and they were then used as the final measurement results. The measurement setup for the gear geometric deviations is shown in Figure 5.

Gear accuracy measurement setup.
Process modeling
The RSM, which was proposed by Box and Hunter, 35 is a statistical test method that is used to optimize random processes. The RSM is used to model and analyze problems where the response is affected by multiple variables. When compared with other experimental methods, because of the advantage of its requirement for fewer tests, the RSM can save on the cost and time of engineering experiments. Additionally, the RSM can accurately describe and identify interactions among the different independent variables in the response. Furthermore, in addition to evaluation of the optimal level, accurate values for the optimized design can also be obtained through the RSM. 36 Therefore, a great deal of work in parameter optimization has been conducted using the RSM, including turning, 37 milling, 38 , and drilling. 39 To study the effects of the hobbing parameters on the energy consumption of the hobbing machine and the gear geometric deviations, the second-order RSM formula is used:

where

In this work, the hobbing parameters f, n, and ap were selected as the input variables, and the gear geometric deviations F α , F β , and F p , and the energy consumption (E) were selected as the output responses. The experimental results reported in the previous section were then used to construct the RSM model of Fα, Fβ, Fp, and E.
Process optimization
PSO algorithm
Because of the complex and nonlinear relationship between the hobbing parameters and the responses, it is difficult to obtain an analytical optimization. In particular, when multi-objective optimization is required, the situation becomes more complex. Multi-objective optimization problems commonly contain conflicting goals. In general, there is no best solution to such a problem, but the set of solutions must be weighted according to the different goals. The Pareto front is a curve or surface that is used to describe optimal trade-off solutions among multiple targets. The solution obtained via the multi-objective optimization algorithm should therefore be as close as possible to the real Pareto frontier. In addition, the diversity of a good solution should be maintained within the Pareto frontier. 40
PSO was first proposed by Kennedy 41 and originated from study of the predation behavior of birds. The method solves problems by studying the simple behavior of individual particles and the interactions of the information within the group. In PSO, the location of a particle in the search space represents a potential solution to the problem to be optimized. The velocity and the position of particle represent the velocity and direction of the movement, respectively. The speed of flight of the particle is adjusted dynamically according to the historical optimal position of the particle and the historical optimal position of the entire population. The velocity and the position in n dimensions can be iterated using the following equations:


where w is the inertia weight;
Improved MOPSO algorithm
PSO has been used widely to solve multi-objective problems and is generally known as multi-objective PSO (MOPSO). 42 . In this work, the improved MOPSO (IMOPSO) algorithm is used to solve multi-objective optimization problems in the gear hobbing process. IMOPSO can locate the boundaries of multi-objective problems accurately. There are only a few parameters to be adjusted and the algorithm is easy to implement.
From equation (3), the velocity updating process of PSO consists of three parts: (a) the current velocity of the particles multiplied by the inertia weight
The global search capability and the local optimization capability of PSO can be controlled using the inertia weight
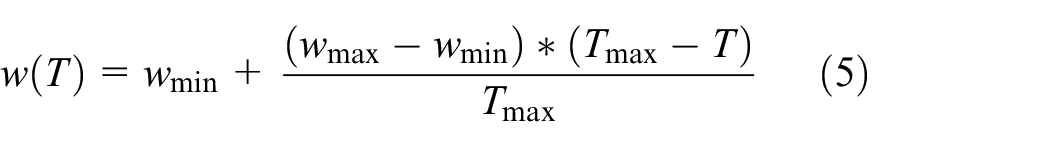
where
The learning factors


The distributions of the improved

Learning factors of IMOPSO.
In the early stages of the search process, larger
The RSM-based models that were established in the modeling part of the paper were used as the optimization objective function. The Pareto front obtained by IMOPSO represents the optimum solution set for the objective function, which will be displayed in a variable domain.
Results and Discussion
Experimental results
The experimental results are presented in Table 3. The main effect plots for the mean E, Fα, Fβ, and F p values are illustrated in Figures 7 to 10, respectively. In terms of E, it can be concluded that among the three factors under consideration, f has the most significant main effect, whereas the other two factors have little effect. This indicates that f has the dominant influence on E. Additionally, it shows that an increase in f leads to a reduction in E, but increases in n and ap lead to an increase in E (Figure 7). From the perspective of Fα, f, n, and ap all showed a considerable influence on F α , and the range of ap appears to be wider than the ranges of f and n. Fα decreases with decreasing values of f and ap, but increases with decreasing values of n (Figure 8). In terms of F β , there is a positive correlation between f, ap, and F β , and a negative correlation between n and F β . The extent and range of the changes caused by f are greater than those caused by the other two factors. This indicates the dominant influence of f on F β (Figure 9). With regard to F p , the slopes of f and n are relatively large, which indicates that both f and n have significant impacts on Fp. Fp increases with increasing values of f and ap, but it decreases with increasing n (Figure 10).

Main effect plot for mean E.

Main effect plot for mean Fα.

Main effect plot for mean Fβ.

Main effect plot for mean Fp.
When these data are taken together, they suggest that E, Fα, Fβ, and F p are all parameter-related. According to the experimental results, setting f to a higher level and setting n and ap to lower levels will produce a lower E. Setting f and ap to lower levels and setting n to a higher level produces a smaller F α . The same parameter setting strategy can also be applied to obtain smaller values of F β and F p . However, the previous analysis indicated that different target responses required different parameters. In other words, to achieve one goal, another goal must be sacrificed. Therefore, use of multi-objective optimization methods is very helpful when attempting to solve these trade-off problems.
Modeling results
Using the experimental results presented in Table 3, second-order RSM-based models in response to E, Fα, Fβ, and F p are established. The regression models obtained for the responses are given as equations (8) to (11), respectively. As shown in Tables 4 to 7, when the p value of the item is greater than 0.05, this means that that item is insignificant, and the insignificant items have been eliminated from these models.


ANOVA analysis results for E.

ANOVA analysis results for Fα.

ANOVA analysis results for Fβ.

ANOVA analysis results for Fp.

ANOVA was used to test the effects of the proposed model and processing parameters on the objective function. Tables 4 to 7 list the ANOVA tables for E, Fα, Fβ, and F p , respectively. The results in Tables 4 to 7 show that f makes a major contribution to E, Fβ, and F p , and that ap makes a major contribution to F α . As shown in Table 4, the contribution of f to the response E is 87.91%, with f2 accounting for 11.96%, and followed by ap with 0.060%. The remaining contribution is produced by the interactions of the process parameters. In addition, Figure 7 shows that the main effect trends of n and ap change gently, but Table 4 shows that the effects of n and ap on E are significant. This difference may occur because the main effect is estimated in an average sense. Even if the change is small, it does not mean that the factor has no effect on the response. Table 5 shows that the contribution of ap to F α is 40.84%, which is higher than the 31.82% contribution of f, followed by 11.97% from f*ap, and 7.76% from n. As illustrated in Table 6, f makes an 82.33% contribution to F β , with 11.40% from n, 1.88% from f2, 1.41% from ap, and a 1.13% contribution from f*n. As shown in Table 7, f makes the largest contribution to F p at 40.43%, followed by n at 29.13%, f2 at 11.20%, ap at 5.57%, f*n at 5.37%, and n2 at 2.88%. The significance and contribution analysis shows that the interactions of the variables have a significant effect on the response, which indicates that each response is the result of the combined effect of the corresponding variables. A significance analysis of the process parameters with respect to the response also indicates that the results of the main effects analysis are in good agreement with the variance analysis results.
To measure each model’s adequacy, R2, the predicted R2 (R2(Pred.)), and the adjusted R2 (R2(Adj.)) were calculated. The values of R2, R2(Pred.), and R2(Adj.) are 0.9999, 0.9997, and 0.9999 for E, 0.9238, 0.8632, and 0.8984 for F α , 0.9818, 0.9506, and 0.9736 for F β , and 0.9526, 0.7745, and 0.9241 for F p , respectively. All values of R2 are on a high level and are close to 1. The F value range of the models is from 33.47 to 32969.50, and the AP value range of the models is from 21.35 to 465.54. Figure 11 shows the normal probability plots for both responses. As indicated by the data points in each graph, there is no specific trend for the residuals, and the errors are shown as a normal distribution. These results indicate that the models are significant and the experimental results are sufficient to model the hobbing process.

Normal probability plots of the residuals for (a) E, (b) F α , (c) F β , and (d) F p .
The 3D response graph of E with respect to the process parameters is presented in Figure 12. E increases with decreasing f, and the growth rate of E goes up as f falls. The minimum f has the largest value of E under any ap. At any value of f, E increases with increasing ap, but the increment is small. The increase in ap increases the volume of material removed per tooth, thus leading to increased energy consumption. Figure 12 also indicates that during the hobbing process, the cut in energy consumption accounts for only a small proportion of the entire hobbing machine energy consumption. Because the response E that is studied in this paper is given by the integral of the power and the processing time, a smaller f means a longer processing time, which then leads to a larger E. In summary, to obtain a small E, a large f and a small ap are required.

3D surface plot of E.
The 3D response graph of F α to the process parameters is presented in Figure 13. As depicted in Figure 13, F α decreases with decreasing values of f and ap. Hobbing is an intermittent cutting process that involves multiple cutting edges and the tooth profile is formed by the limited spatial traces of the cutting edge; as a result, the actual tooth profile formed by hobbing is a polygonal approximate curve. Although the edges of the envelope polygon have been fixed after the hob is determined, at lower levels of f and ap, the amount of material removed per unit time and the maximum thickness of the undeformed chips are both reduced, and there is less residual material left on the surface; the generated texture formed by the envelope motion is then more evenly distributed, which means that F α is smaller.

3D surface plot of Fα.
Figure 14 illustrates the effects of the hobbing parameters on F β . The plot shows that F β increases with increasing f, and that it decreases with increasing n. As f decreases, the downward trend becomes more obvious. The minimum f gives the smallest F β under any n. Fβ is measured on the tooth surface along the tooth width. During the gear hobbing process, the hob cuts at different positions in the gear width direction based on f. A smaller f value and a higher n value reduce the cutting distance for each tooth of the hob in the width direction. Reduction of the material removal causes the local residual height of the tooth surface to decrease, which makes the tooth surface more uniform in the width direction, with fewer fluctuations, and thus results in a smaller F β .

3D surface plot of Fβ.
Figure 15 shows the effects of the hobbing parameters on F p . The figure indicates that F p increases with increasing f, and decreases with increasing n. A larger n leads to a smaller f, and then F p decreases more rapidly. The concave-convex degree of the tooth surface at the middle of the tooth height determines the size of F p . With a smaller f and a larger n, the amount of material that is cut per unit time decreases, the residual protrusion weakens, the degree of unevenness of the tooth surface decreases, and the undulation of the mesh texture formed by the envelop and feed movement becomes gentler; as a result, a smaller F p is obtained.

3D surface plot of Fp.
Overall, this article has discussed the gear geometric deviations F α , F β , and F p . Although the effects of the different hobbing parameters (f, n, and ap) have various influences on the different geometric deviations (F α , F β , and F p ), the influence trend remains almost the same; this means that smaller values of F α , F β , and F p can be obtained by selecting smaller values of f and ap, along with a larger n.
Multi-objective optimization results
The previous analysis indicated that obtaining the minimum values of E, Fα, Fβ, and F p simultaneously represents a trade-off problem, and thus it is necessary to conduct multi-objective optimization. In this work, the models of F α , F β , and F p are weighted and are then added to form a comprehensive gear geometric deviation model for multi-objective optimization. The comprehensive model can be defined as follows:

where
The multi-objective optimization problem with two optimization goals involved in this paper can be expressed as follows:

The IMOPSO that was proposed in Section 2.3 is used to solve the multi-objective optimization problems. The parameters selected for the proposed IMOPSO here are given in Table 8.
Parameters for IMOPSO.

After each iteration, the best particle value stored in the external archive is then drawn in the two-dimensional target space. With increasing numbers of iterations, a clear Pareto frontier is formed. The Pareto frontier of the non-dominated solutions to minimize E and minimize

IMOPSO solutions: (a) Pareto frontier of the optimum target value, and (b) optimum solutions in variable space.
Three different regions are distinguished by the Pareto frontier shown in Figure 16(a), and these regions are labeled ‘Minimize E’, ‘Balance E and F c ’, and ‘Minimize F c ’. The corresponding areas are also shown in the variable domain in Figure 16(b). A set of hobbing parameters that falls within these areas can offer a viable solution set that allows the process makers to achieve the desired gear geometric deviations while also consuming the least energy possible.
Validation
The confirmation experiments were performed based on the optimum hobbing parameters obtained when using the IMOPSO algorithm. First, a set of hobbing parameters (f=8 mm/min, n=100 rpm, ap=1.45 mm) was adopted; later, we found they were the most ideal parameters to obtain the minimum E. Second, another set (f=5 mm/min, n=150 rpm, ap=1.45 mm) was used, and this group was selected as the best group for balancing E and F c . Finally, the last optimal set (f=2 mm/min, n=150 rpm, ap=1.45 mm) was used to minimize F c only. The results of these validation experiments are summarized in Table 9. As illustrated in Table 9, the experimental results for the optimal parameters required to minimize F c obtained the smallest gear geometric deviations for F α , F β , and Fp. The lowest energy consumption was achieved by applying the optimal hobbing parameters to minimize E. Additionally, the medium values of E and F c were realized by using the parameter set to balance E and F c . It can therefore be concluded that the RSM-based IMOPSO prediction values are highly consistent with the experimental results. Furthermore, the multi-objective optimization results and the experimental results presented in this paper are consistent with the research conclusions drawn in the literature, 5 i.e., the tooth surface deviations of the gears decrease with increasing spindle speed (n) and decreasing feed rate (f). In addition, the energy consumption is determined by a combination of the power and the processing time. A lower spindle speed and shallower cutting depth will lead to lower power requirements, and a higher feed speed and a shorter processing time will cause less energy to be consumed. The findings with regard to the relationships among the hobbing parameters, the tooth surface deviations, and the energy consumption all agree well with gear manufacturing industry practice.
Optimal hobbing parameters and experimental results.

The previous analysis indicates that there may be some connection between the hobbing machine’s energy consumption and hobbing accuracy. The gear geometric deviations are difficult to measure during real-time processing. However, real-time monitoring of the machine’s energy consumption is easy to implement. Therefore, this suggests an interesting approach for us that may allow us to reflect the real-time machining accuracy to some extent by monitoring the machine tool’s energy consumption, and it may also serve as a reference for real-time adjustment of the machining parameters.
Conclusions
In this work, a hybrid integration method involving RSM in combination with IMOPSO was developed to optimize the gear hobbing parameters to improve the gear accuracy and reduce the energy consumption simultaneously. The parameters f, n, and ap were selected as the hobbing parameters, and the responses that we considered were E, Fα, Fβ, and F p . Empirical models were obtained for the responses by analyzing the experimental data. As a result of our investigation, the following findings were summarized:
f was found to be the most significant hobbing parameter, affecting E, Fβ, and Fp; ap also made a major contribution to F α . To obtain a smaller E, a higher value of f and smaller values of ap and n were required. However, smaller gear geometric deviations could be obtained by selecting smaller values of f and ap along with a larger n.
The optimal hobbing parameter sets obtained when using the proposed IMOPSO could help manufacturers to deal with the trade-off problems involved making in hobbing parameter decisions to obtain minimum energy consumption and minimum gear geometric deviations simultaneously under different working conditions.
The optimized parameter sets showed that the prediction results from IMOPSO are consistent with the experimental results. The proposed RSM-based IMOPSO approach could be applied to optimization of other types of gear machining processes.
The hobbing parameters also play decisive roles in the efficiency and cost of hobbing. Future research can consider the efficiency and cost further to optimize the hobbing parameters and obtain a better all-round machining effect.
Footnotes
Handling Editor: Chenhui Liang
Authors’ contributions
Declaration of conflicting interests
The authors declared no potential conflicts of interest with respect to the research, authorship, and/or publication of this article.
Funding
The authors disclosed receipt of the following financial support for the research, authorship, and/or publication of this article: This research was funded by the Innovation Group Science Fund of Chongqing Natural Science Foundation (Grant No. cstc2019jcyj-cxttX0003.).