
Abstract
During the online welding of railway aluminum alloy trucks using fixed shoulder stirring friction welding technology, defects such as flying edges, cracks, and tunnels may occasionally occur due to poor coordination of the welding process parameters. This inconsistency can compromise the success rate of the welding. To enhance the quality and efficiency of the welding repairs, an optimization of the welding process parameters of the developed equipment was undertaken. An intelligent prediction model for welding parameters was established based on the BSO-BP neural network. The model was trained with 17 sets of authentic welding data, and its accuracy was validated through a comparison of predictive outputs with actual welding outcomes. The BSO-BP neural network demonstrated a maximum error of 1.85% and a relative error of 1.27%, showing a marked improvement over traditional BP neural network predictions. Utilize the optimized welding process parameters obtained from a trained predictive model to conduct welding experiments under actual working conditions. During the experiment, the deformation of the test plates was minimal. The resulting welds were smooth, free of defects such as flash and grooves, and the overall welding quality was good. The tensile strength of the welds, at 262.95 MPa, was close to the predicted results and reached 78.49% of the base material’s tensile strength. In the microstructure of the weld, sporadically distributed dimples of varying sizes can be observed, indicating the presence of second phase particles which contribute to enhancing the tensile strength of the weld, thereby meeting the strength requirements of the aluminum alloy car body. The parameter optimization method used has certain reference value and can provide guidance for similar research.
Keywords
Preface
As various countries advance in heavy-duty railway technology, the application of aluminum alloy materials in freight vehicles is becoming increasingly widespread. 1 In recent years, with the rising number of aluminum alloy trains in service, there is a growing demand for operation and maintenance. Consequently, research on methods, efficiency, and quality of repair for damages to aluminum alloy bodies is receiving extensive attention. 2 The traditional “patching” repair method significantly affects the esthetics and safety of the vehicle. Moreover, due to the formation of a dense oxide film on the surface of aluminum alloys, traditional arc welding can lead to issues like cracking and pores, as shown in Figure 1. 3
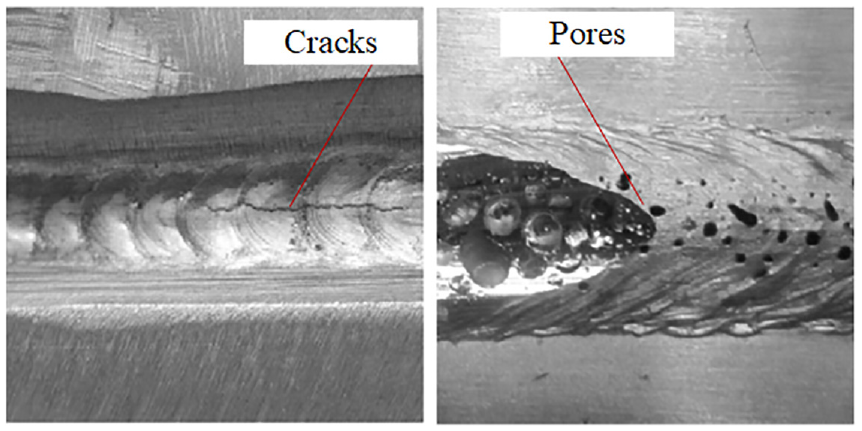
Traditional welding defects in aluminum alloy materials.
Stationary Shoulder Friction Stir Welding (SSFSW) is a solid-phase welding method used for joining aluminum/steel and dissimilar metals. Through the heat generated by friction between the stirring head and the welding material, the welding area is brought to a molten state, and the surrounding material is drove to undergo plastic flow. Under the action of downward pressure, the material is extruded to form a weld, thereby completing the connection.4,5 The schematic diagram of its principle is shown in Figure 2.

Friction stir welding schematic.
Compared to traditional online welding repair methods, SSFSW not only meets the process requirements in harsh environments for railway freight vehicles, but also the heat input accounts for about 10% of that in traditional arc welding. 6 There is a lesser reduction in material strength at the welded area, making it highly advantageous for welding aluminum alloy materials.
In the actual repair conditions, providing sufficient rigidity support at the back is the foundation for forming high-strength welds. 7 For the hollow, three-dimensional, and other structurally complex workpieces that cannot provide effective rigid support, which can lead to deformation of the welding material,8,9 resulting in welding failure. Based on self-developed equipment as shown in Figure 3, this paper mainly focuses on the online rapid repair of C80 aluminum alloy car bodies, conducting research on stationary shoulder friction stir welding online repair equipment with non-rigidly support and solving the problem of the inability to provide rigid support during welding.
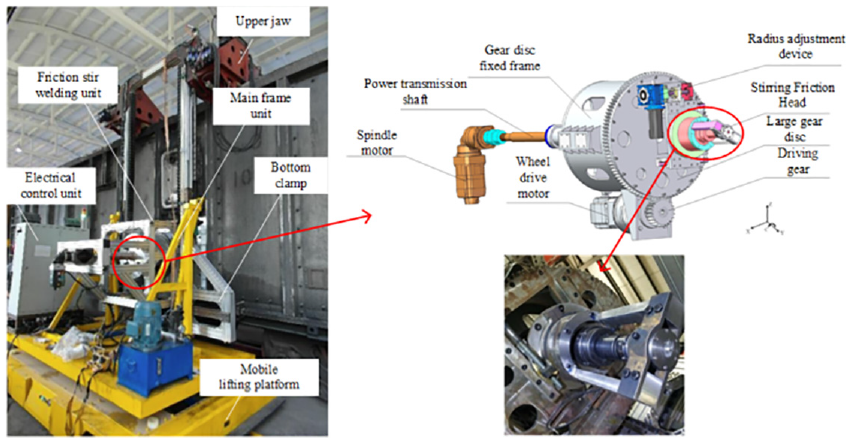
SSFSW repair equipment.
When using the above mentioned welding equipment for the online repair of damaged aluminum alloy car bodies, it was found that poor coordination of welding process parameters occasionally leads to defects such as flash, cracks, and tunneling in the welds, greatly affecting the welding quality. The traditional experimental method for optimizing the welding process parameters of aluminum alloy stir friction welding can improve the welding quality.10–12 However, it is time-consuming and laborious to optimize the parameters for stir friction welding with strong coupling relationships, and the precision is poor. Due to the autonomous learning ability of neural networks, they have strong adaptability to strongly coupled systems and can establish high-precision predictive models for complex processes to meet the goal of efficient parameter optimization. 13 Research by Zhao et al. 14 has shown that compared to the response surface model, neural network models can more accurately predict the tensile strength of aluminum FSW joints. In recent years, the combination of algorithms to compensate for the shortcomings of individual algorithms has become increasingly popular to address issues such as neural networks easily falling into local optima and convergence difficulties. Li et al. 15 have used the GA-BP network to improve the quality and diversity of synthetic data in the diagnosis of high-pressure common rail diesel engine faults. Ya et al. 16 utilized a neural network optimized by the Beetle Swarm Optimization (BSO) method have demonstrated clear advantages over traditional models in SCB prediction, showcasing better accuracy and faster convergence.
The BSO algorithm is a combination of the advantages of the Beetle Antennae Search (BAS) algorithm and the Particle Swarm Optimization (PSO) algorithm. 17 The purpose of the BSO algorithm is to assist the BP neural network in finding the optimal weights and thresholds, making the predictions of the BSO-BP neural network model more accurate. The BSO-BP, as an emerging algorithm in recent years, has potential for further exploration in the field of aluminum alloy welding research. This paper employs the BSO-BP neural network to establish a predictive model for weld tensile strength under different welding process parameters. Based on the accuracy of the model’s predictions, it predicts the optimal tensile strength of welds achievable by the developed welding equipment and infers the equipment’s optimal welding process parameters. Experiments prove that when welding with the inferred process parameters, the stirring head moves steadily, the experimental plates show no significant deformation, and the weld surface is smooth without defects such as flash and flute, resulting in good overall welding quality. This solves the issue of low welding quality during online repair of aluminum alloy freight car bodies with non-rigidly supported stationary shoulder friction stir welding equipment, significantly improved the efficiency and success rate of welding repairs.
Heat generation model of static shoulder friction stir welding
SSFSW is a complex thermodynamic coupling process. Studying the theoretical analysis of welding heat generation and the impact of different welding process parameters on weld quality is of great significance.18–20 By establishing a welding heat generation model and analyzing the overall heat generation mathematical model during the welding process, a theoretical basis is provided for the optimization of welding process parameters.
Heat generation analysis at the end of the stirring pin
In the initial stage of welding, the main heat generation area is at the end of the stirring pin, as depicted in Figure 4.

Heat generated at the end of the mixing pin.
Assuming that the cross-section of the stirring pin is a circle with a radius of

The variables in the equation are as follows:
Analysis of heat production on the stirring pin side
As the stirring head is pressed down, the side of the stirring pin begins to contact the material being welded. Assuming that the pressure exerted by the side of the stirring pin during welding is uniform, the schematic diagram of the frictional heat generation between the side of the pin and the material being welded is as shown in Figure 5.
Heat generated by friction on the side of the mixing pin.
The heat generated by friction on the side of the stirring pin is as follows:


The variables in this equation are as follows:
Establishment of the shaft shoulder heat generation model
The shoulder of the stirring head is divided into stationary shaft shoulder and moving shaft shoulder, both of which have relative sliding motion with the material being welded during the welding process, simultaneously generating a certain amount of heat.
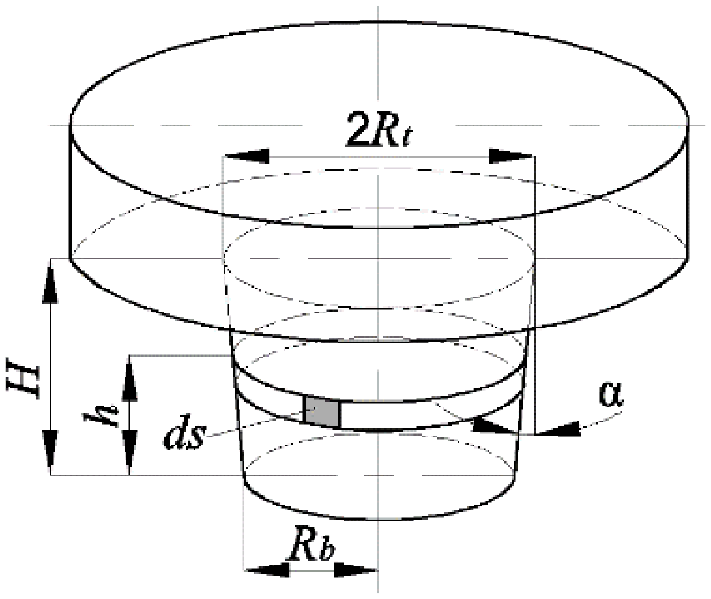
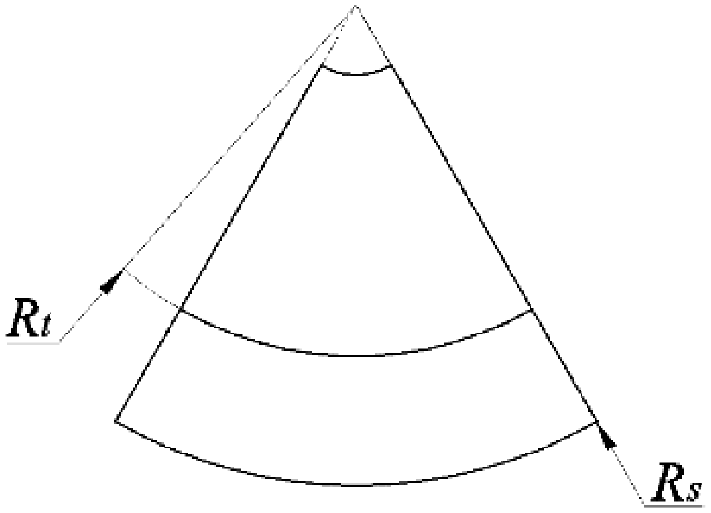
The heat generation of the stationary shaft shoulder is primarily due to the movement of the stirring head along the direction of the weld. Under the action of axial downward pressure, the stationary shaft shoulder contacts the material being welded, generating heat through friction. Please refer to Figure 6 for a schematic representation of the heat generation process.
Frictional heat generation of the stationary shaft shoulder.
The heat generated by friction in the stationary shaft shoulder is given by:
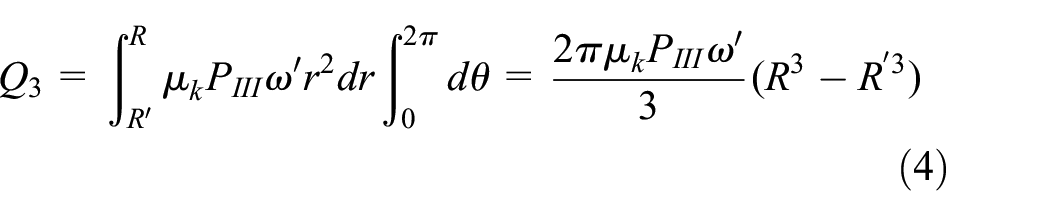
The variables in the equation are as follows:
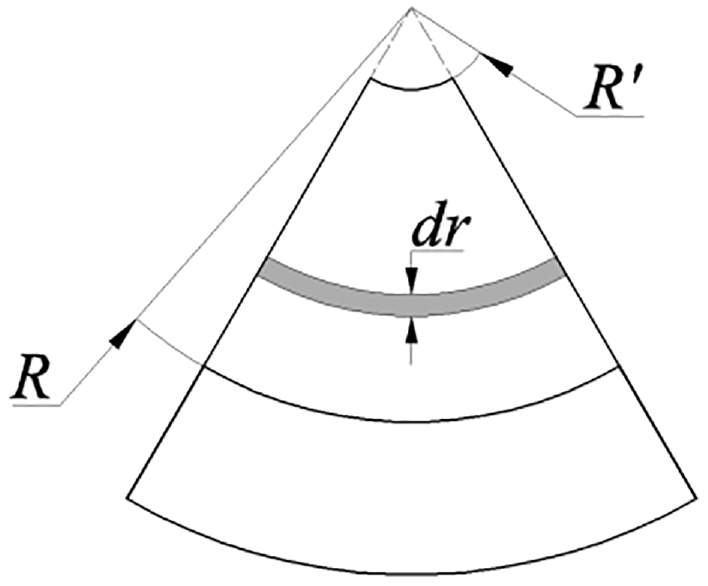
The heat generation of the moving shaft shoulder is primarily due to the rotation of the stirring head itself. Under the action of axial downward pressure, the moving shaft shoulder contacts the material being welded, generating heat through friction, as depicted in Figure 7.
Frictional heat generation of the moving shaft shoulder.
The equation for the heat generated by friction on the moving shaft shoulder is:

Where
Heat generation model of molten material plastic deformation
During the welding process, the frictional heat generated by the stirring head causes the temperature around the weld to rise, bringing the material to a molten state. In the molten state, the welding material undergoes intense plastic deformation under the stirring action of the stirring pin, generating a substantial amount of heat from plastic deformation. Research indicates that during the plastic processing of metal materials, 90% of the deformation work is released as thermal energy, with only a small portion of the deformation work used for the plastic deformation of the metal. 24 The heat generated during plastic deformation of a material per unit volume is assumed to be:

Where:
The heat produced from the material’s plastic deformation during the welding stage is:

In summary, the total heat generated during the welding process is:

By analyzing the mathematical model of total heat production in the welding process, it can be seen that, under the condition that the structural dimensions of the stirring head and the material properties of the welded plate remain unchanged,
BSO-BP neural network prediction model
The BP neural network can predict the tensile strength of welds in friction stir welding with non-rigidly supported static shoulder under different welding process parameters. However, BP neural networks face issues such as the propensity to get trapped in local optima and difficulties in convergence. Furthermore, under the conditions of specialized stirring friction welding, the precedent for applying intelligent algorithms to predict welding parameters is rare, and the relationship between various welding parameters is characterized by non-linear coupling. Therefore, this chapter, based on the BP neural network, combines the BAS algorithm and the PSO algorithm to establish the BSO algorithm model. This model assists the BP neural network in finding optimal weights and thresholds, thereby enhancing the accuracy of the BSO-BP neural network model’s predictions.
Basic principles of BP neural network
As shown in Figure 8, the input layer, the hidden layer and the output layer formed a three-layer BP neural network system.
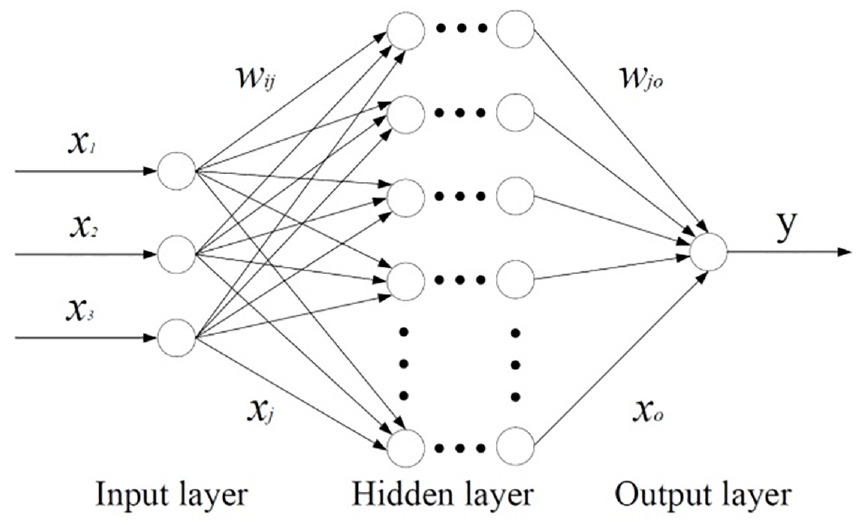
Structure of BP neural network.
The BP neural network algorithm includes two parts: forward propagation of information and error back propagation. 25 The basic principle is based on actual data from the input and output ends. By continuously training the weights and thresholds in the model through error back propagation and compressing the error, the model’s error is brought to a certain level of accuracy, allowing the model’s output to continuously approach the actual values. This process aims to predict the model’s output, with the calculation process are as follows:
(1) Forward dissemination of information Step 1: The input value, after being combined through weight and threshold calculations, yields the hidden layer input value:
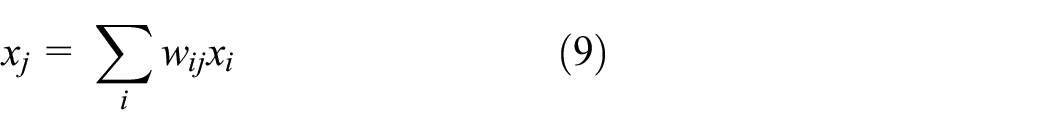
Where:
Step 2: The input values of the hidden layer are processed to obtain the input values of the output layer.

Where: The input value of the output layer is denoted as
Step 3: Output layer output operation:

The output prediction value of the output layer is represented as
(2) Error back propagation
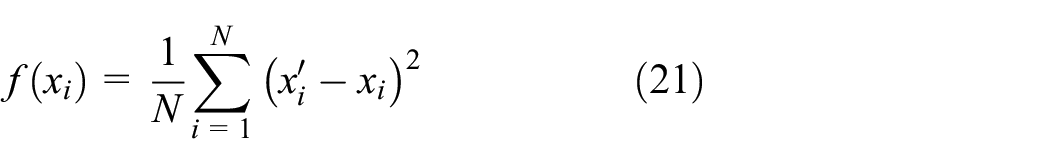
Step 1: Calculate the error between the predicted output value and the actual output value:

Where: The variables
Step 2: The algorithm performance index function can be obtained using equation (12).

The performance indicator function for the BP neural network is denoted as
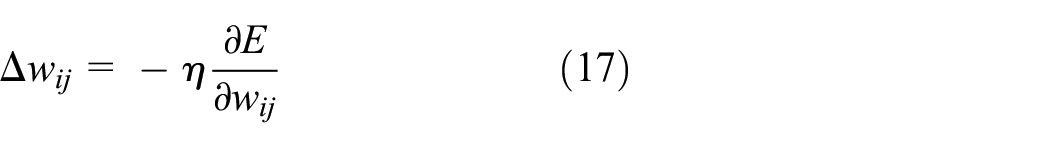
Step 3: Update the weights between the input layer and the hidden layer.


Where:
Step 4: Update the weights between the hidden layer and the output layer:

Where: the weight between the updated input layer and the hidden layer is represented as
The raw data was used to train a BP neural network with varying numbers of hidden elements in order to determine the optimal number of neurons in the hidden layer. The accuracy of network prediction results was highest in experiments where the number of hidden elements was 10. The relative errors of the output layer for different numbers of hidden elements are shown in Figure 9. In this case, the structure of the weld tensile strength prediction model based on the BP neural network is 3-10-1.

Training error of neural network with different number of hidden elements.
Basic principles of BSO algorithm
BSO is an algorithm that combines the advantages of BAS and PSO. 17 The purpose of the BSO algorithm is to assist the BP neural network in finding the optimal weights and thresholds, making the predictions of the BSO-BP neural network model more accurate. When establishing the BSO algorithm model, it is necessary to combine the BAS and PSO algorithms, replacing the individual in BAS with the particle in PSO. This allows the particle to update and share its position within the population while also having the ability to directionally search for the optimal solution. The methods for establishing the mathematical models of each algorithm are as follows.
(1) BAS algorithm
For instance, in a two-dimensional plane, the two antennae of a scarab beetle are positioned on either side of the centroid, and the distance between these antennae relative to the step length (i.e. the centroid) is a fixed constant, as illustrated in Figure 10.

Two-dimensional model of BAS algorithm.
Based upon this basic understanding, a random spatial vector in n-dimensional space representing the orientation of the beetle is established.

Where:
Define the left and right spatial coordinates of the beetle’s antennae:


Where:
Calculate the fitness value of the beetle’s antennae, enabling the beetle to have the ability to directionally search for food.
Where:
Update the beetle’s optimal position based on the fitness value of its antennae:

Where:
The step factor, denoted as

Where:
(2) PSO algorithm
In an n-dimensional space, multiple particle vector models are established. The position of the

Where:
The velocity of the

The population shares and saves the individual extrema


Where:
Through continuous iteration, the position of particles in the population is updated, preserving the current best individual extreme value
(3) BSO algorithm
Based on the BAS algorithm, the BSO algorithm requires replacing the beetle individuals with particles from the PSO algorithm. After modification, its expression is as follows:


After updating, the position and velocity of the beetle are as follows.


Where:
BSO-BP neural network prediction model design
Before designing the BSO-BP neural network prediction model, it is necessary to set the number of beetle swarms, search space dimensions, and learning factors for the BSO algorithm. Since the BSO algorithm is a combination of BAS and PSO algorithms, the method of selecting the number of beetle swarms can refer to the population number selection method of the PSO algorithm.
The selection of the number of particles in the PSO algorithm should be moderate. A larger number of particles will result in an increase in computational requirements, leading to longer calculation times. A limited number of particles can result in a narrow search range for the algorithm, making it susceptible to getting trapped in a local optimum. In general, it has been observed that a particle population consisting of 20–40 particles facilitates the ability of the PSO algorithm to converge toward an optimal solution. To mitigate the computational load, a total of 20 populations were selected for the BSO algorithm.
The dimension of the search space is related to the number of neurons in the input layer, output layer, and hidden layers of the BP neural network. The specific number can be calculated according to the following formula:

Where:
The calculation process of the BSO-BP neural network prediction model are as follows:
(1) Establish and calculate the BP neural network while introducing the BSO algorithm;
(2) According to the design parameters, initialize the beetle population, randomly generating beetle positions and velocities;
(3) Continuously update the best individual extreme value and the group extreme value of the beetle population by comparing and updating the position of the beetles;
(4) After reaching the set iteration limit, assign the optimal solution obtained to the BP neural network as its initial weights and thresholds;
(5) The BP neural network continuously trains the weights and thresholds between neurons through forward calculation and error backpropagation, until the number of training sessions reaches the set value or the output data achieves a certain accuracy.
The computational flowchart of the BSO-BP neural network prediction model is shown in Figure 11.
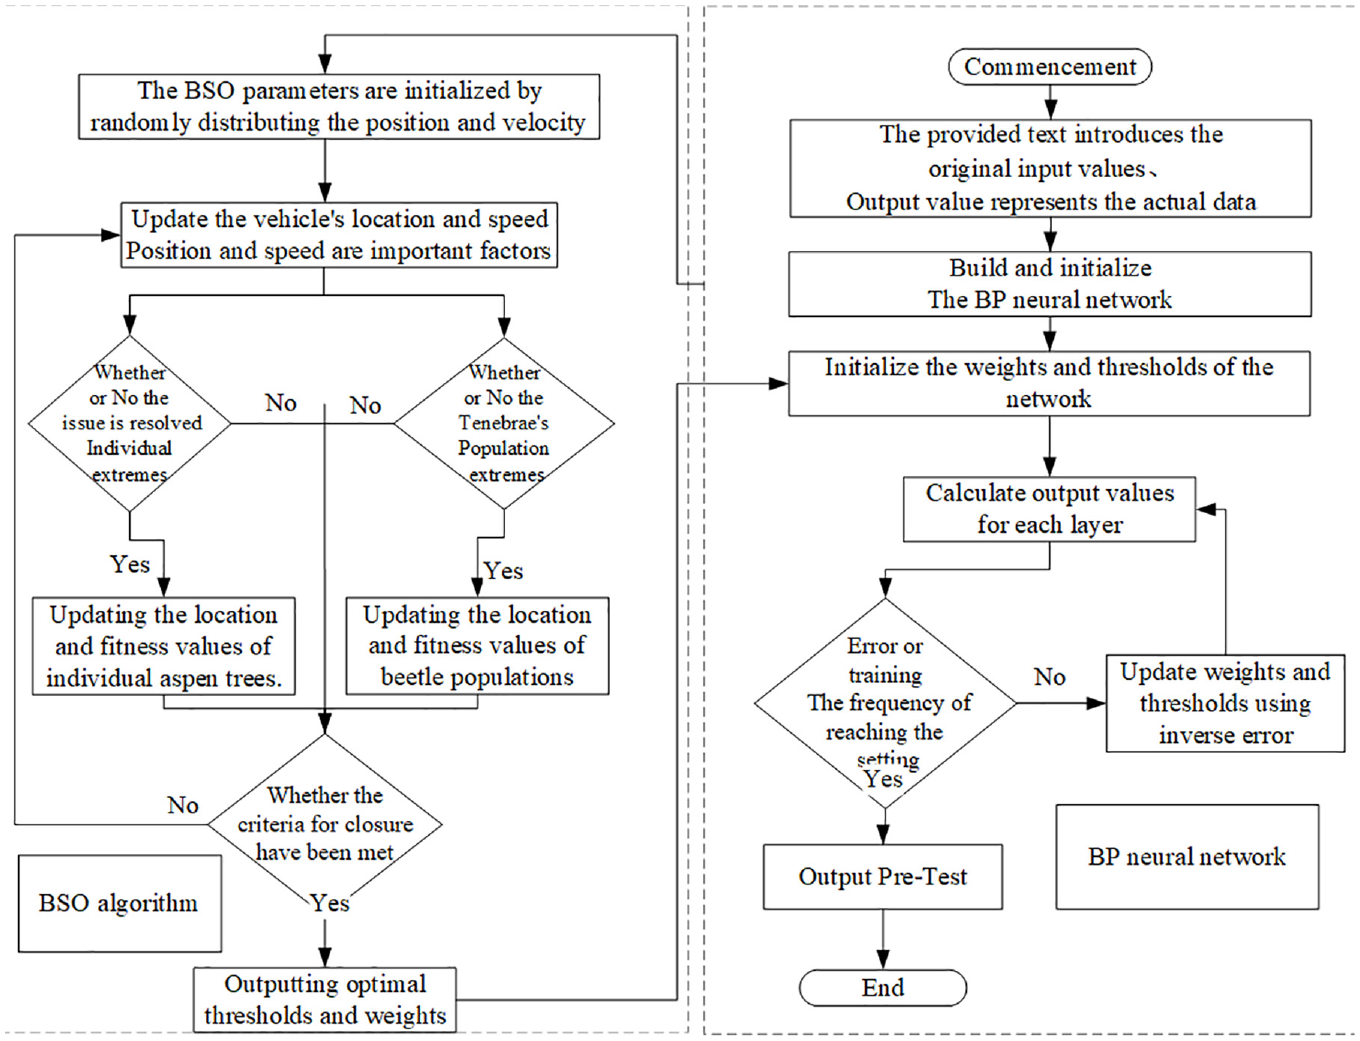
Flowchart of the BSO-BP neural network prediction model calculation process.
Neural network raw training parameters acquisition
To obtain the original training data for the neural network, independently developed welding equipment was used. Under non-rigidly support conditions, online welding experiments were conducted on C80 aluminum alloy car bodies using different welding process parameters. The thickness of the experimental plates was 6 mm, made of 5083 aluminum alloy, with the on-site welding as shown in Figure 12.

Non-rigidly supported static shaft shoulder friction stir welding on-site welding.
Samples were taken from the completed welds to create tensile test specimens. The structural dimensions of the tensile specimens are shown in Figure 13.

Structural dimensions of tensile specimen.
Tensile tests were conducted on these specimens to measure the tensile strength of the welds. The welded specimens after tensile testing are shown in Figure 14.

Tensile test specimen.
Utilizing welding parameters from existing welding repair technologies, a series of parameters and boundary conditions that guarantee successful welding were identified through extensive experimentation. 27 The simulation and analysis model of static shoulder stir friction welding under non-rigid support is established through the coupled Euler-Lagrange (CEL) method, and the comparison of simulation and actual experiment shows that the established simulation model is correct. Utilizing the established simulation model, the influence of different welding process parameters on the welding temperature field under non-rigid support conditions was investigated through the method of controlled variables. Consequently, the parameter range was determined: spindle speed 800–1800 r/min, feed speed 75–225 mm/min, and spindle pressure 300–450 kgf.
Based on the developed welding equipment, 17 welding experiments were conducted using different welding process parameters, recording the welding point temperature when the welding was stable. During the experiments, K-thermocouples were mounted in the metal around the weld using the pre-embedded method. However, in practical application, infrared thermal imaging was employed for temperature measurement. The schematic diagram and the temperature measurement results are as illustrated in the Figure 15.

Schematic diagram of infrared thermography temperature measurement method and localization.
After the welding was completed, samples were taken from the welds for tensile testing, and the experimental data obtained are shown in Table 1.
Welding process parameters and raw data of weld tensile strength.
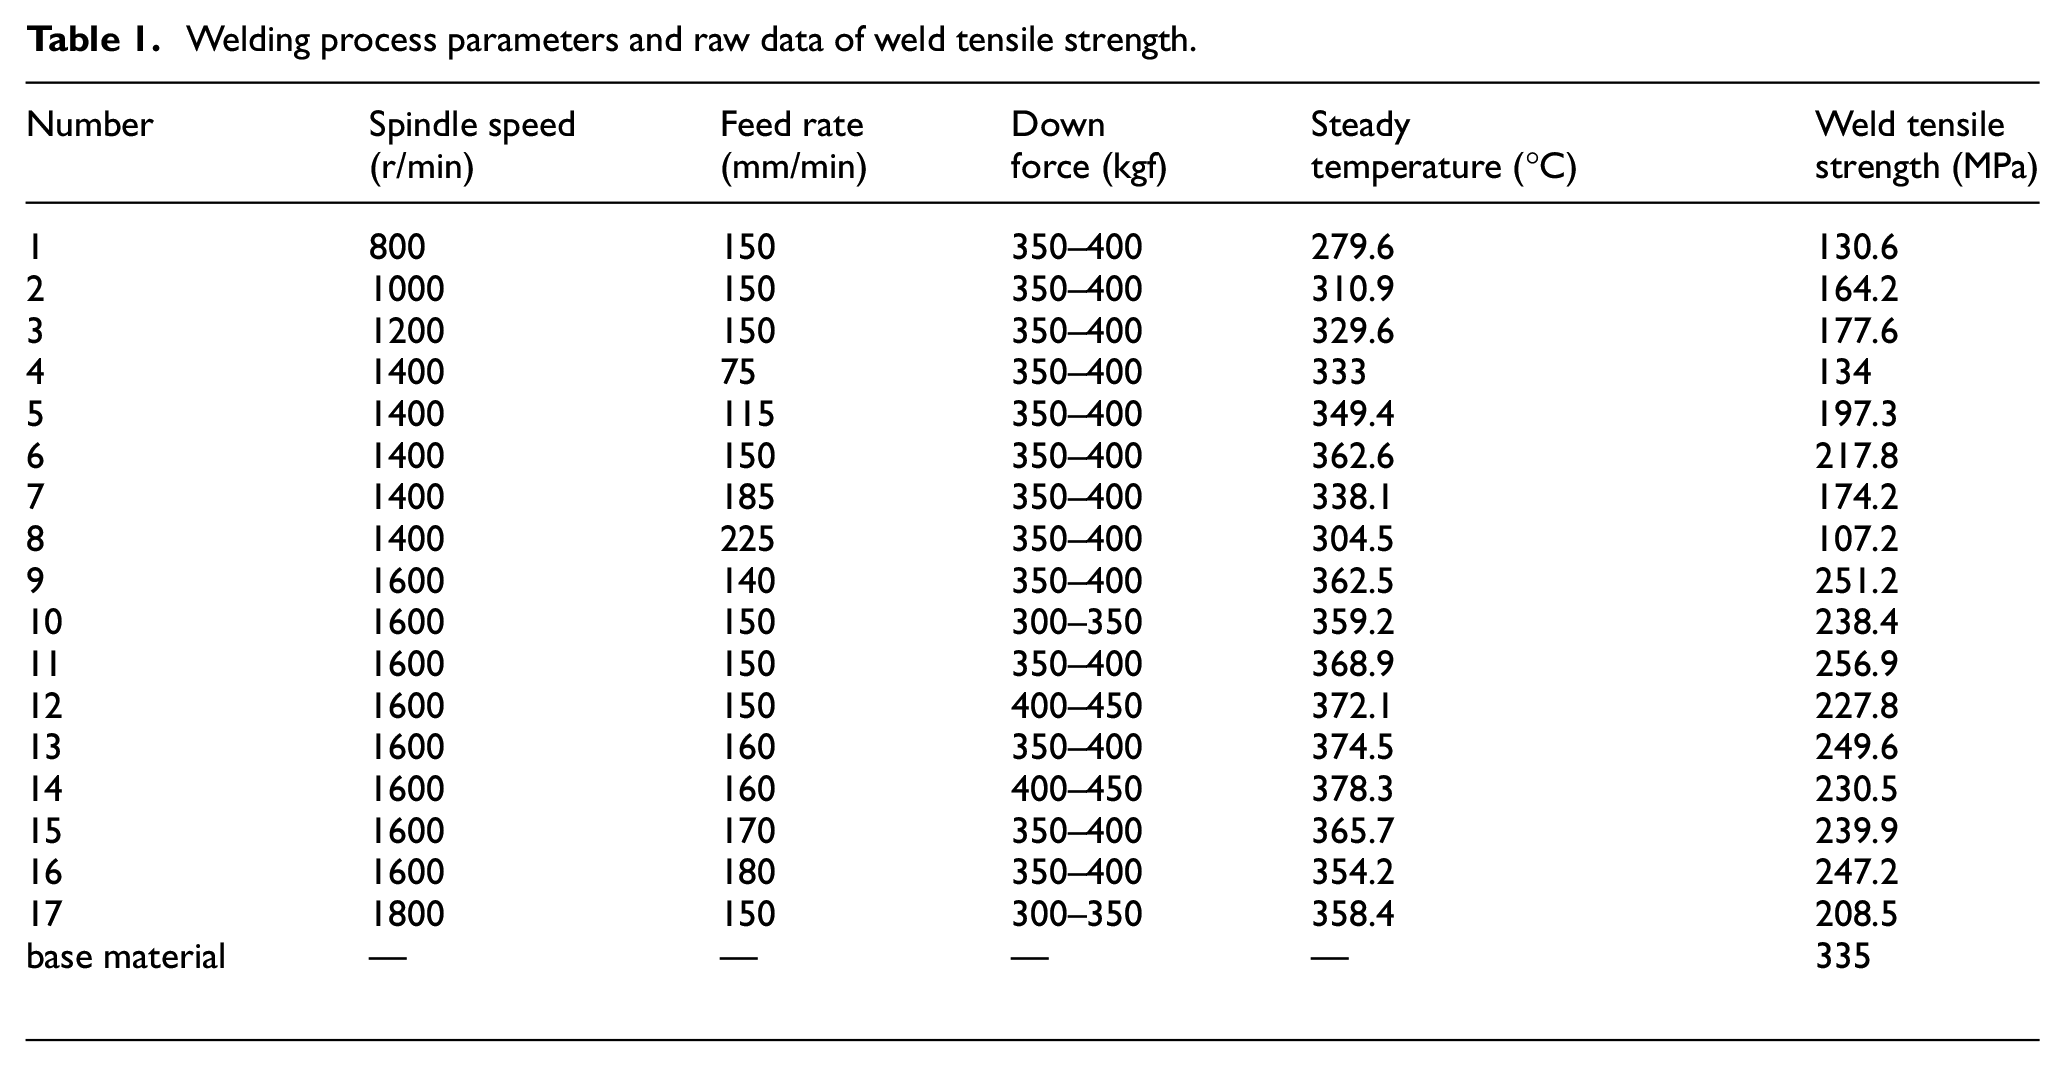
From the welding experimental data, it can be found that the tensile strength of the weld is directly proportional to the rotational speed of the welding spindle. At lower spindle speeds, the friction between the stirring head and the plate to be welded is weaker, generating less heat, resulting in lower stable welding temperatures and a lower degree of melting of the plate, thus forming welds with lower tensile strength. As the welding speed increases, the stable welding temperature tends to rise, and accordingly, the tensile strength of the weld improves. However, an increase in welding speed can lead to ineffective concentration of heat in the welding area, causing the stable welding temperature to decrease and the tensile strength of the weld to correspondingly reduce. With an increase in spindle pressure, the stable welding temperature steadily increases, but under non-rigidly support conditions, excessive spindle pressure can cause significant deformation of the plate at the weld location, or result in the expulsion of molten welding material from the weld, forming flash and reducing weld strength.
In summary, welding process parameters directly affect the temperature field during welding and the tensile strength of the weld, but the quality of the weld cannot be solely judged by the intensity of the stable welding temperature. The impact of welding process parameters on the tensile strength of the weld is interrelated, and they have a complex nonlinear relationship. Identifying the optimal welding process parameters that can form the best weld requires extensive data filtering. Therefore, this chapter will expand the range of welding process parameters obtained from simulation analysis, enlarging the scope for parameter optimization, in order to find the best welding process parameters for this equipment.
BSO-BP neural network based parameter prediction
Comparison and discussion of the prediction results
After constructing the BSO-BP neural network prediction model, it is trained using the original data obtained from experiments. To verify the predictive capability of the constructed BSO-BP neural network, both the BP neural network model and the BSO-BP neural network model are used to predict the output values for the same set of samples, the results can be seen from Figure 16,
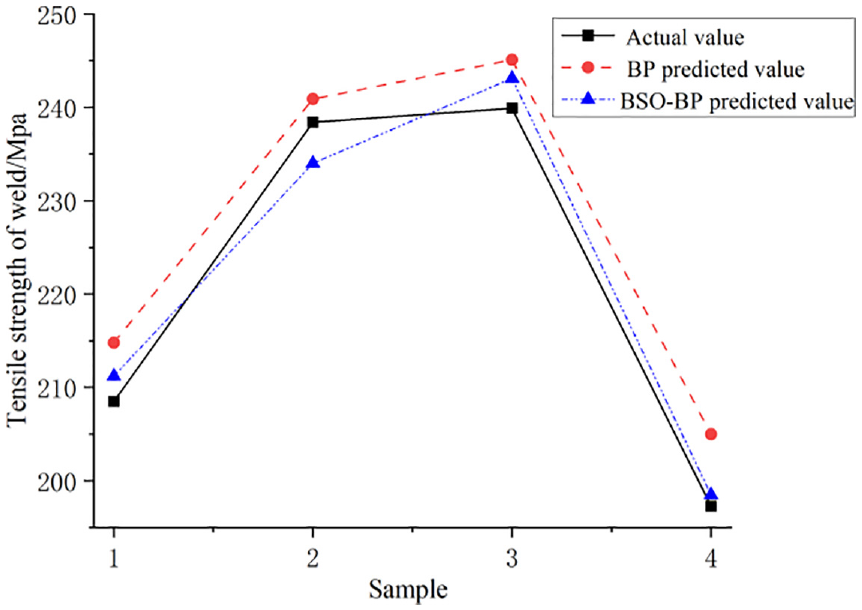
Weld tensile strength prediction results.
Compared with the BP neural network’s predictions, the BSO-BP neural network predicts the tensile strength of the welds more accurately, with a maximum error of 1.85% and a relative error of 1.27%. The predicted values are very close to the actual values, indicating that for the tensile strength of welds made by the independently developed welding equipment, the BSO-BP neural network prediction model has higher accuracy.
Optimization of welding process parameters
The BSO-BP neural network model is used to predict the tensile strength of the weld seam welded by the self-developed non-rigidly supported static-shaft shoulder stir friction welding equipment, and as a judgment criterion, the welding process parameters of the welding equipment are optimized.
The input values of BSO-BP neural network prediction model are welding process parameters. The spindle speed is selected as the network input value
By inputting different combinations of welding process parameters into the BSO-BP neural network, it is determined that under constant welding conditions, the maximum tensile strength of the welds made by the equipment can be achieved when the spindle rotational speed is 1700 r/min, the feed speed is 150 mm/min, and the downward pressure is 365 kgf, with a predicted value of 258.67 MPa.
Welding process simulation and experiments
To verify the weld quality under the optimal welding parameters predicted by the intelligent prediction model, the welding process parameters of spindle speed 1700 r/min, feed speed 150 mm/min, and downward pressure 365 kgf were used for temperature field simulation and welding repair operations. The temperature field cloud map and weld seams are shown in Figures 17 and 18.

Temperature field cloud of the weld cross-section.

Welding seam results with optimum welding process parameters.
Figure 17 shows a uniform circular platform-shaped temperature distribution in the direction of the surface weld seam thickness. The material stirring zone (SZ), heat-affected zone (HAZ), and thermal mechanical affected zone (TMAZ) exhibit a uniform temperature distribution. This uniform temperature distribution is beneficial for forming uniform grain structure in these two areas, thereby producing high-quality weld joints.
During the welding process, the travel speed of the stirring head is stable and uniform, and the spindle pressure is moderate, which can sufficiently compact the weld. There is no significant deformation of the plate during welding. The heat input from the stirring head is sufficient, and the material at the weld area is fully melted, resulting in a uniform distribution of weld material.
As shown in Figure 18, the surface of the weld obtained from welding is smooth without flash and free of defects such as grooves or cracks. The flatness of the welding surface on the opposite side indicates that overall good weld quality. (During the use of non-rigidly support welding, the stirring head produces certain vertical vibrations. The formation of fine double parallel lines is attributed to vibrations caused by the friction between the axial shoulder part and the plate.)
To confirm whether the mechanical properties of the welds obtained under the optimized welding process parameters meet on-site application requirements and whether there are defects like delamination or voids inside the joint, samples of the welds obtained from the experiments were taken for tensile testing. The sampling of the welds was consistent with Figure 13, and the tensile tests were conducted using an SHT4106-100 ton microcomputer controlled electrohydraulic servo universal testing machine.
As shown in Figure 19, the samples of the weld test specimen and the base material were subjected to tensile separately. The tensile experiments on the specimens were carried out using displacement control without setting an upper limit for the tensile force and the experiment continued until the specimen fractured, at which point the experiment was stopped.

Stress-displacement curves of the weld tensile test.
Based on the aforementioned experimental findings, it is evident that the base material exhibits a tensile strength of 335 MPa, while the weld displays a tensile strength of 262.83 MPa, representing 78.49% of the base material’s tensile strength. The experimental findings align with the predicted outcomes of the BSO-BP neural network model, indicating that the weld strength is sufficient to meet the strength criteria for the aluminum alloy car body.
For the convenience of observation under the scanning electron microscope, the base material and the weld specimen were sampled again. The macroscopic appearance of the base material and the weld specimen and their microscopic appearance under the scanning electron microscope (SEM) are shown in Figure 20(a) and (b).

Tensile test fracture microstructure: (a) base material and (b) weld specimen.
By observing the macroscopic fracture morphology of the weld seam, it can be seen that the fracture position of the weld joint specimen is located in the weld zone inside the weld seam. The fracture position forms a slightly smaller angle with the tensile axis compared to the base material. At the end of the weld seam, near the end of the stirring pin, there is a slight delamination phenomenon in the fracture area. The analysis indicates that the geometric shape of the stirring pin is trapezoidal, and its end volume is relatively small, resulting in a weaker stirring effect on the molten welding material.
Additionally, in the friction stir welding process, the heat generation mainly comes from the friction between the shoulder of the rotating pin and the welding material. Since the end of the stirring pin is far from the rotating shoulder, the heat input is low, leading to poor flowability of the surrounding welding material. The combined effect of these factors results in the occurrence of slight delamination at the end of the weld seam. The fracture of the weld specimen occurred in the upper half of the weld core area. The heat production during the welding process was adequate, and the stirring pin provided sufficient stirring. The fracture morphology appeared relatively neat and resembled the fracture of the parent material. From a fracture mechanics perspective, the fracture exhibited characteristics of ductile fracture. Upon examination of its micro-morphology, it becomes evident that there exists an irregular distribution of both large and small ligamentous fosse. This phenomenon is believed to be a result of the exfoliation of second phase particles that occurs during the process of fracture. The inclusion of second phase particles contributes to the enhancement of the weld’s tensile strength. 28 The lower portion of the weld, conversely, exhibits a higher degree of deconstructive fracture, leading to brittle fracture characteristics in that specific region. This phenomenon significantly impacts the overall tensile strength of the weld.
Through the aforementioned analysis, it is evident that the upper section of the weld joint exhibits splendid quality. However, the lower section of the weld experiences a decline in mechanical properties due to uneven heat distribution and insufficient stirring.29,30 In order to enhance the quality of the weld, future research can focus on incorporating an auxiliary heat source or improving the structure of the stirring pin. These measures can further improve the weld quality in terms of its form and overall performance.
Conclusion
This paper, with the background of online repair of C80 aluminum alloy car bodies, independently developed a non-rigidly supported stationary shoulder friction stir welding repair equipment. Through theoretical research, simulation analysis, intelligent prediction, and experimental verification, the paper optimized the welding process parameters of the welding equipment. The main conclusions and discussions are as follows:
(1) Prediction models for weld tensile strength under various welding process parameters were established using BP neural networks and BSO-BP neural networks. Predictions were conducted on the same set of parameters from the sample collection. The results demonstrate that the BSO-BP neural network prediction model exhibits higher accuracy, with a relative error of only 1.85%.
(2) Utilizing the BSO-BP neural network prediction model, the optimal welding process parameters for the device were predicted. The optimized welding parameters were then applied in an online welding experiment on aluminum alloy plates. During the welding process, the travel of the stirring head was smooth, the experimental plate showed no significant deformation, the weld surface was smooth, and the overall welding quality was good.
(3) The weld obtained from welding was sampled and analyzed in tensile tests, and it was found that the tensile strength of the weld was 262.95 MPa, which was 78.49% of the tensile strength of the base metal, similar to the predicted results. According to the welding process parameters, the tensile strength of welded joints can be predicted accurately, providing a reference for optimizing the welding process parameters of welding equipment.
Due to the complexity of the stationary shoulder friction stir welding system, optimizing welding process parameters alone may not be sufficient to significantly improve the quality of welding. To ensure the optimization of process parameters and the accuracy of model predictions, methods such as improving the structure of the stirring head and increasing the number of training samples are also effective means of enhancing welding quality. 31 This indicates that there is still room for further research in improving the welding quality of welding equipment.
Footnotes
Handling Editor: Chenhui Liang
Declaration of conflicting interests
The author(s) declared no potential conflicts of interest with respect to the research, authorship, and/or publication of this article.
Funding
The author(s) disclosed receipt of the following financial support for the research, authorship, and/or publication of this article: This work has been supported by (1) Beijing Municipal Science and Technology Program (Z161100002216005); (2) Beijing University of Civil Engineering and Architecture “Twin Towers Program” (YXZJ20220807).