
Abstract
The average time between failures of Chinese combine harvester was far below the advanced combine harvester in Europe and America. A load test system was designed and built on the transmission structure of combine harvester. The dynamic load of the transmission structure was tested on rice harvesting in the field and used to compare with calculated values of maximum load capacity. The damage mechanism and load distribution of transmission structure would be obtained. The test results showed that the average and peak power consumptions of each working part increased with the increase in the speed of the combine harvester. As the stubble height increased, the average and peak power consumptions of each component correspondingly increased with the increase in the load on the entire machine. The power consumptions of the left and right half shafts of the chassis gradually increased, whereas the power consumptions of the other components did not change significantly. The power consumption of the intermediate shaft ranged from 29.53 to 35.92 kW, and the average power consumption was 34.03 kW when harvesting was done at full load in the field. The limit power consumptions of the left and right half axles of the chassis were 9.35 and 11.55 kW.
Introduction
The transmission system of a combine harvester distributes and transmits the power generated by the engine to the working parts such as the walking system, header, conveying trough, threshing separation device, and cleaning device. During normal harvesting operations, the performance of its drive system was closely related to the harvesting efficiency, and the torque is the main load acting on the drive components of the combine harvester, the efficiency and lifespan of this type of harvester were low. 1
In recent years, extensive research had been conducted on combine harvesters under loads applied during maneuvering. Li et al. 2 developed the parametric modeling of the combine harvester Julong-280 chassis frame using the three-dimensional modeling software UG. After meshing, the modal parameters as well as the modal vibration shapes were calculated utilizing the NX Nastran. Based on the comparative analysis of the characteristics of the natural frequency and the external excitation frequency of the frame, the structural optimization scheme was proposed. Ning et al. 3 summarized the research status of air and screen cleaning device of grain combine at home and abroad, and the development trend of air and screen cleaning device of grain combine is put forward. Heuler and Klatschke 4 studied a linear cumulative fatigue damage mechanism of mechanical structures by testing the dynamic loads during crop harvesting. Stellmach et al. 5 used a torque sensor to measure and evaluate the load of the walking chassis of a self-propelled forage harvester, and the stress signals were counted through the rainflow algorithm for damage calculation. Friesen et al. 6 designed a control system that can adjust the machine walking speed to control its feed amount based on the drum torque and studied the relationship between the feed amount and the threshing loss rate. Pytka et al. 7 built a test system that can be used under off-road conditions. The system included four-wheel dynamometers, a steering robot, a differential GPS system, an inertial platform, a noncontact vehicle speed sensor, and an on-board computer. Typical vehicle dynamic tests were conducted, 8 and a high-precision tractor test system was developed to detect and measure the various performance parameters of tractors and implement systems. Sudajan et al. 9 conducted an experimental study on the influence of the rotation speed and feed amount of the threshing drum of the combine harvester on grain damage. The grain threshing damage increased with the increase in the threshing drum rotation speed and feed amount.
The above results had showed that the dynamic load of a combine harvester during operation is an important factor affecting its reliability, 10 and the dynamic load observed during actual operation was inconsistent with the test bench results. Combine harvester manufacturers had conducted numerous field experiments, including load tests on traveling half shafts during operation, providing a theoretical basis for improving their design. Wang et al. 11 experimentally obtained the temporally varying data of the instantaneous rotational speed for an aircraft wheel at the instant of its contact with the test platform, using a noncontact photoelectric testing method. Moreover, the kinetic relationship between the transient rotational speed of the aircraft’s wheel and the horizontal impact force was established.
In this study, a crawler-type combine harvester was used as a test prototype, and based on the advanced load testing technology established at home and abroad, a wireless load testing system for collecting load signals from the chassis and header of the combine harvester and a wired load testing system for collecting the load signals from each working part were constructed. The dynamic load of the transmission structure was tested on rice harvesting in the field and used to compare with calculated values of maximum load capacity, the damage mechanism, and load distribution of transmission structure obtained.
Drivetrain analysis
Transmission structure and parameters
Transmission system structure
A crawler-type combine harvester adopts a double-horizontal axial-flow threshing separation structure and a cleaning method involving a single centrifugal fan and a double-layer vibrating screen, which is suitable for harvesting crops such as rice and wheat. Combine harvester mainly includes a reel, cutter, feeding auger, conveying trough, No. 1 threshing drum, No. 2 threshing drum, fan, cleaning screen, crawler-type walking chassis, and other components, which was showed in Figures 1 and 2.
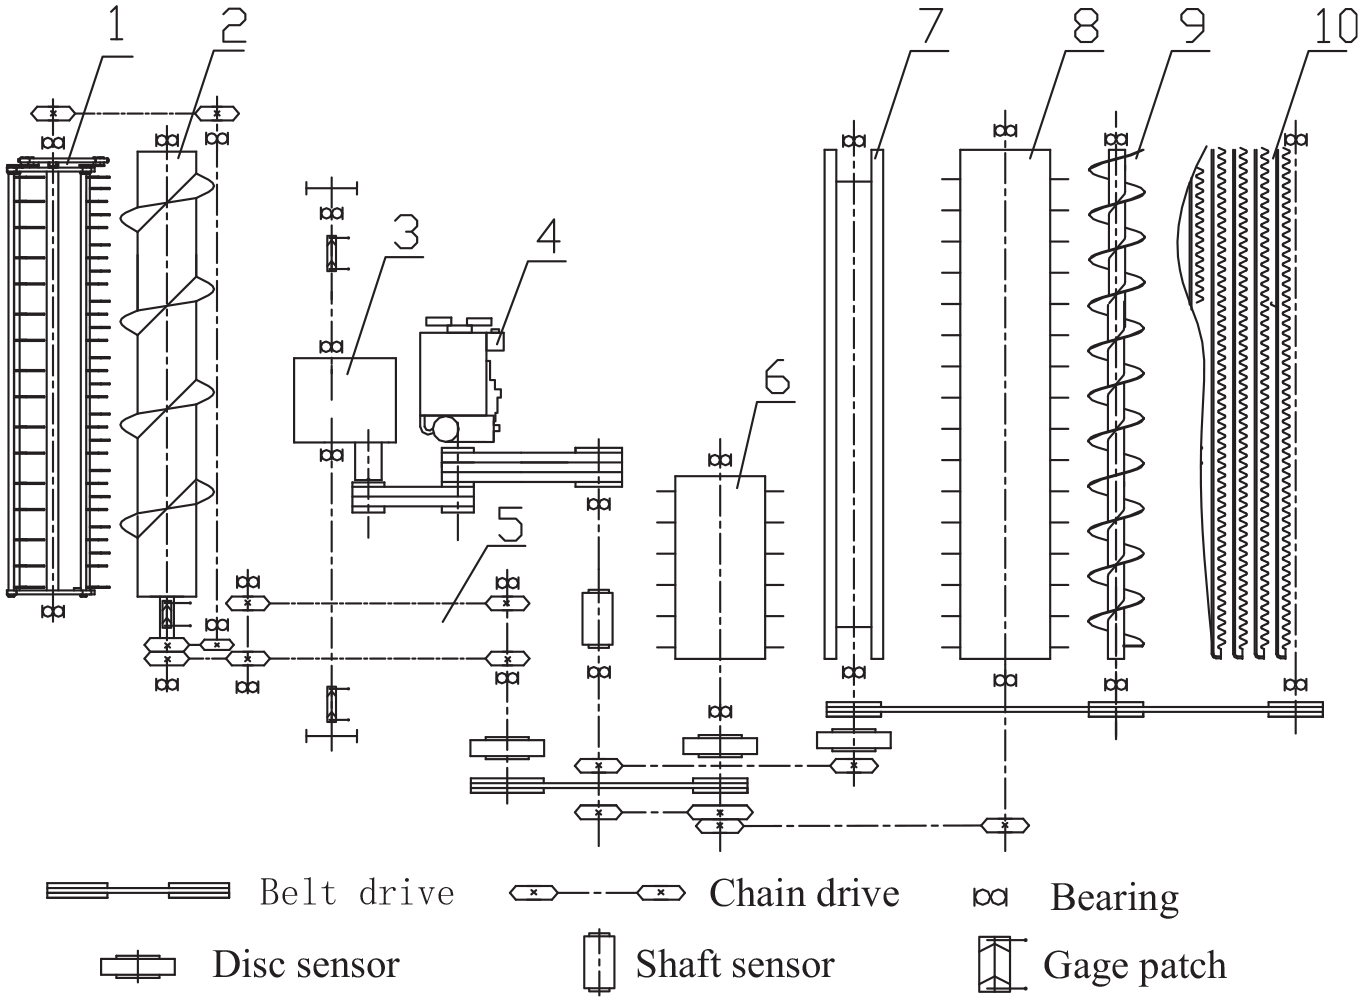
Transmission diagram of the main working parts of a combine harvester.

Schematic of the driving system of a crawler-type combine harvester.
A crawler-type combine harvester mainly realized power transmission through the transmission shaft, chain drive, and belt drive. A part of the power generated by the engine was transmitted to the hydraulic continuously variable transmission, which transmitted the power to the left and right drive axles of the walking chassis through the gearbox, and these axles were connected to the combine harvester. The left and right crawler belts help the machine to crawl; another part of the power generated by the engine was outputted through the intermediate shaft, and a part of the power of the intermediate shaft was transmitted to No. 1 and No. 2 threshing drums and then through the No. 1 threshing drum shaft. The trough, the main shaft of the inclined trough, transmits part of the power to the header to drive the reel, feeding auger, and cutter, while another part of the power of the intermediate shaft was transmitted to the cleaning centrifugal fan, horizontal feeding auger, double auger, vibration cleaning screen, etc.
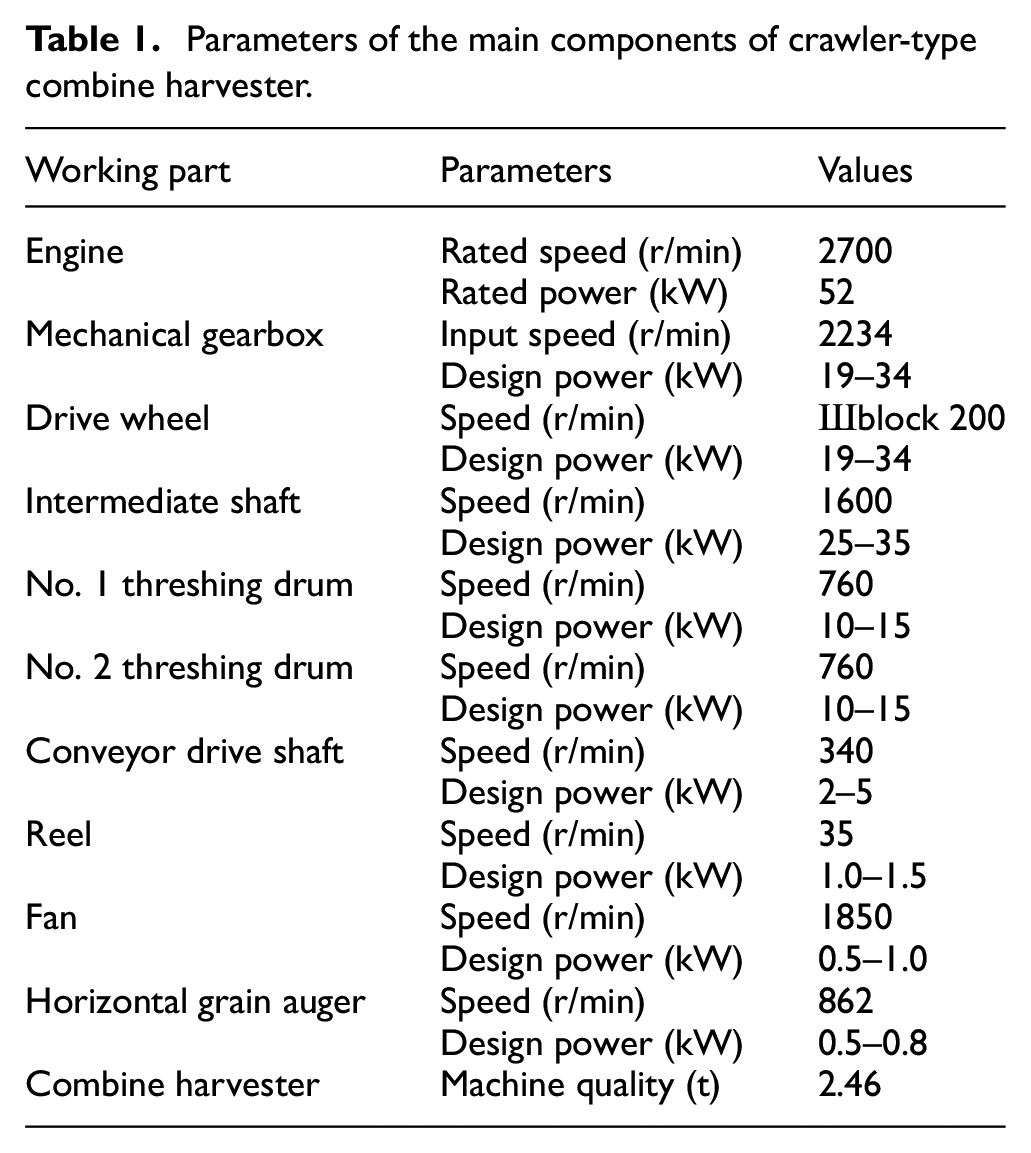
Parameters of the main components of the transmission system
To drive the main working components of a crawler-type combine harvester, such as the header, inclined conveying trough, No. 1 threshing drum, No. 2 threshing drum, the intermediate shaft, and the walking chassis, the operational reliability of the existing crawler-type combine harvester was accurately analyzed and calculated. First, the design of the chain drive, drive shaft, and belt drive of an existing crawler-type combine harvester was calculated and checked, and a crawler-type combine harvester was obtained through calculation and statistics. The parameters of the main working parts of the harvester was presented in Table 1.
Parameters of the main components of crawler-type combine harvester.
In the drive system of a combine harvester, the power distribution of each step was critical, including the cutting, feeding, conveying, threshing, separation, and cleaning of rice stalks. If any link fails, it would affect the harvest rate of the harvester. Therefore, when the combine harvester was working normally, all the links in the transmission system should bear the corresponding load. To ensure the operational reliability and trouble-free working of the crawler-type combine harvester in the field, it is necessary to calculate the load of each main transmission component acting on the harvester.
Belt strength calculation
The design criteria of the belt drive were as follows: under the condition that the belt drive does not slip, it had a certain fatigue strength and life, and the rated power

In the formula,
Based on the transmission structure of the crawler-type combine harvester showed in Figure 1, the basic parameters of the main transmission belts of each link of the harvester were showed in Table 2.
Basic parameters of the belt drive.

Based on the basic parameters of the belt drive provided in Table 2, the basic rated power
Calculation results of the power of the main drive belt.

Transmission chain strength calculation
The intermediate shaft to the input end of No. 1 threshing drum shaft, No. 1 threshing drum to the input end of No. 2 threshing drum shaft, the input end of the No. 1 threshing drum shaft to the input end of the main shaft on the conveying trough, and the output end of the header drive shaft to the header were checked. The rationality of the design of the four chain drives at the input end of the auger was determined, and the allowable power of the four chain drives was calculated. The basic parameters of the four chain drives were showed in Table 4.
Basic parameters of the chain drive.

The actual allowable power of the chain drive could be expressed as follows:

In the formula,
Calculation results of the allowable power of the chain drive.

Drive shaft strength calculation
The stress acting on the header transmission shaft, inclined conveying trough main shaft, No. 1 threshing drum shaft, and No. 2 threshing drum shaft during operation was calculated. The driving shaft of each working part was mainly affected by the torque during rotation, resulting in a torsional shear stress. The formula for calculating the maximum shear stress was:

In the formula, T was the torque acting on the transmission shaft, N m;

In the formula, D was the cross-sectional diameter of the shaft. From equation (3), it could be found that:

From this, the design torque T of the transmission shaft could be obtained as:

The Calculation results of the shear stress was showed in Table 6, including the maximum torque of each transmission shaft calculated using equation (6).
Calculation results of the shear stress of the main drive shaft of the combine harvester.

The maximum torque of each drive shaft and the rated speed was used to design for the corresponding working parts; The calculation results of the rated power consumption was showed in Table 7.
Calculation results of the rated power consumption of the drive shaft of the combine harvester.

According to Table 7, we found that the power that could be carried by the left and right half shafts of the walking chassis of the combine harvester was lower than the theoretical design power consumption range. However, the driving shaft of the header, the main shaft of the conveying trough, the shafts of the No. 1 and No. 2 threshing drums, and the output intermediate shaft could carry significantly more power than the theoretically designed power consumption.
Load testing system construction
Test rice material
The tested rice (Oryza sativa L. rice cultivar “zhendao10”) was grown in Danyang of Jiangsu Province, China. The average moisture content of the stalks was 68%, the average grain moisture content was 24%. The complete parameter estimation procedure and the results of all tests were repeated five times to reduce the impact of random influence on choice of training and validation set. The average data were analyzed statistically using a factorial design in SPSS software (version 13.0, SPSS Inc., CA, USA), then average results were compared by least significant difference (LSD) post-hoc test at the 5% significance level (p < 0.05).
Dynamic load test method
In order to develop field dynamic load test system, HAD-CYB-807S disc torque sensor (Beijing Westzh M & E Technology Co., Ltd., China. measurement accuracy of 0.25% FS and frequency response time of 100 μs), HAD-CYB-803S shaft torque sensor (Beijing Westzh M & E Technology Co., Ltd., China. measurement accuracy of 0.25% FS and frequency response time of 100 μs), gage patch (BE120-4AA(11) resistance strain gauges119.9 ± 0.1 Ω and MF-G14 silicone), and hall speed sensor (CHE18-15N11-HZF710) were used to test the torque and speed signals. Installation location and installation results of torque and speed sensor were showed in Figure 3. Based on the DH-5905 wireless torque and speed signals test method of WiFi wireless technology 13 and the DH-5902 wired torque and speed signals test method were showed in some studies. 14

Field dynamic load test system.
Resistance strain gage load test system of reel cutting device was showed in Figure 4. HAD-CYB-807S disc torque sensor load test system of threshing cylinder was showed in Figure 5. HAD-CYB-803S shaft torque sensor load test system of engineering transmission shaft was showed in Figure 6. Resistance strain gage load test system of vibrating and cleaning device was showed in Figure 7. Resistance strain gage load test system of chassis drive axle was showed in Figure 8.

Resistance strain gage load test system of transmission shaft.

Disc torque sensor load test system of transmission shaft.

Shaft torque sensor load test system of transmission shaft.

Resistance strain gage load test system of sprocket wheel.
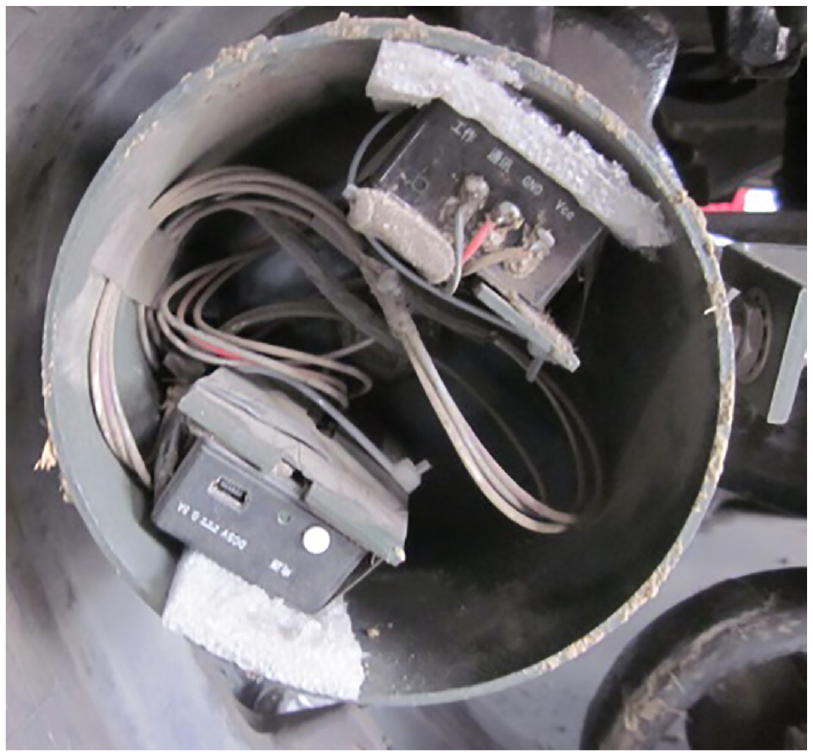
Resistance strain gage of chassis drive axle with DH-5905 wireless signals acquisition system.
All the torque and speed signals were collected by the DH-5902 wired or DH-5905 wireless torque and speed signals acquisition system.15,16 The torque and speed signals were sent to a laptop by a wireless card.
Calibration of wireless load test components
In order to establish the correspondence between the torque transmitted during the operation of the crawler combine harvester and the output voltage signal, the torque measurement module needed to be calibrated. The Equation of the calibration theory was showed in formula (7).

Where, T was the torque value; V was the bridge output voltage.
Because the structure of the combine harvester was asymmetrical, the load applied to the left and right axles was different. The left and right half axles needed to be loaded and unloaded three times respectively. Standard torque was given by standard weights, at the same time the voltage output values were measured. The weight was gradually changed to obtain a corresponding set of voltage values. Finally, using Excel software to fit the calibration data, the trend line and calibration equation were obtained. The fitting straight line equation of the left and right half axle forward rotation calibration is showed in Figure 9.

Forward rotation calibration equation of half axle: (a) half axle torque calibration test scene photo, (b) forward loading calibration equation of the left half axle, and (c) forward loading calibration equation of the right half axle.
Field load test on the combine harvester
Through the calculation of the main transmission system of the crawler-type combine harvester, the power that the belt, chain, and shaft of the main transmission parts could carry was obtained. However, the actual load carried by each main working part of the combine harvester when harvesting in the field and the corresponding power consumption and maximum limit power that needed to be carried under special working conditions were unknown. The power consumption under harvesting conditions was important for the design of the transmission parts of the harvester. For this purpose, the power consumptions of the header, conveying trough, and engine were selected. The power consumptions of the intermediate shaft, first and second threshing cylinders, cleaning system, and left/right semi-axis of the walking chassis were used as the main measurement parameters to conduct field load tests. The tests include load influencing factor tests and full load tests. In the former, a field comparative test was conducted on the forward speed, stubble height, and grain tank load, which affected the load distribution of the combine harvester. The power consumptions of the main working parts of the machine at full load and the limit power consumption under special working conditions were calculated.
Test and analysis of load influencing factors
When the combine harvester was being operated in the field, the loads of each working part were affected by the forward speed of the harvester (feeding amount), the stubble height (grass-to-grain ratio), and the condition of the walking surface. To test the main factors affecting the load of the combine harvester, referred to “General Provisions on Methods for Determining Test Conditions of Agricultural Machinery” (GB/T5262-2008), this study set the following test conditions under various combined harvesting conditions to collect torque and speed, such as low speed (0.45 m/s), medium speed (0.66 m/s), high speed (0.98 m/s), full grain box (1.1 t), half grain box (0.62 t), empty grain tank (0.14 t), low stubble (20 cm), medium stubble (30 cm), and high stubble (40 cm). The corresponding power consumptions were then calculated. The average moisture content of the rice grains was 24%, the moisture content of the stems was 72%, and the moisture content of the soil was 30%; each group of experiments was repeated twice during the test, and the average value was taken.
Walking speed test
When the combine harvester operated in the field, the harvesting length corresponding to field walking was 25 m, and the forward speed was calculated by recording the walking time within the range of 25 m. When harvesting in the field, three speed settings, namely low speed (0.45 m/s), medium speed (0.66 m/s), and high speed (0.98 m/s), were used for harvesting. The state of the granary was empty, and the stubble height was low. The torque and speed signals of the header, conveying trough, engine intermediate shaft, No. 1 threshing drum, No. 2 threshing drum, and the left and right half shafts of the walking chassis were collected. The corresponding power consumption values were computed.
The values of the intermediate shaft, conveying trough, No. 1 threshing drum, No. 2 threshing drum, and cleaning system were collected by the wired testing system when the crawler-type combine harvester was being operated in the field, as well as the values of the header and the left half of the chassis collected by the wireless load testing system. The output voltage signals of the shaft and the right half shaft of the chassis were substituted into the calibration equation to calculate the average loads at different forward speeds, as showed in Table 8.
Effect of forward speed on the average load (kW).

As showed in Table 8 the forward speed influenced the intermediate shaft, header, conveying chute, No. 1 threshing drum, No. 2 threshing drum, cleaning system, and left and right half shafts of the walking chassis. As the forward speed of the combine harvester increased, the average and peak power consumptions of each working part increased accordingly.
Effect test of stubble height
To study the effect of the stubble height (grass-to-grain ratio) on the load of the combine harvester during field harvesting, the forward speed was set as the medium speed, the granary was empty, and the load test was conducted under three harvesting conditions, such as low stubble (20 mm), medium stubble (30 mm), and high stubble (40 mm). The different stubble heights during field harvesting were showed in Figure 10.

Different rice stubble heights: (a) low stubble, (b) medium stubble, and (c) high stubble.
The collected output voltage signals of the intermediate shaft, header, conveying chute, No. 1 threshing drum, No. 1 threshing drum, cleaning system, and chassis left half/right walking half shafts were substituted into the calibration equation to calculate the corresponding average loads, as showed in Table 9.
Effect of different stubble heights on the average load (kW).

From Table 9, with the increase in the stubble height, the peak power consumptions of the intermediate shaft, header, conveying chute, No. 1 threshing drum, No. 2 threshing drum, and left and right half shafts of the chassis decreased.
Machine load impact test
To study the effect of the load of the entire machine (the weight of the grain in the grain box) on the load of the combine harvester in the field, three field harvests of rice were conducted under different load conditions, such as empty bin (0.14 t), half bin (0.62 t), and full bin (1.1 t). The collected output voltage signals of the intermediate shaft, header, conveying chute, No. 1 threshing drum, No. 2 threshing drum, cleaning system, and left and right half shafts of the chassis were substituted into the calibration equation to calculate the different machine loads. The calculated average loads was showed in Table 10.
Effect of different machine loads on the average load (kW).

As showed in Table 10, as the grain stored in the grain tank increased in volume (the load of the combine harvester increases), under the same working conditions, the power consumptions of the intermediate shaft, header, conveying trough, No. 1 threshing drum, and No. 2 threshing drum increased whereas the power consumption of the cleaning system did not change significantly. However, with the increase in the load of the entire machine, the power consumptions of the left and right half shafts of the chassis gradually increased.
Road condition impact test
A fast-running chassis load test was conducted under four driving conditions (sandy road, cement road, field soft mud road, and dry mud road). The chassis load test surface of the combine harvester was showed in Figure 11(a) when moving straight ahead on a gravel road. The chassis load test surface of the combine harvester was showed in Figure 11(b) when moving quickly on a cement road.

Test road conditions: (a) gravel pavement, (b) cement pavement, (c) soft mud pavement, and (d) dry dirt pavement.
The chassis load test ground was showed in Figure 11(c) when the combine harvester was fully loaded and was running on a soft mud road in the field. The chassis load test ground was showed in Figure 11(d) when the combine harvester was moving on a dry dirt road.
The collected output voltage signals of the left and right axle shafts of the chassis were substituted into the calibration equation to calculate the average loads at full load, as showed in Table 11.
Influence of different pavements on the average loads of the left and right half axles (kW).

From Table 11, it could be found that the power required by the combine harvester was the highest when moving on the soft mud road, and the power consumption of the right half shaft was slightly greater than that of the left half shaft.
Tests under different walking speed
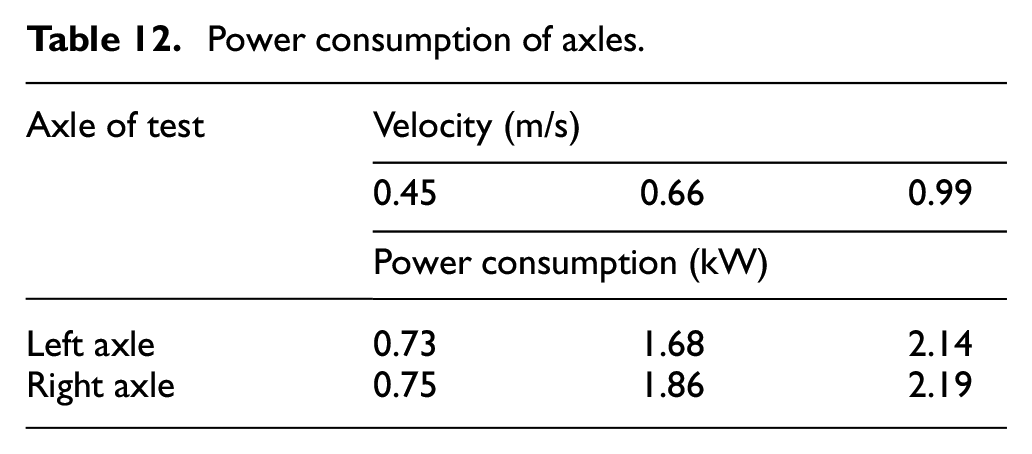
The length of the test was 25 m, and the granary was empty. The change of harvester speed was obtained by controlling the gear position. At the same time, the torque and speed signals of the left and right axles of the walking chassis were collected. After data processing, the relationship between power consumption and speed was obtained. And the result was showed in Table 12. Effect of different forward speeds was showed in Figure 12.The data bar distribution diagram was showed in Figure 13.
Power consumption of axles.
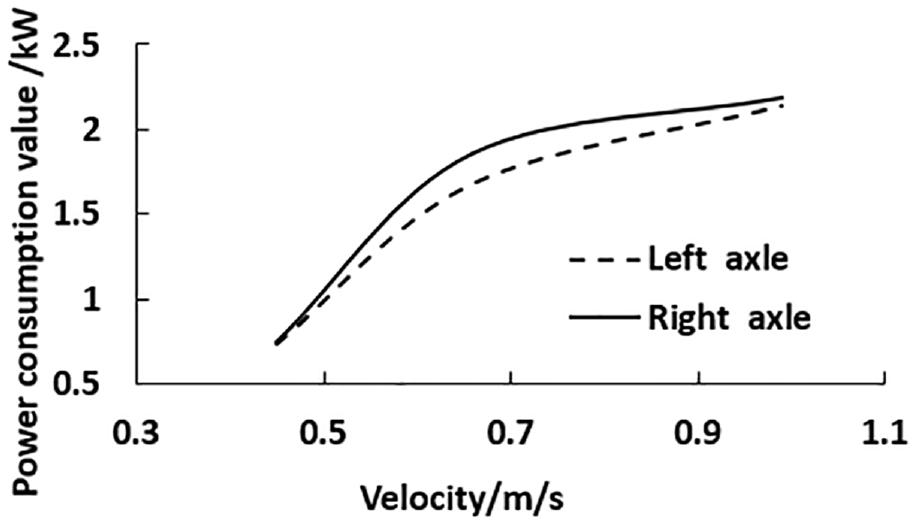
Effect of different forward speeds.
The data bar distribution diagram.
When the speed of the combine harvester was increased, the power transmitted by the half axle was increased accordingly. The power consumption of left and right axles increased correspondingly, and they were approximately equal.
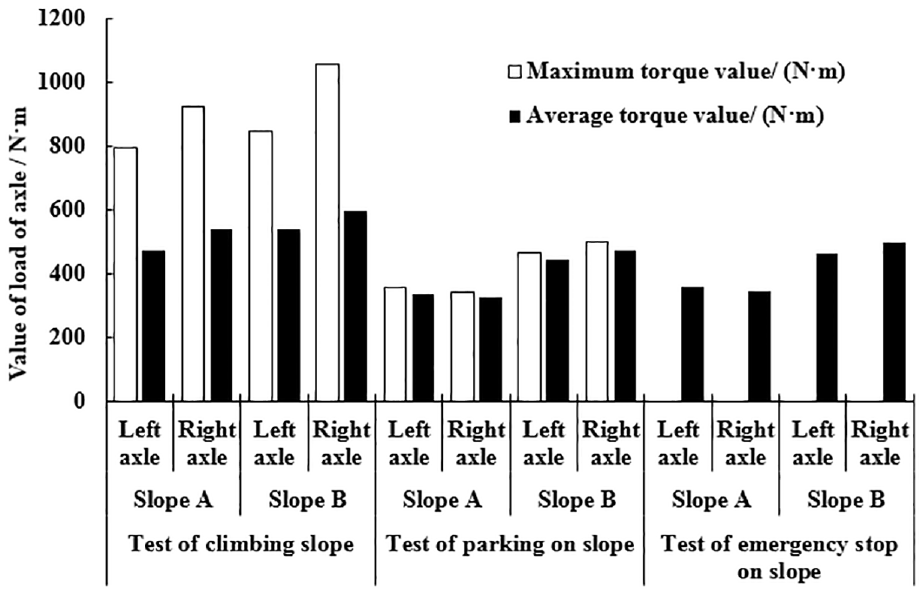
By comparing the data in Figure 13, the results were that: (1) when the slope angle was increased, the torque of axles would increase under the tested conditions. The increase of the slope angle of the climbing test would result in the average torque of the left and right axles increasing by approximately 10%. In the parking and emergency stop experiments, the increase of the slope angle would increase the average torque of the left axle by about 30%, and the average torque of the right axle would increase by about 45%. (2) When the slope angle was the same, taking the slope B as an example, the average working torque of the climbing slope test of the left and right half axles was increased by about 20% compared with the parking and the emergency stop condition. And the load of parking condition is similar to the emergency stop condition. (3) Under the three conditions, the load on the right half axles was greater than the load on the left one.
Ultimate load test of each component
Harvest ultimate load test
When the combine harvester was harvesting in the field, each working part was subjected to different speed (low speed (0.45 m/s), medium speed (0.66 m/s), and high speed (0.98 m/s)) and full grain box (1.1 t) loading. The load test under different combination conditions of half grain tank (0.62 t), empty grain tank (0.14 t), low stubble (20 cm), medium stubble (30 cm), and high stubble (40 cm) showed that the high speed, full-load, and low-stubble harvesting condition required the highest load. Therefore, five full-load, high-speed, low-stubble harvesting tests were conducted at intervals to test the normality of the intermediate shaft, header, No. 1 threshing drum, No. 2 threshing drum, and cleaning system. The load and peak load at the time of harvest and the average test results are showed in Table 13.
Average power consumption of the components of the combine harvester when working at full load (kW).
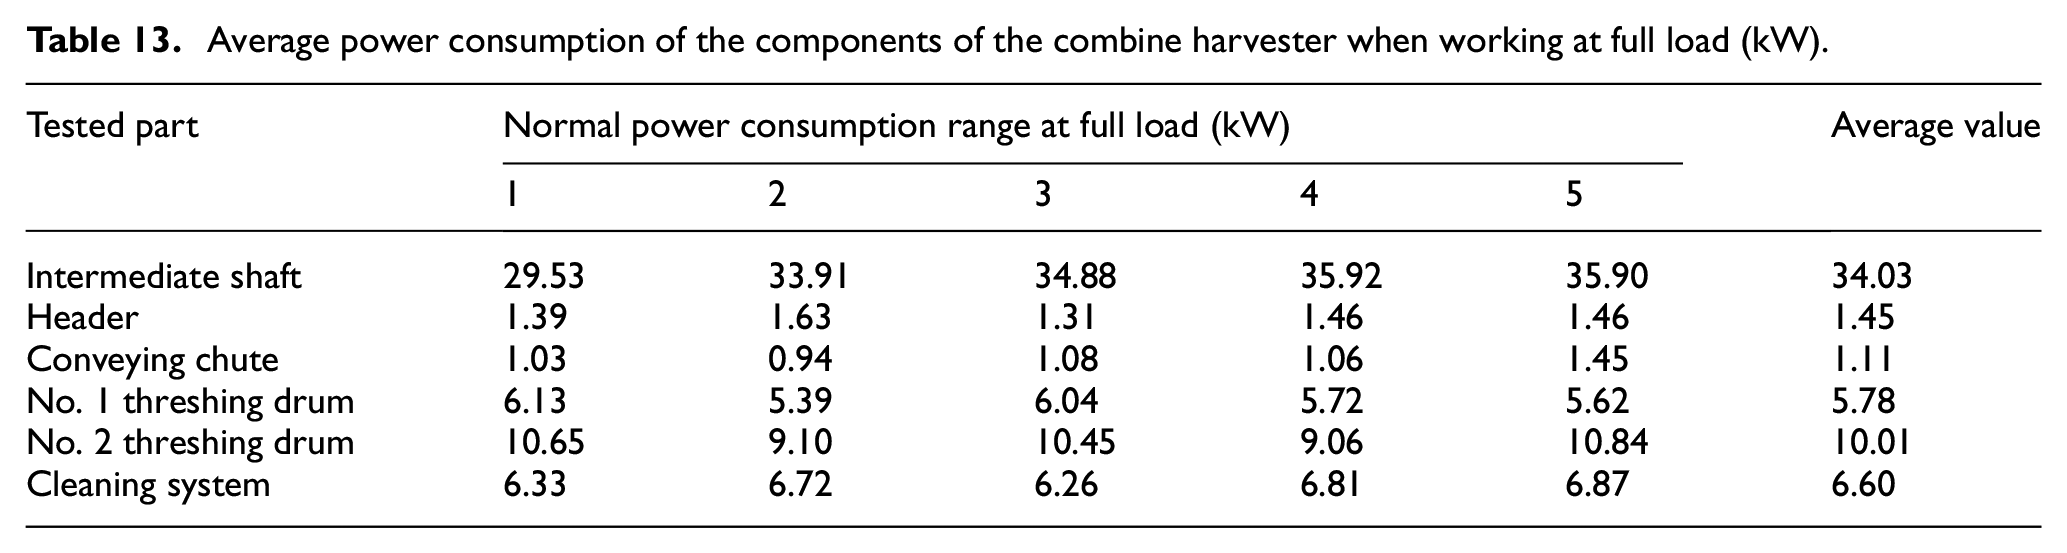
The power consumption distribution of the crawler-type combine harvester when harvesting at full load in the field was showed in Table 13.The power consumption range of the intermediate shaft was 29.53–35.92 kW, and the average power consumption was 34.03 kW. The power consumption range of the header was 1.31–1.63 kW, and the average power consumption was 1.45 kW. The power consumption range of the conveyor trough was 0.94–1.45 kW, and the average power consumption was 1.11 kW. The power consumption range of the first drum was 5.62–6.13 kW, and the average power consumption was 5.78 kW. The power consumption range of the drum was 9.06–10.84 kW, with an average power consumption of 10.01 kW. The power consumption range of the cleaning system was 6.33–6.87 kW, with an average power consumption of 6.60 kW.
Chassis ultimate load test
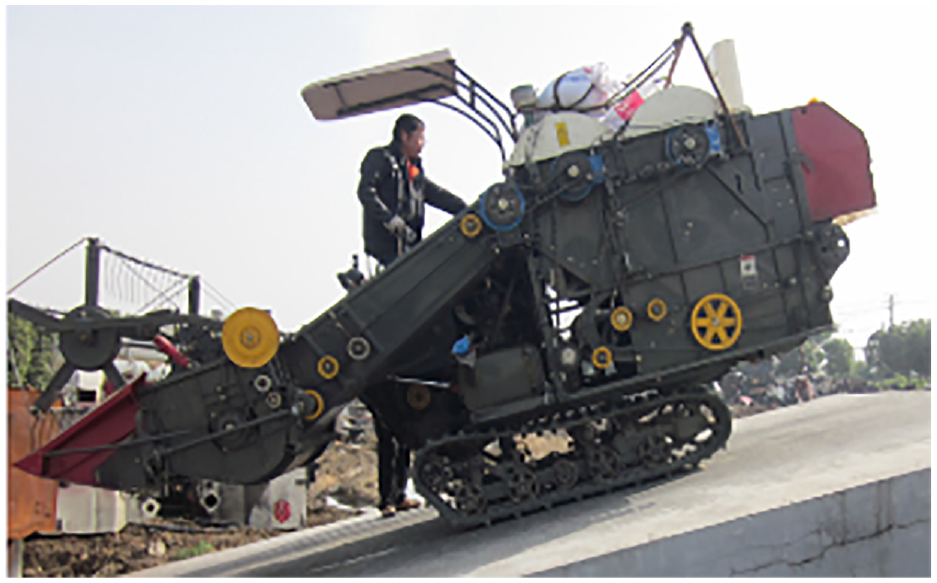
The average and ultimate loads required by the left and right drive shafts of the chassis were tested when the chassis of the combine harvester was under full and empty load conditions and under low-speed conditions, medium-speed conditions, and high-speed conditions. The crawler-type combine harvester was fully loaded on a 13° ramp (as showed in Figure 14), fully loaded and turned on dry ground (as showed in Figure 15), and quickly moved straight on a muddy ground. Load tests were conducted on sandy roads, cement roads, etc.
Climbing a 13° slope backwards at full load.

Turning in place at full load.
The average power consumption tested results of the chassis when the crawler-type combine harvester was fully loaded were showed in Table 14.
Average power consumption test results of the chassis (kW).

Transmission system calibration of combine harvester
The power of the engine on the combine harvester was mainly distributed to the working parts such as the walking chassis, header, conveying trough, threshing and separating drums, and cleaning device. To withstand the extreme working conditions of each working part, it was necessary to check the design value and ultimate load of the main transmission parts and compare whether the main transmission parts meet the requirements.
The dynamic loads of working parts were tested at forward speed of 0.98 m/s and stubble height of 20 cm. The torque signals of every transmission shaft were recorded in laptops. The torque signals were showed in Figure 16. The rotation speeds of each transmission shaft were in a fluctuation range of ±10 rpm.

Dynamic torque signals of working parts.
Strength evaluation of the transmission chain of combine harvester
To compare the reliability of the chain transmission of the main transmission components, the parameter values of the intermediate shaft to the input end of No. 1 threshing drum shaft, the intermediate shaft to the input end of No. 2 threshing drum shaft, and the input end of the No. 1 threshing drum shaft were calculated. The allowable powers of the four chain drives from the end to the input end of the main shaft of the conveying trough and the output end of the header drive shaft to the input end of the header auger were compared with the test results. The comparison results were showed in Table 15.
Comparison between calculated and measured allowable loads of the chain drive.

Transmission belt strength evaluation of combine harvester
The allowable powers of the transmission belt between the main shaft of the conveying trough and the transmission shaft of the header, the transmission belt between the auger and the tube shaft of the reel, and the transmission belt between the intermediate shaft and the auger shaft of the fan were compared, as showed in Table 16.
Comparison between calculated and measured allowable loads of the belt drive.

Optimization of the transmission system of combine harvester
Through the load calculations of the header, conveying trough, engine intermediate shaft, No. 1 threshing drum, No. 2 threshing drum, cleaning system, belt, shaft, and chain in the left/right half shaft transmission system of the walking chassis and a comparison with the average and limit power consumptions under full-load harvesting measured in the field, it was found that some of the belts could not meet the limit requirements for harvesting, the power consumption of some of the chains was too low to meet the normal harvesting requirements, and some of the axes could not meet the extreme requirements of harvesting. The belt, shaft, and chain of the combine harvester should be improved on the basis of the field load test results.
Improvement and optimization of the drive belt of combine harvester
From the verification of the transmission system in the fourth section, it could be concluded that the belt between the auger and the shaft of the reel and that between the intermediate shaft and the auger shaft of the fan could be improved. As showed in Table 17.
(1) The actual full-load average power consumption of the belt between the auger and the reel tube shaft was 0.24 kW, the maximum peak value was 0.46 kW, and the design power consumption of the belt was 0.96 kW. Because the power consumption of the reel is stable and the fluctuation frequency was low, the belt here could be changed to an A-type belt; the basic rated power
(2) The actual full-load average power consumption of the belt between the intermediate shaft and the fan auger shaft was 6.60 kW, the maximum peak value was 21.63 kW, and the design power consumption of the belt was 13.78 kW. The belt here could not meet the peak power consumption requirements. The C-type double-belt could be chosen, with basic rated power
Basic parameters of the belt drive to be improved.

Improvement and optimization of the drive chain of combine harvester
The design of the chain between the intermediate shaft and the shaft of the No. 1 threshing drum and the chain between the shafts of the No. 2 threshing drum was unreasonable. As showed in Table 18 .
Basic parameters of the chain drive to be improved.

The chain between the intermediate shaft and the shaft of the No. 1 threshing drum could withstand a power of 25.06 kW. The measured full-load normal working power consumption was 18.35 kW, and the peak power consumption was 36.17 kW. The power that the chain between the No. 1 threshing drum and the No. 2 threshing drum shaft could withstand is 25.06 kW, the measured full-load normal working power consumption was 10.01 kW, and the peak power consumption was 28.52 kW.
(1) A single row of 16A chains was used between the intermediate shaft and the No. 1 threshing drum shaft:
(2) Since the No. 1 and No. 2 threshing drum shafts and the intermediate shaft and the No. 1 threshing drum shaft were connected via chain links, the selection of the chain should follow the standard of the chain between the intermediate shaft and the No. 1 threshing drum shaft.
Improvement and optimization of the drive shaft of combine harvester
Based on the verification of the transmission shaft in Section “Field load test on the combine harvester,” the header transmission shaft and No. 2 threshing drum shaft can be improved. The main parameters were showed in Table 19.
Main parameters of shaft to be improved.

The following improvements can be made to the header drive shaft and No. 2 threshing drum shaft:
(1) Considering the economy, the diameter of the header drive shaft could be appropriately reduced, or other materials, such as 35# steel, can be selected.
(2) For the No. 2 threshing drum shaft, the diameter of the shaft could be appropriately increased, or 45# steel can be used.
Power distribution of each working parts in rice harvesting could be obtained and showed in Figure 17. Peak power of each working parts in rice harvesting could be obtained and showed in Figure 18.

Power distribution of each working parts in rice harvesting.
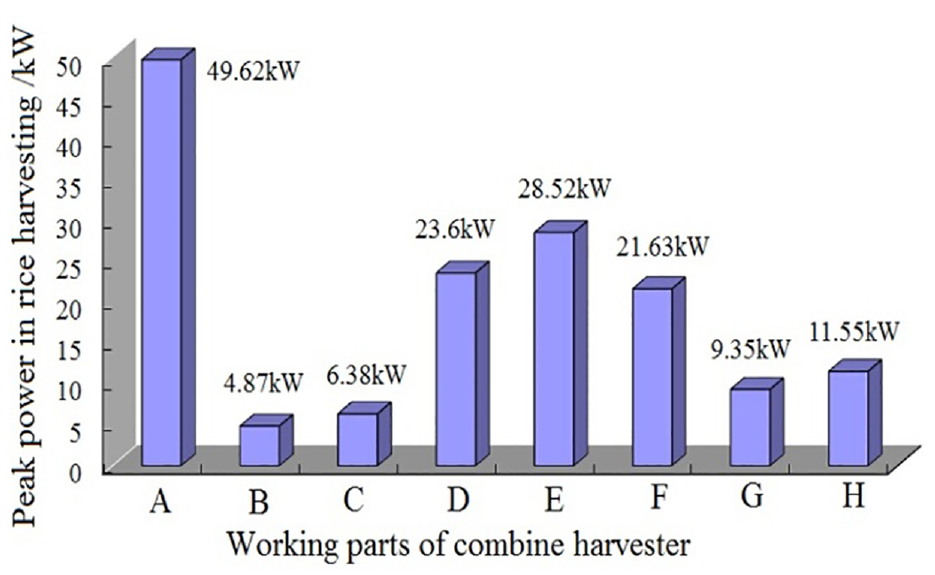
Peak power of each working parts in rice harvesting.
Figures 17 and 18, the material maximum power of reel cutting table was 8.61 kW, but the normal dynamic load power was 1.45 kW, the Peak power was 4.87 kW, the strength of reel cutting table drive shaft was enough. The material maximum power of Conveyor Bridge was 10.12 kW, but the normal dynamic load power was 1.11 kW, the Peak power was 6.38 kW, the strength of reel cutting table drive shaft was enough. The material maximum power of I-threshing cylinder 26.20 kW, but the normal dynamic load power was 5.78 kW, the Peak power was 23.60 kW, and the strength of reel cutting table drive shaft was enough. The material maximum power of II-threshing cylinder was 26.20 kW, but the normal dynamic load power was 10.01 kW, the Peak power was 28.52 kW, the strength of reel cutting table drive shaft was not enough. The material maximum power of Intermediate shaft of engine was 57.71 kW, but the normal dynamic load power was 34.03 kW, the Peak power was 49.62 kW, the strength of reel cutting table drive shaft was enough. The material maximum power of left drive shaft of chassis was 13.94 kW, but the normal dynamic load power was 3.61 kW, the Peak power was 9.35 kW, and the strength of reel cutting table drive shaft was enough. The material maximum power of right drive shaft of chassis was 13.94 kW, but the normal dynamic load power was 4.85 kW, the Peak power was 11.55 kW, the strength of reel cutting table drive shaft was enough.
Conclusions
In this study, a load testing system for the chassis, header, and various working parts of a crawler-type combine harvester was constructed, and the torque and rotation speed under different working conditions were tested. The load changes under different working conditions in terms of the various field load influencing factors were analyzed. The following conclusions can be drawn:
(1) Through a load test and a comparison test, the power consumptions of the working parts of the combine harvester were found to be the highest under harvesting conditions characterized by high speed, full-load, and low stubble height. The power consumption of the shaft was slightly higher than that of the left half shaft.
(2) The load testing system constructed for the combine harvester has a reasonable installation structure, is stable, reliable, and can accurately obtain the working loads of each working part of the harvester.
Footnotes
Handling Editor: Chenhui Liang
Declaration of conflicting interests
The author(s) declared no potential conflicts of interest with respect to the research, authorship, and/or publication of this article.
Funding
The author(s) disclosed receipt of the following financial support for the research, authorship, and/or publication of this article: This work was supported by the Jiangsu Agriculture & Animal Husbandry Science and Technology Vocational College (NSF2022ZR14) and Taizhou Science and Technology Support Plan (Agriculture) Project (TN202208, TN202219).
Data availability
The data used to support the findings of this study can be obtained from the corresponding author upon request.