
Abstract
Canewood and palm kernel fibre (PKF) have successfully been used as filler material for producing ceiling boards, with recycled low-density polyethylene (LDPE) as the binder. This work covered three aspects which are the optimization of process and production parameters, chemical, and thermal analysis of the utilized filler material. The production parameters considered are the percentage composition of both the binder and filler material while the process parameters studied are the press temperature, pressure and time. These parameters were optimized over both physical and thermal properties of the developed ceiling board which are thermal resistivity, water absorption and thickness swell. Thermal results for both the cane wood and PKF proved to be thermally stable up to temperatures as high as 325 and 310°C, respectively. The optimized ceiling board showed a thermal resistivity, water absorption and thickness swell of 16.192 W/M.K, 4.669 and 6.594% respectively, for a production and process parameters of 15% cane wood, 10% PKF, 75% LDPE, 6 min press time, 7 bar pressure and 198°C press temperature. The produced ceiling board showed a specific heat capacity, thermal energy and heat flux of 769.23 Jkg−1K−1, 60 W and 23.07 kWm−1 respectively. The findings imply that the LDPE filler materials are appropriate for use in ceiling board applications.
Keywords
Introduction
Nigeria is blessed with a variety of agricultural produce, resulting in over ten million tons of agricultural waste annually. These products include palm trees, rice, sugar cane, bagasse, coconut fibre and so on.1–3 To get these products to the final consumers, several agricultural activities are involved; cultivation, harvesting and processing. These activities are accompanied by the generation of quite a chunk of agricultural waste. These agricultural wastes when not properly managed can cause pollution in possible ways which are littering the environment when not properly discarded and releasing harmful gases into the atmosphere when burnt.4–6 However, a significant portion of these agro-waste products can be recycled into new, more environmentally friendly products that can also contribute to Nigeria’s economic development. The cost and availability of raw materials are essential elements influencing production; also, production costs are lowered to a reasonable level when the bulk of raw materials necessary for a manufacturing process are discarded as waste from human activities and agricultural processes. This will almost certainly improve the recycling of the low-density polyethylene sachets that litter our ecosystems. In terms of agriculture, this research will address the palm fruit fibre waste generated during palm fruit processing as well as the cane wood processing. According to the literature, a number of these agricultural wastes have been investigated to become potential raw materials for the production of different Engineering materials. Some of these studies include palm fruit fibre for brake pads, 7 cane wood for brake pads, 8 cane wood for ceiling board,8,9 breadfruit seed coat for ceiling board,3,10 bagasse, 11 palm kernel shell,12,13 mahogany wood, 14 corn cobs and cassava stalks for particle boards production 15 and Rice husk and sawdust.16,17 Success in these studies holds several advantages which include the constant availability of these industrial and agricultural wastes in Nigeria. The current research trend is to use industrial and agricultural waste as a raw material source for composite development.18,19 Further studies have shown that natural fibres pose good engineering properties for application in almost all engineering sectors. 20
Ceiling boards are needed in houses to reduce heat and sound while also adding aesthetic value. In hot climates, a ceiling with a highly reflective upper surface, good heat insulation, and a low thermal capacity is recommended. 3 No doubt, asbestos poses the best qualities as filler material for ceiling board production, due to its low moisture absorption, and good thermal resistance, which are the basic criteria required to identify a good ceiling board. Also due to its synthetic nature, it is easily compatible with a good number of binders. This quality is very important because it determines the compressive strength of the developed composite. However, irrespective of these good qualities, asbestos is known to pose several health hazards, due to its carcinogenic nature. In animal studies, asbestos has been shown to cause tumours, and it is a known cause of asbestosis and malignant mesothelioma in humans. Mesothelioma has been discovered in people who were occupationally exposed to chrysotile, their family members and residents who lived near asbestos factories and mines. 7
Filler materials reinforce the matrix by increasing the elastic modulus and composite strength. The main disadvantage of incorporating agricultural fillers into a synthetic polymer is their incompatibility. LDPE is a tough and versatile polymer with long branches that don't fit well into crystallites. 21 The molecules can pack more tightly as the chains become more linear. PKF is one of the agricultural wastes obtained from the processing of palm fruit. Palm fruit production is very common in Nigeria, especially for the rich palm oil obtained from it. Palm fruit production is done all year round thus making PKF always available in huge quantities. Researchers have shown that palm fruit-based composites pose low water absorption properties, which is a good quality for ceiling board materials. Also, cane wood fibre is very much available in Western Nigeria. 22 However, hybrids of these natural fibres have been proven to pose better properties than composites developed with single natural fibre. Thus, this work proposes to utilize the low water absorption properties of PKF as well as the low thermal conductivity of cane wood for the production of ceiling boards.
Materials and methods
Materials and equipment
The materials used in this study are as follows: recycled LDPE, PKF, cane wood, sodium hydroxide (NaOH), water and acetic acid. The equipment put to use for the actualization of this study is a hot press, weighing balance, Asiko II double grinding mill, Micrometer screw gauge, sieve, mould, Thermal gravimetric analyser (TGA), Fourier transformed infrared (FTIR), Differential thermal analyser (DTA) and Design Xpert software v10.
Preparation
The palm kernel fibre and cane wood were processed to enhance compatibility with the proposed binder and consequently produce a well-reinforced polymer composite.
Palm kernel fibre preparation
Palm fruit fibres were collected from an Anambra State palm oil mill in Awka, Nigeria. To remove the residual palm oil, the fibres were soaked in a NaOH solution for 1 h. Following the removal of the NaOH, the fibres were neutralized with acetic acid. The fibres were then sun-dried after being washed with water to remove the acetic acid. The dried fibres were ground into powder using an Asiko A11 Double grinding mill and sieved through a sieving tray with a mesh size of 150 μm.
Preparation of cane wood
Several sticks of cane wood were obtained from cane furniture makers and other rattan cane users in Awka, Nigeria. They were reduced to thin strands, which were then cut into bits. To obtain the required grain size, the cane wood bits were ground into powder and sieved using a sieving tray with a mesh size of 150 µm.
Preparation of low-density polyethylene
The LDPE came from a recycling facility in Onitsha, Nigeria. They were recycled and converted into pellets. When the recycled LDPE was purchased, it was ground into a powder and sieved to a particle size of 600 µm.
Development of samples
The contents were weighed and manually dry-mixed in a bowl with a stirring rod until a homogeneous mixture was obtained. Each formulation’s mixture was transferred into the rectangular mould separately. The mixed-materials mould was pressed at various press times and pressures as specified in the sample design. The produced samples were cured and cooled in the open air after removal from the hydraulic press. The length of 5.1 cm and width of 5.1 cm was measured. While the thickness of 0.3 cm was measured using a calliper.
Central Composite Design
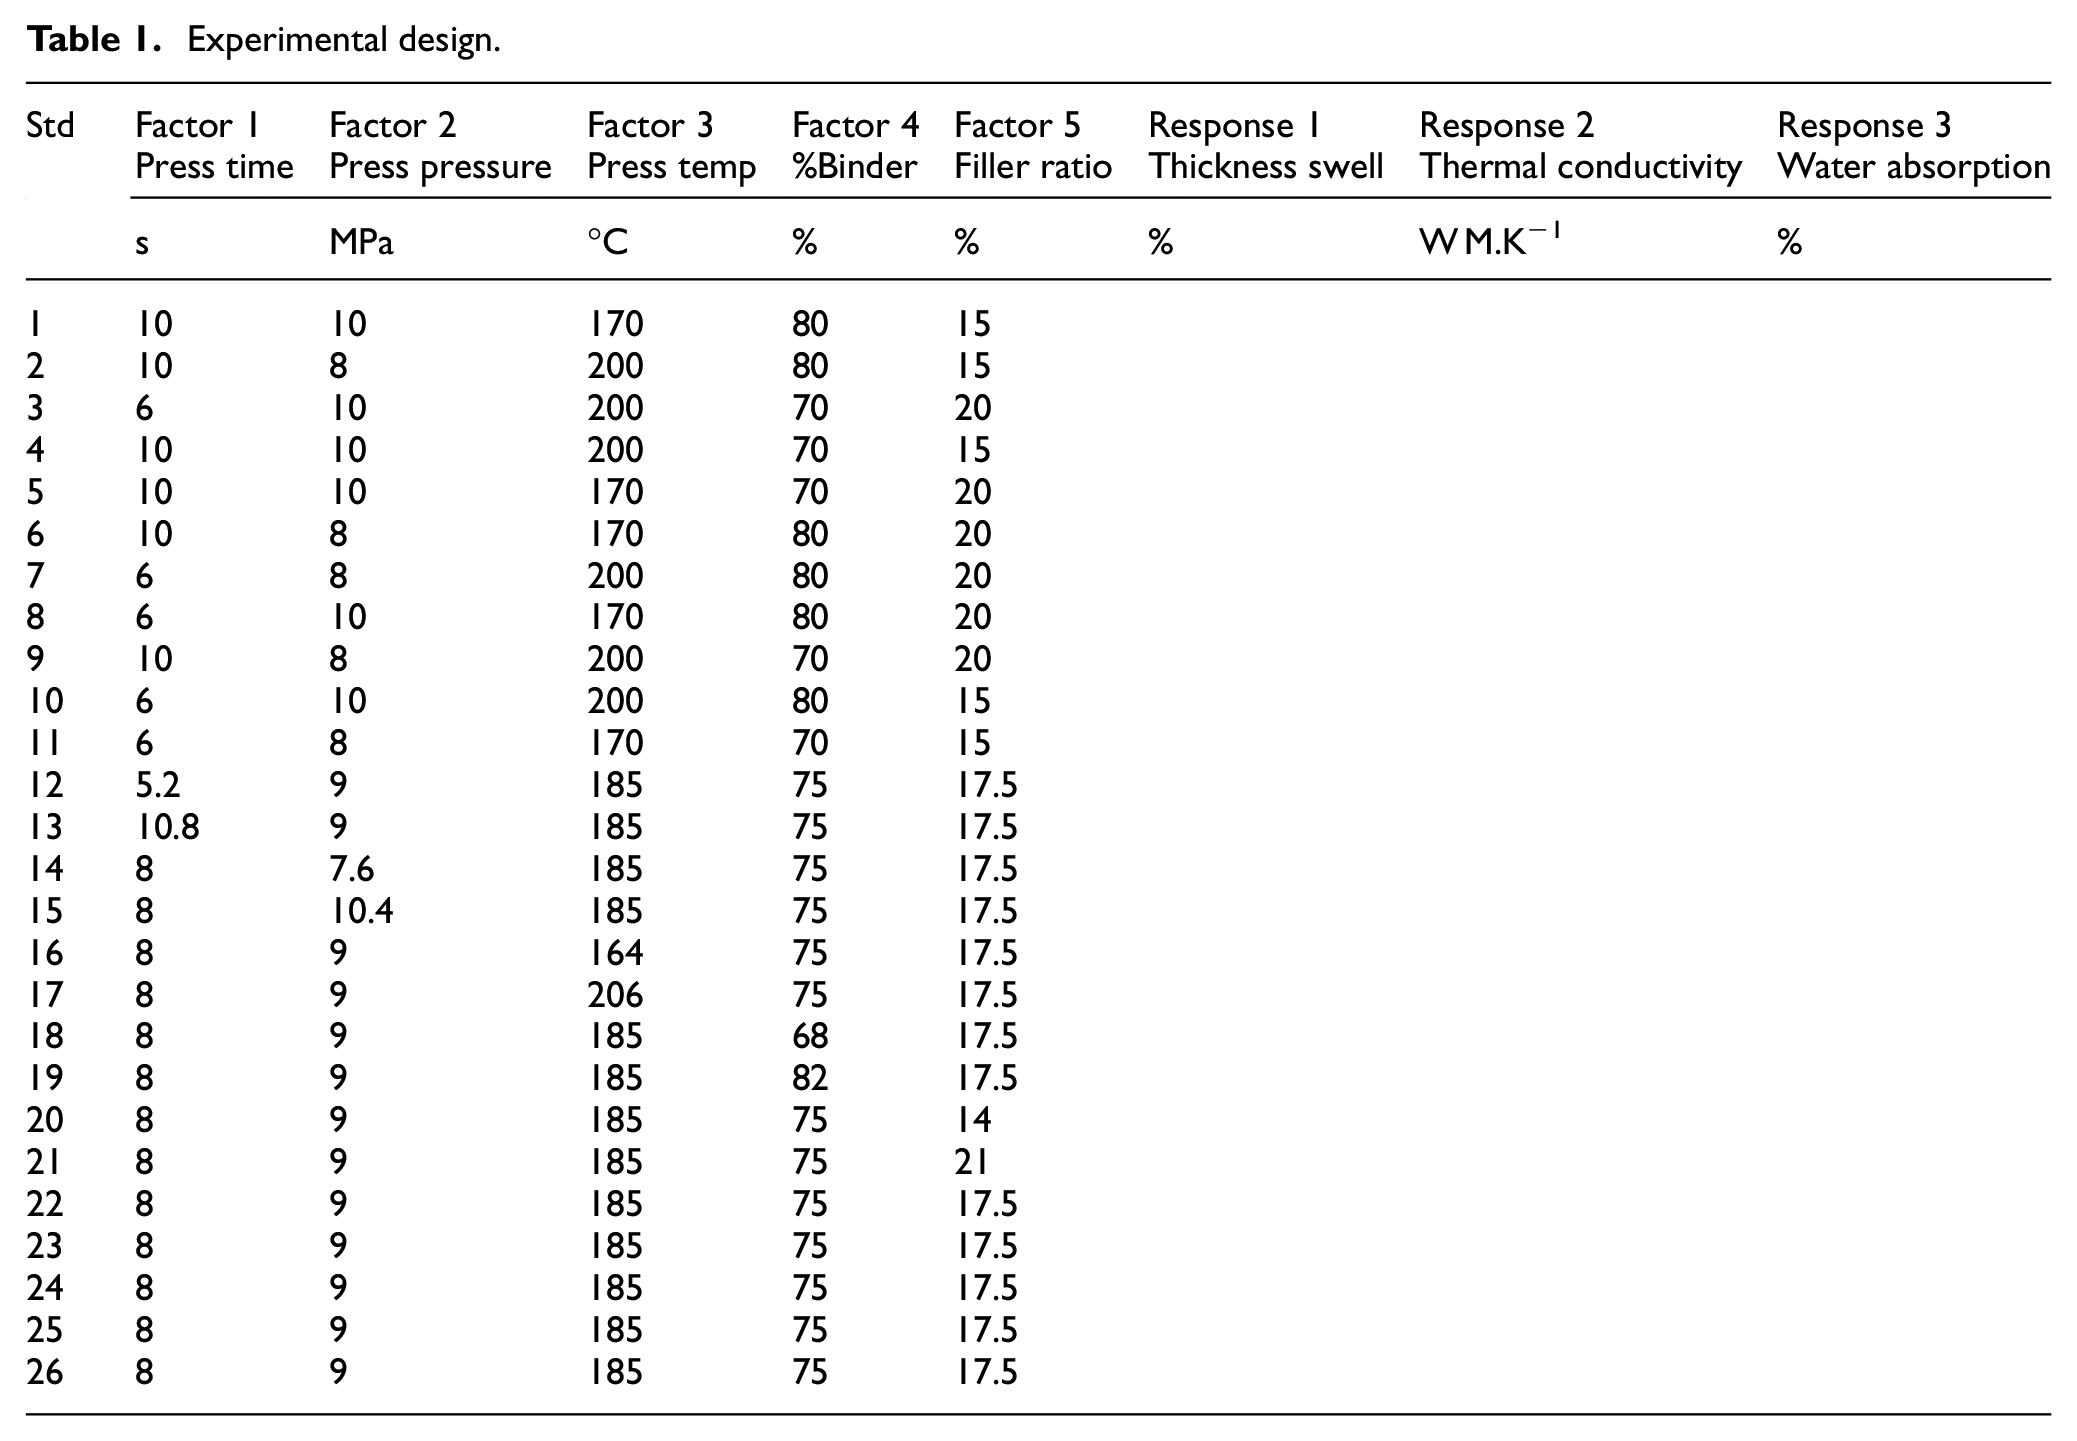
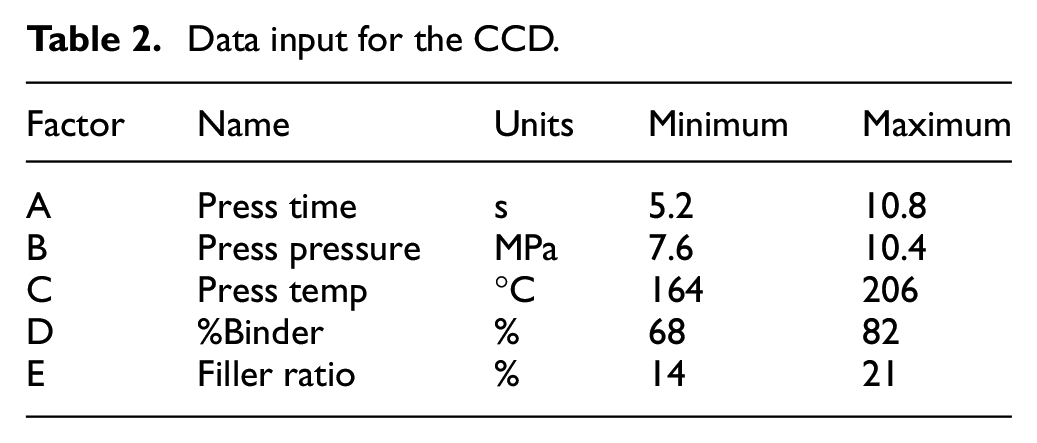
The Central Composite Design was used to optimize the process of production.23,24 The factors considered were press time, press temperature, press pressure, PKF composition, cane wood composition and binder composition, while the responses are thickness swell, water absorption rate and thermal resistivity. The variables were varied at five different levels (−α, −1, 0, 1, +α) with the CCD, yielding a total of 26 different experimental samples. There were 12 core points, 9 star points and 5 centre points in these experimental samples. This provided two replicates for both the factorial and axial points, increasing the experiment’s accuracy. This resulted in the experimental design shown in Table 1, with the input data shown in Table 2.
Experimental design.
Data input for the CCD.
Optimization using Central Composite Design (CCD)
Response surface methodology (RSM) was used to optimize the production process, with the factors being press temperature, press pressure, press time, PKF composition, cane wood composition and binder composition. This implies that the production process as well as the material mixture ratio will be optimized.
The CCD was used to investigate the effects of factors on their responses and, later, in optimization studies. This method is appropriate for fitting a quadratic surface and aids in optimizing the effective parameters with a small number of experiments while also analysing the interaction between the parameters. The intent of this study was to describe the effects of PKF percentage, cane wood, press temperature, press time and press pressure on the thermal resistivity, water absorption rate and thickness swell of the produced ceiling board. The CCD was used to generate test samples. Equation (1) was used to calculate the coded values of the process parameters.

Where yi is coded value of the ith variable, Yi is uncoded value of the ith test variable and Yo is uncoded value of the ith test variable at the centre point.
The response function was estimated as a second-order polynomial using regression analysis: Design Expert v.10 was used for data regression analysis and estimating the coefficient of the regression equation. The statistical tests known as ANOVA analysis were used to validate the equations. Each term in the equation is important in estimating the goodness of fit in each case. To determine the individual and interactive effects of the test variable on the thermal resistivity, thickness swell and water absorption rate of the developed ceiling board, response surfaces were drawn. The optimal test variable values were obtained in coded units and then converted to uncoded units.
Thermo-physical properties
These are the independent variables, which are the various tests that the samples were subjected to. These responses are the various properties that a good ceiling board must possess in the right proportion.
Density
Archimedes’ principle was used to calculate density. A submerged object’s buoyant force is equal to the weight of the fluid displaced. This principle can be used to calculate the volume and thus density of an irregularly shaped object by measuring its mass in air and its effective mass when submerged in water (density = 1 g cc−1). Underwater, the effective mass was equal to the actual mass minus the mass of the fluid displaced. According to Robert et al. 25 and Casanova-Gonzalez et al., 26 the difference between the real and effective mass gives the mass of water displaced and allows the volume of the irregularly shaped object to be calculated. The average density of the sample can be calculated by dividing the mass by the volume that has been determined;


Where
Thickness swell
This response determines the amount of deformation (thickness increase) that occurs when the material absorbs moisture. To carry out this test, the initial thickness “
Water absorption
This is similar to thickness swell, but in this case, the weight increase is determined. This response will aid in determining the percentage increase in weight that will occur as a result of moisture absorption. W1 and W2 represent the initial and final weights of the material before and after partial submersion in water. The weight absorption rate of water is given as;
Thermal resistivity
Thermal resistivity will aid in determining the material’s ability to resist the passage of heat. Ceiling boards with higher thermal resistance are preferred over those with lower heat resistance because heat resistivity is a property of a ceiling board that aids in the maintenance of a room’s temperature. The samples were placed between the thermal conductivity testing machine’s cold and hot surfaces. With Th and Tc as the steady-state temperatures of the hot and cold surfaces, a thermal flux of the heater “

The resistivity of the produced samples was calculated using equation (8);

Specific heat capacity, thermal energy and heat flux
The specific heat capacity (S.H.C) of the produced sample was determined using the experimental method reported by Onyekunle et al. 27 and Dirisu et al.28,29 The sample was weighed and its mass was recorded. A beaker was filled with water, and the suspended sample was placed inside at a boiling point of 100°C for about 5 min. A copper calorimeter was also weighed alongside the stirrer, and the mass was recorded. It was later filled halfway with water and weighed again to obtain a new mass. The initial temperature of the water was recorded using a thermometer. The temperature of the boiling water was measured and recorded after the calorimeter was brought to a boil.12,28,30 The ceiling sample was quickly transferred to the calorimeter’s water. The water was continuously but gently stirred, and the highest temperature was reached.
By disregarding for any heat loss to the environment: Heat gained by water + heat gained by copper calorimeter and stirrer = heat loss by ceiling sample.
Thus,

From equation (9), the S.H.C of the sample will be calculated as stated in equation (10);

The thermal energy of the ceiling sample was calculated using the relation 31 ;

During the experiment, the temperature changes for both heating and cooling were measured. The heat flux of the ceiling sample was calculated using equation (12) 32 ;
Where;
Thermo-structural properties
Fourier Transformed Infrared (FTIR) Spectroscopy was used to analyse functional groups and identify organic compounds using ASTM E1252 standard.33,34 By applying infrared radiation (IR) to samples of materials, FTIR analysis determines the material’s molecular composition and structure by measuring the absorbance of infrared light at various wavelengths. Thermal gravimetric analysis (TGA) was used to determine a material’s thermal stability as well as the fraction of its volatile components by monitoring the weight change that occurs when a sample of the material is heated at a constant temperature by employing ASTM E1131 standard. Thus, this analysis helps to determine the rate of thermal degradation of the material. Differential thermal analysis (DTA) helps to determine the endothermic or exothermic changes in a material relative to an inert reference using DIN 51007 standard. In this analysis, the material under study and an inert reference are subjected to similar thermal cycles, and the temperature differences between them are recorded. The differential temperature is then plotted against time and compared with that of the inert reference.
Results and discussion
FTIR analysis of cane wood and PKF
The FTIR analysis was conducted on both the cane wood and PKF materials to ascertain the active functional groups in the materials. Table 3 summarizes the indicated absorption bands and functional groups from the FTIR spectrum of cane wood. The IR spectrum indicates four significant absorption peaks at 3283.8, 2899.9, 1509.6 and 1017.6 cm−1. While the 3283.8 cm−1 absorption peak was assigned to the O–H functional group from hydroxyl group from alcohol and phenols, 2899.9 cm−1 was assigned to C–H functional group from alkanes, 1509.6 and 1017.6 cm−1 was assigned to N–H and C–N functional groups from amines. This demonstrates that O–H and functional groups are active in the material.
Functional group compositions of cane wood.

The presence of broadband corresponding to 3652.8 cm−1 was attributed to intermolecular alcohol O–H stretching vibration. The 2068.7 cm−1 was assigned to C=O functional group from ketones. The stretching of –C≡C–, C=C and =C–H saturated bond indicates the presence of alkenes. The band absorbance at 1722.0 and 1367.9 cm−1 is attributed to stretching of C=H and C–O saturated bond, indicating the presence of aromatic ester. The band absorbance at 1428.8 cm−1 could be attributed to O–H overlapping bands, most likely from a carboxylic group (ethanol and methanol). The C–F was found in alkyl halide stretching vibration.
The FTIR spectra analysis as shown in Table 4 revealed the functional group compositions present in the PKF at wavelength spanning from 4000 to 650 cm−1. Table 4 lists the potential functional group compositions and compounds.
Functional group compositions of cane wood.

The dominant functional groups present are O–H, C–H and C–F groups with wavelengths of 3293.8, 2926.0 and 1028.7 cm−1 respectively. Others are primary and secondary alcohol, aromatic groups, ketones, alkyl halide and aromatic esters. This demonstrates that O–H and functional groups are active in the material. The presence of broadband corresponding to 3652.8 cm−1 was attributed to intermolecular alcohol O–H stretching vibration. The 3011.7, 2855.1 and 1707.1 cm−1 were assigned to C–H and C=H functional groups from aromatic groups and alkanes. The stretching of C=O and C=C saturated bond indicates the presence of ketones and alkenes respectively. The band absorbance at 1405.2, 1315.8 and 1241.5 cm−1 is attributed to stretching of O–H and C–O saturated bond, indicating the presence of carboxylic group, aromatic ester and alcohol respectively.
Thermal analysis of the materials
Thermal analysis of cane wood and PKF was conducted using TGA/DTA analysis to determine its thermal stability at elevated temperatures.
TGA/DTA analysis of cane wood
Figure 1 shows the TGA/DTA Analysis conducted on the cane wood to determine its thermal stability at elevated temperatures. Figure 1 shows the result of the TGA/DTA analysis on cane wood. This thermal analysis illustrates the degradation pattern of the cane wood when subjected to increasing temperatures. The result shows that cane wood degraded basically in three distinct slopes, corresponding to temperature ranges of 28.59–325, 325–505 and 505–888.4°C. At the first slope between temperatures of 28.59 and 325°C, a minimal weight loss of about 5% was lost. This however shows that cane wood exhibits good thermal stability up to 325°C. From Figure 1, it can be noted that the major degradation resulting in a pronounced weight loss of about 83% is recorded in the second slope between temperatures 325 and 505°C. The final degradation records a weight loss of about 6% between temperatures of 505 and 888.4°C.

TGA/DTA result for cane wood.
TGA/DTA analysis of PKF
Figure 2 shows the TGA/DTA Analysis conducted on the PKF to determine its thermal stability at elevated temperatures.

TGA/DTA result for PKF.
Figure 2 shows the TGA/DTA result for PKF. Its degradation also can be seen to occur in three distinct slopes. However, a few differences can be noted from that of cane wood. The first slope showed a reduced weight loss of about 3% up to 307°C, which can be said that it is relatively stable up to this temperature. However, the main weight loss of about 75% occurred in the second slope that is captured between the temperatures of 310 and 460°C. The final slope between the temperatures of 460 and 889.1°C also recorded a slight weight loss of about 3%.
Thermal resistivity
The developed model as well as the effect of the interaction of the various factors on the thermal resistivity of the developed ceiling board is discussed here. High thermal resistance is a highly desired property in the design and development of ceiling boards. It determines the ability of the ceiling board to prevent the transmission of heat to and from the room.
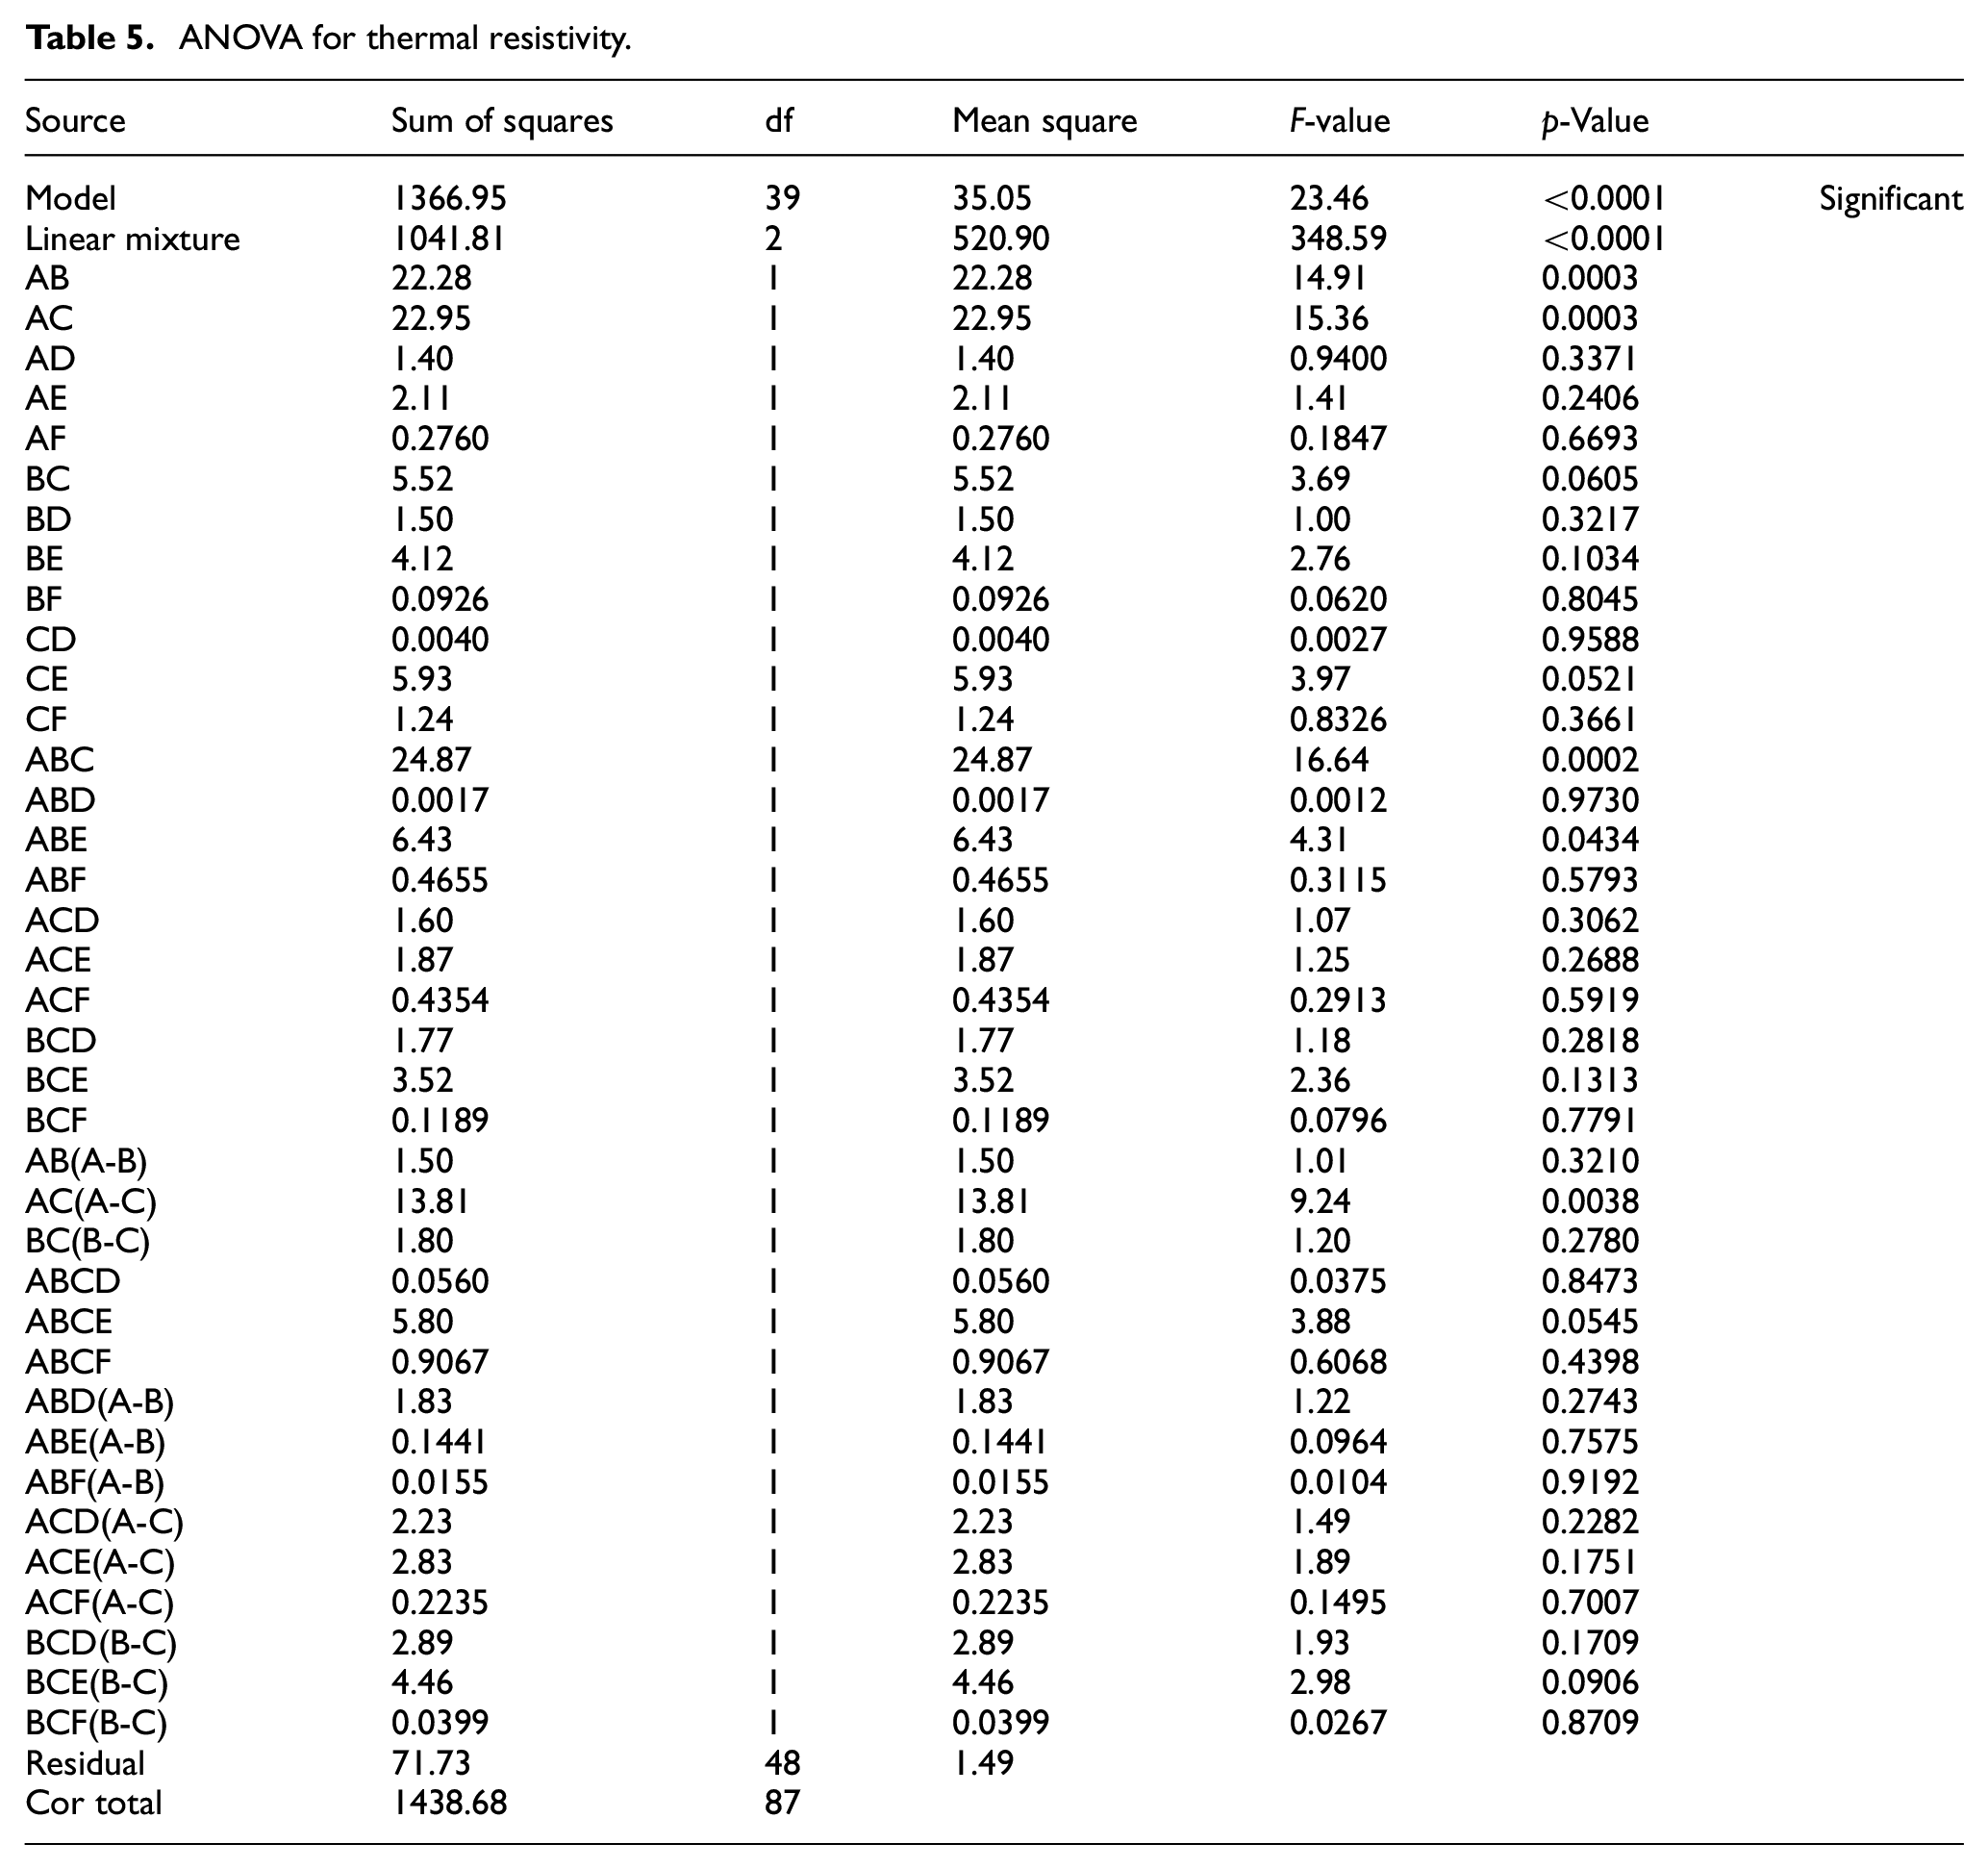
ANOVA for thermal resistivity
Table 5 shows the ANOVA for thermal resistivity. A Model F-value of 23.46 was obtained which implies that the model is significant. This however large enough to divorce the fact that it could have occurred as a result of noise. Eliminating the non-significant terms, the model equation is reduced to equation (13). Also, the Predicted R2 of 0.8404 and the Adjusted R2 of 0.9096, are in reasonable agreement.

ANOVA for thermal resistivity.
Probability plots for thermal resistivity
Figure 3, shows the probability curves for the model developed for thermal resistivity. a, b and c represent the curves for Predicted against actual, Normal probability and residuals against predicted respectively. From the graphs, the factors identified by the points are seen to be closely packed. This indicates minimal experimental procedures.
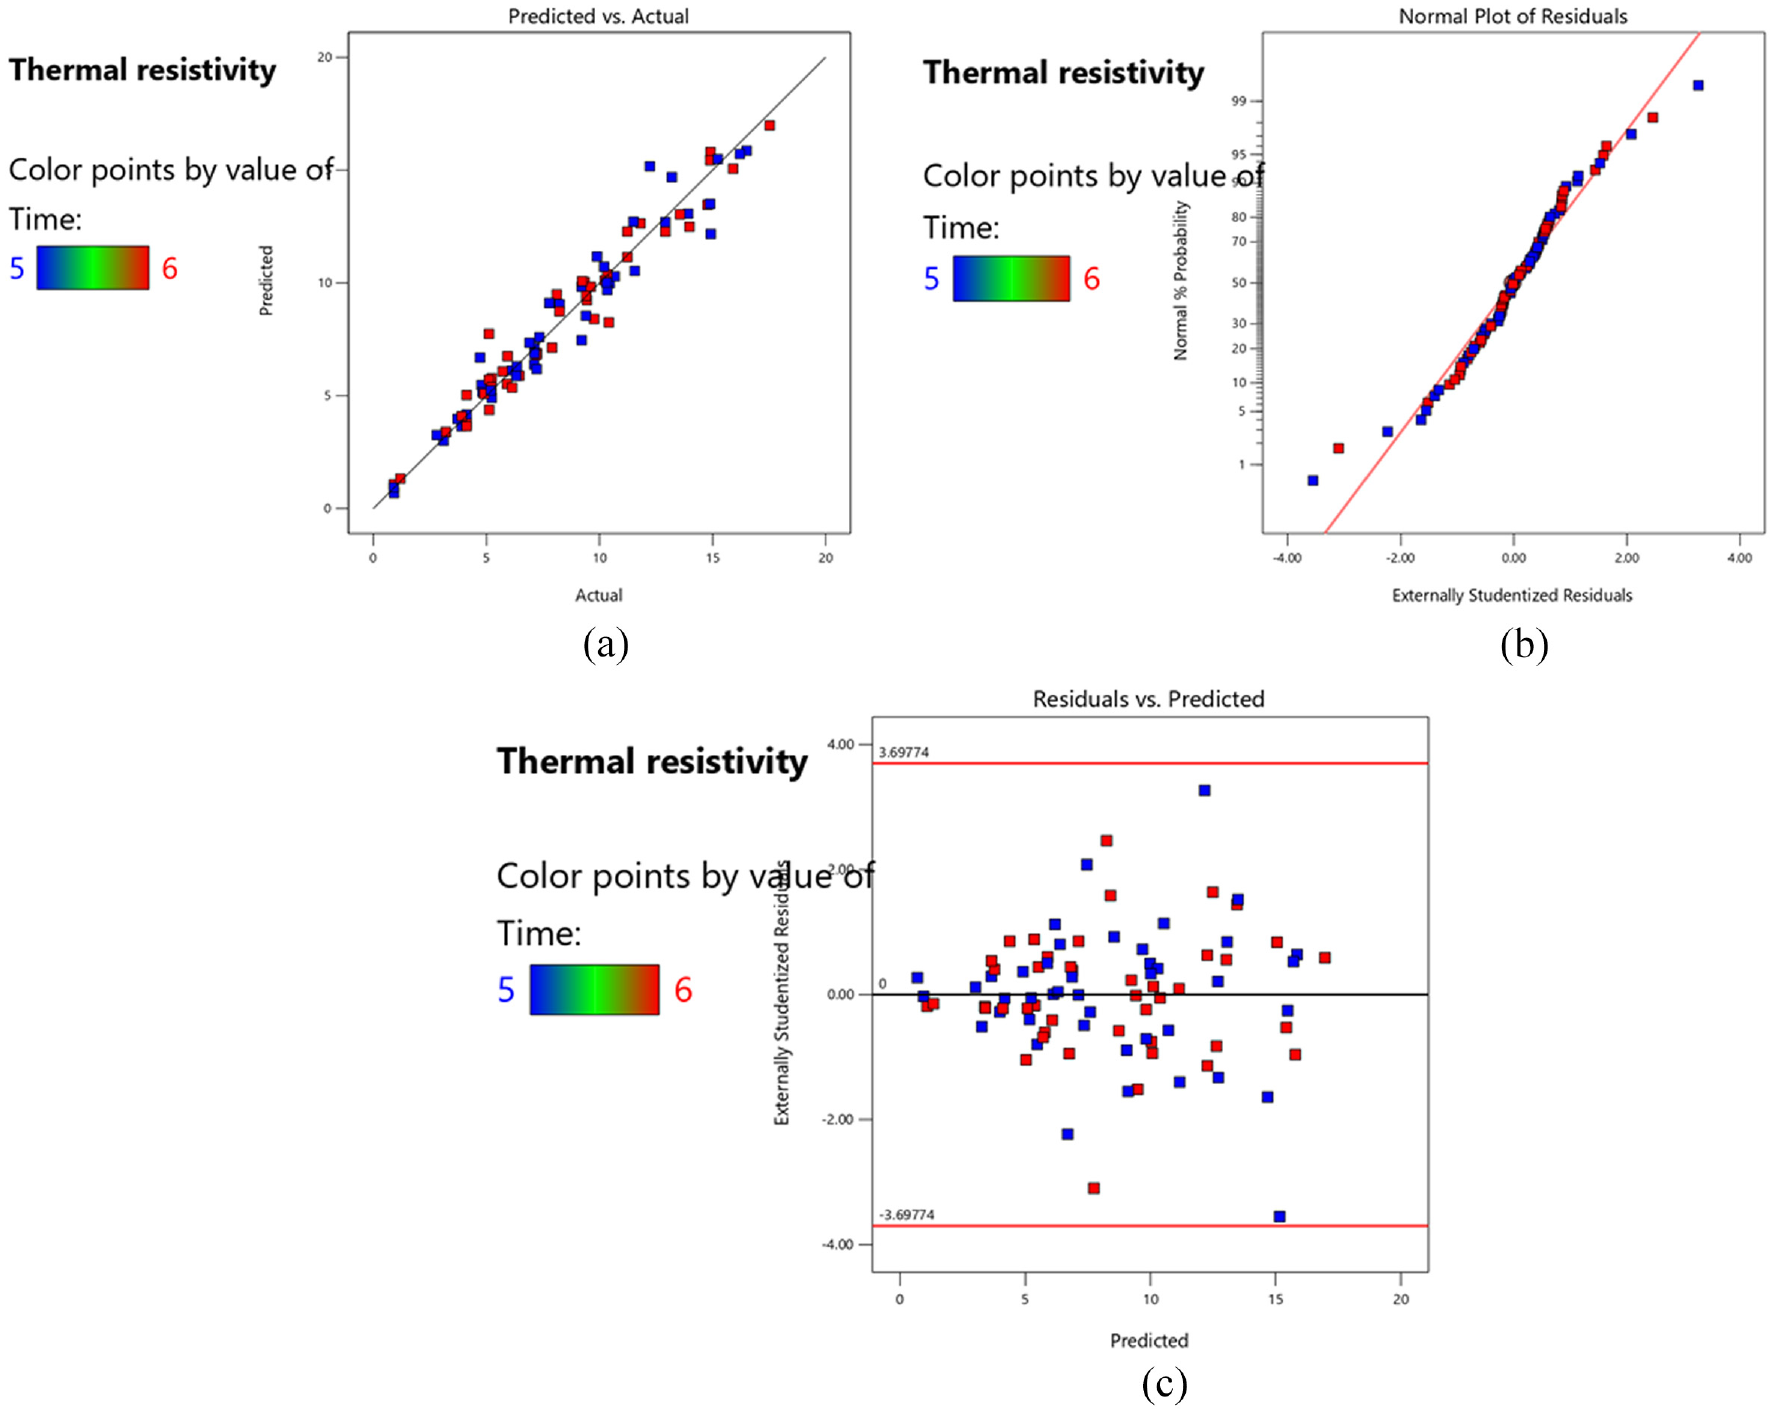
Probability curves for thermal resistivity.
Surface plots for thermal resistivity
The surface plots show the combined effect of three independent factors on the thermal resistivity of the developed ceiling board, two mixture parameters and a process parameter for each plot. The effects of the combination of both the process and mixture parameters on thermal resistivity can be deduced from Figure 4.

Surface plot showing the effect of the factors on thermal resistivity.
The combination of the parameters under study can be seen on the axes of each 3D plot in Figures 4(a)–(f). It is clear from Figure 4 that the parameters have interesting effects on the thermal resistivity of the ceiling board. Increasing the process parameters can be seen from Figures 4(b)–(e) to positively affect the thermal resistivity capacity of the ceiling board. However, on the part of the mixture parameters (percentage composition of cane wood, PKF and LDPE), a major effect can be seen from the percentage composition of LDPE. The percentage composition of PKF and cane wood from Figures 4(a) and (f) can be deduced to have a fairly similar effect on thermal resistivity. The percentage composition of PKF on thermal resistivity can be seen to be slightly above that of cane wood, especially from Figure 4(f).
Water absorption
The moisture effect is one of the factors that must be put into consideration in designing a ceiling board. The rate of water absorption was monitored for the developed ceiling board.
ANOVA for water absorption
Table 6 presents the analysis of variance for the model developed for water absorption. The table shows that the developed model is significant with a quite large F-value of 17.01, indicating a negligible effect of noise on the model. From the model fitness statistics, the difference between the adjusted and predicted R2 value is less than 0.1, indicating reasonable agreement. The final model equation obtained after the elimination of the non-significant terms is presented in equation (14).

ANOVA for quadratic × linear model.

Probability curves for water absorption
Figure 5, shows the probability curves for the model developed for water absorption. A, B and C represent the curves for Predicted against actual, Normal probability and residuals against predicted respectively. From the graphs, the factors identified by the points are seen to be closely packed. This indicates minimal experimental procedures.
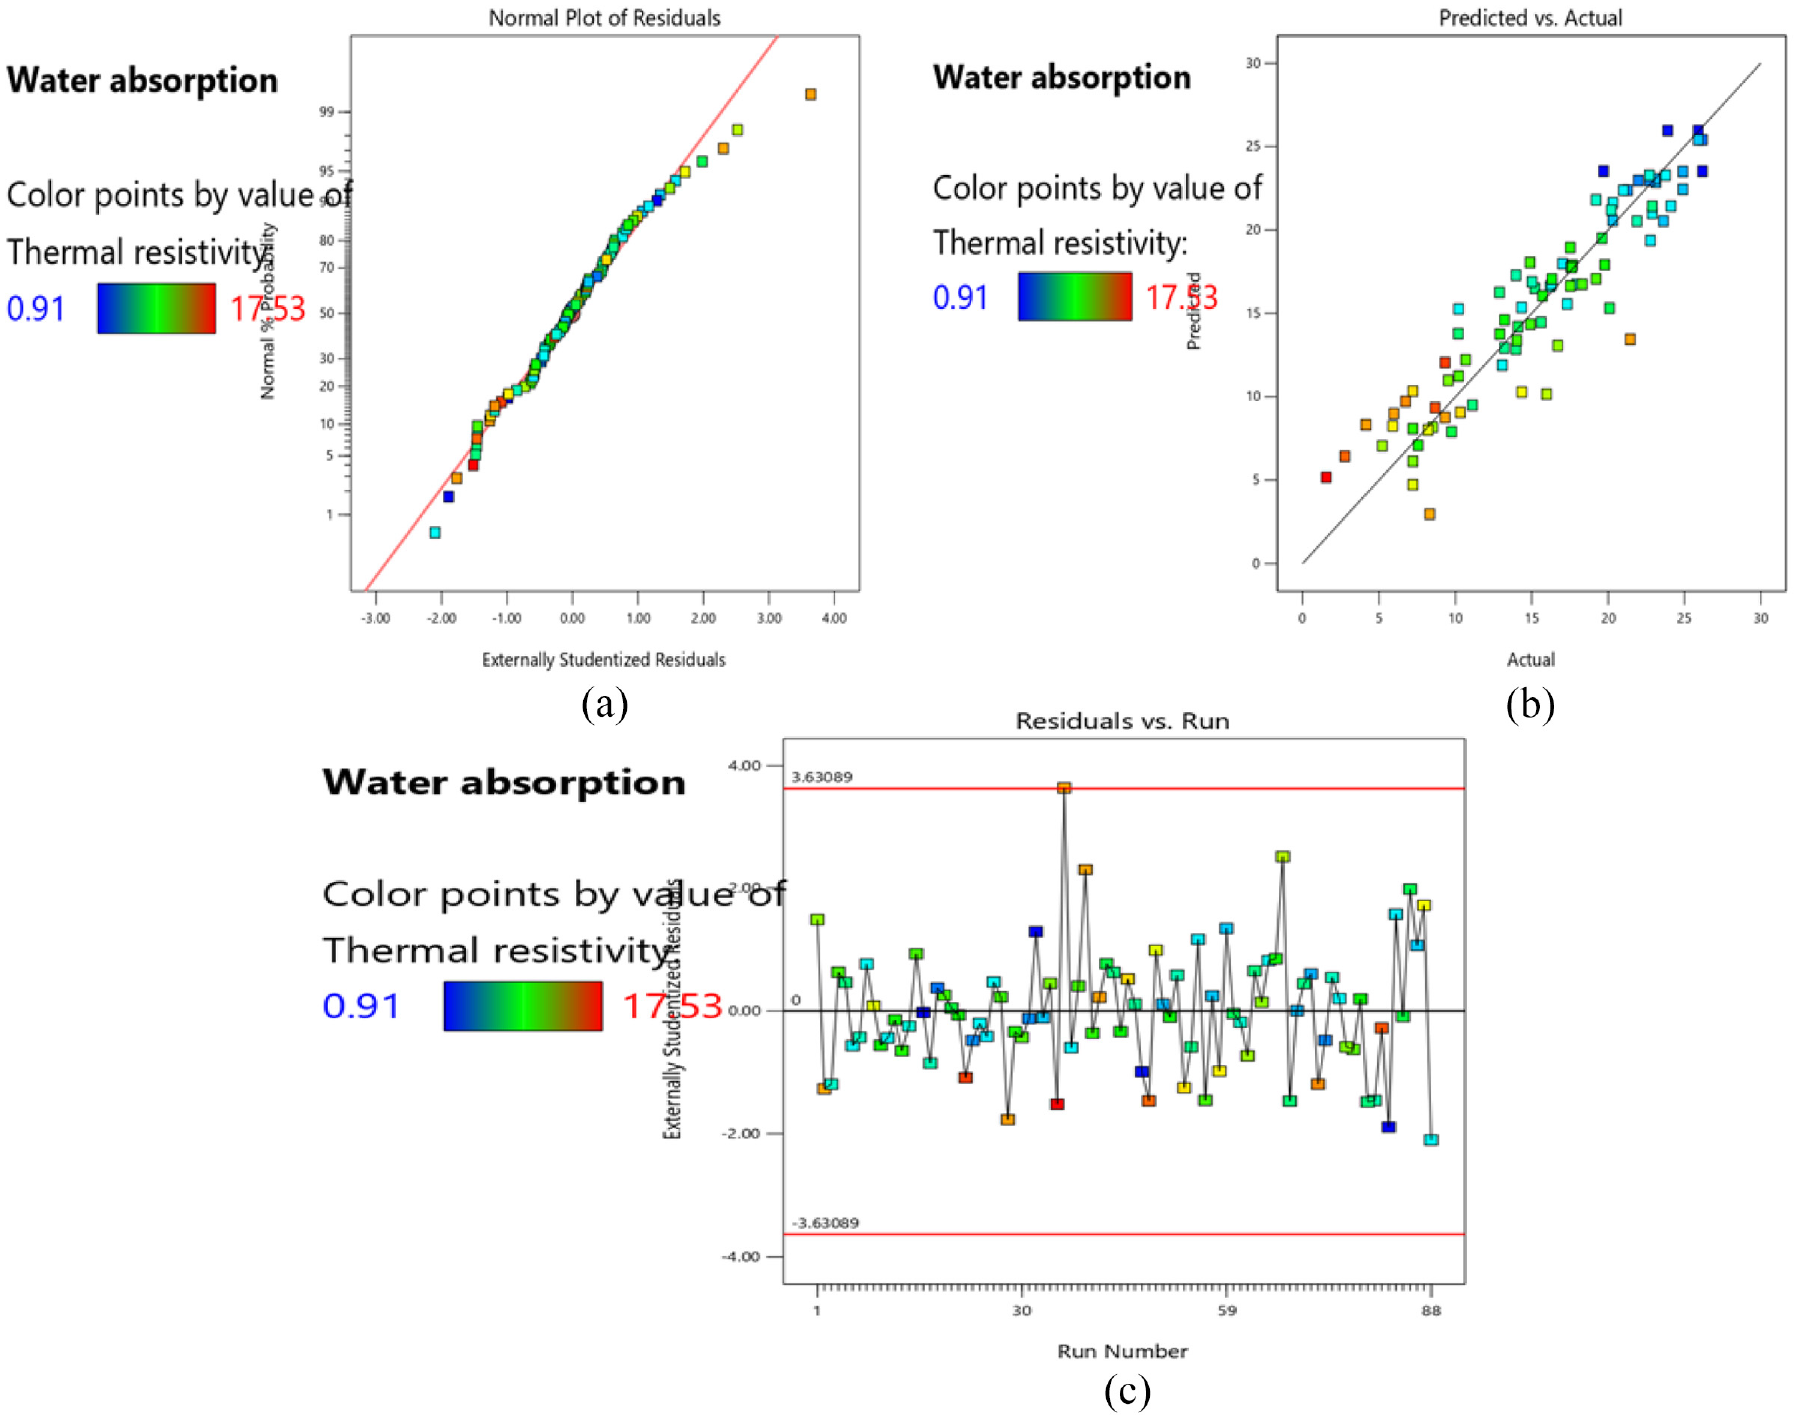
Probability curves for water absorption.
Effect of factors on water absorption
The 3D surface plots presented in Figure 6 give a picture of the combined effect of two mixture parameters a process parameter on water absorption. From Figure 6(a), it can be seen that both the percentage composition of PKF and cane wood have a similar effect on the water absorption capacity of the developed ceiling board and is slightly affected by the process pressure. This shows that both materials (PKF and cane wood) possess similar water absorption properties and the pressure applied to the material has very little to contribute to reducing this effect. This is quite different from what can be seen in Figures 6(b)–(f) with a negative slope to the left. This shows that increasing the percentage composition of Low-Density Polyethylene (LDPE) decreases the water absorption capacity of the ceiling. This is expected knowing that LDPE has a high-water resistivity. Also, LDPE being a binder creates a stronger bond with other components, thus enhancing the water resistance properties of the developed ceiling board. In Figures 6(c), (d) and (e) the effects of the process parameters; temperature, time and pressure respectively are shown. Increasing the process parameters gives a ceiling board with better water resistance. This is because increased temperature, time and pressure give better room for the formation of a stronger bond between the components of the ceiling.

Surface plots showing the effect of the factors on thermal resistivity.
Thickness swell
The thickness swell on account of moisture absorption of the developed ceiling board was also investigated. This property goes a long way to determine how well the developed ceiling board will be able to withstand deformation on account of moisture absorption.
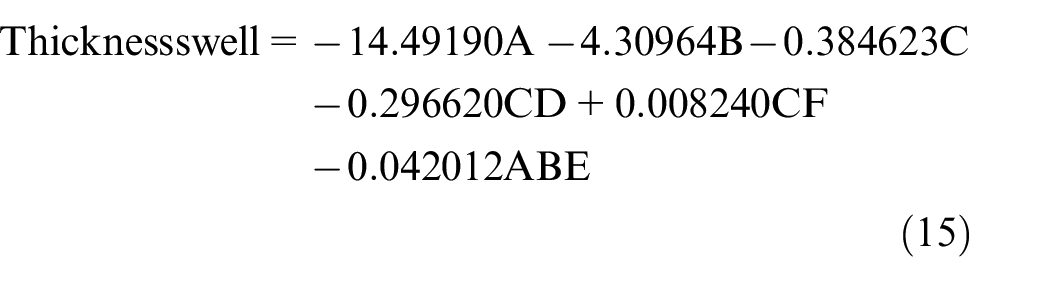
ANOVA for thickness swell
Table 7 shows the ANOVA for thickness swell. A Model F-value of 16.14 was obtained which implies that the model is significant. This however large enough to divorce the fact that it could have occurred as a result of noise. Eliminating the non-significant terms, the model equation is reduced to equation (15). Also, the Predicted R2of 0.7319 and the Adjusted R2 of 0.8001, are in reasonable agreement.
ANOVA for thickness swell.

Equation (15) for thickness swell is written in terms of actual factors that can be used to predict response for different levels of each factor. For each factor, the levels should be specified in the original units. Because the coefficients are scaled to accommodate the units of each factor, and the intercept is not at the centre of the design space, this equation should not be used to determine the relative impact of each factor.
Probability plots for thickness swell
Figure 7, shows the probability curves for the model developed for thickness swell. A, B and C represent the curves for Predicted versus actual, Normal probability and residuals versus predicted respectively. From the graphs, the factors identified by the points are seen to be closely packed. This indicates minimal experimental procedures.

Probability curves for thickness swell.
3D surface plot for thickness swell
The surface plots show the combined effect of three independent factors on the thickness swell of the developed ceiling board, two mixture parameters and a process parameter for each plot. The effects of the combination of both the process and mixture parameters on thickness swell can be deduced from Figure 8. The combination of the parameters under study can be seen on the axes of each 3D plot in Figures 8(a)–(f). From Figure 8, it can be seen that the parameters have interesting effects on the thickness swell of the ceiling board. Increasing the process parameters can be seen from Figure 8(c) to (f) to reduce the thickness swell of the ceiling board.

Surface plot showing the effect of the factors on thickness swell.
However, on the part of the mixture parameters (percentage composition of cane wood, PKF and LDPE), a major effect can be seen from the percentage composition of LDPE. Increasing the percentage composition of the LDPE reduces the thickness swell of the developed ceiling board. This is however expected because the increased percentage composition of the LDPE creates a stronger bond formation among the constituents hence making it more difficult for the ceiling board to deform on account of the absorption of moisture. The percentage composition of PKF and cane wood from Figure 2(a) and (b), can be deduced to have a fairly similar effect on the thickness swell.
Optimization
The optimization of the process and production parameters of the ceiling board was carried out using the optimization tool of the Design Expert software.
Table 8 shows the constraints selected for the optimization of the ceiling board production process. All the independent variables were set within the range (upper and higher limits) studied within the entire experimental process. For the dependent variables, thermal resistivity was set at maximum while water absorption and thickness swell were set at minimum. This is because ceiling boards are desired to have high thermal resistivity values and low water absorption and thickness swell values.
Constraints for optimization.

The solution obtained from the optimization tool of the design expert software is shown in Table 9. Ten possible solutions are presented in the table with desirability ranging from 0.898 to 0.88. However, the solution with thermal resistivity, water absorption and thickness swell of 16.192 W M.K−1, 4.669 and 6.594% respectively were selected. The selection prioritized thermal resistivity to water absorption and thickness because while the later parameters are equally important, the thermal resistivity characteristics of a ceiling board determine the level of thermal comfort that can be achieved in the controlled area. Also, since the ceiling board is protected from direct contact with moisture by the roofing sheet, the water absorption and thickness swell can be treated with lesser priority than the thermal resistivity.
Optimization solutions.

The obtained results are compared to existing results in the literature as presented in Table 10. It can be seen that the use of a blend of PKF and cane wood as filler materials for ceiling production competes well if not even better than other tested materials. A thermal conductivity of 0.0618 W M.K−1 obtained from the new formulation is better than the results obtained from the other tested materials. For water absorption the obtained 4.669% is seen to be better than the 12.3–23.35% of Sawdust-based and 14.5% of Rice Husk.35,36 From the results obtained in this research, hybridization seems to be at the top of the list. This validates the fact that hybridizing these agro-wastes yields better results than utilizing them individually. Also, because the number of commercially available raw materials is limited, other biomass materials must be incorporated for the production of ceiling boards.
Validation of results.

Thermal analysis of the produced ceiling board
Figure 9 shows the TGA/DTA Analysis conducted on the produced ceiling board to determine its thermal stability at elevated temperatures.

TGA/DTA result for ceiling board.
Figure 9 shows the result of the TGA/DTA analysis on produced ceiling board. This thermal analysis illustrates the degradation pattern of the ceiling board when subjected to increasing temperatures. The result shows that the ceiling board degraded basically in three distinct slopes, corresponding to temperature ranges of 23.63–340, 340–515 and 515–888.4°C. At the first slope between temperatures of 23.63 and 340°C, a minimal weight loss of about 2.5% was lost. This however shows that the produced ceiling board exhibits good thermal stability up to 340°C. From Figure 9, it can be noted that the major degradation resulting in a pronounced weight loss of about 86% is recorded in the second slope between temperatures 340 and 515°C. The final degradation records a weight loss of about 2% between temperatures of 515 and 888.4°C. The results of TGA/DTA for cane wood, PKF and ceiling board observed a similar pattern of degradation. The reduction in degradation in the produced ceiling board is a result of the hybridized cane wood and PKF.
FTIR analysis of the produced ceiling board
The FTIR analysis was conducted on produced ceiling board to ascertain the active functional groups. From Table 11, the FTIR spectra for the produced ceiling board can be seen to show a good number of peaks. However, three absorption peaks at 2918.5, 1595.3 and 1006.4 cm−1 are the relevant peaks, which are assigned to the C–H, N–H and C–N functional groups from alkane and amines functional groups respectively. The presence of the high Amine group can be attributed to the presence of cane wood (which has Amine as the active functional group) as a constituent of the ceiling board materials. The alkane group is attributed to Low-Density Polyethylene (LDPE) which is also present in the ceiling board.
Functional group compositions of cane wood.

The absorption bands and functional groups indicated from the FTIR spectrum of produced ceiling board are outlined in Table 11. The IR spectrum indicates absorption peaks at 3693.8, 3652.8, 1481.1 and 1408.9 cm−1 was assigned to the O–H functional group from hydroxyl group from alcohol, ethanol, methanol and phenols. While the 3270.3 cm−1 absorption peak was assigned to the –C≡C–H functional group of alkyne, 2918.5 and 2847.7 cm−1 was assigned to C–H functional group from alkanes, 2087.3 cm−1 was assigned to C=O functional groups from ketones. The presence of broadband corresponding to 1874.9 and 1315.8 cm−1 was attributed to the C–H and C–O stretching vibration of aromatic group. The 1595.3 and 1006.4 cm−1 were assigned to N–H functional group from amines. The stretching/bending of =C–H, C–O and C–C saturated bond indicates the presence of alkenes, alcohol and benzene. The band absorbance at 1543.1 and 827.5 cm−1 is attributed to stretching of –NO2 and C–Cl saturated bond, indicating the presence of an aliphatic group. This demonstrates that the material contains active O–H functional groups.
Density, specific heat capacity and heat flux of the ceiling board
The density and relative density of the produced ceiling board sample were obtained by applying the obtained data to Equation 2, and the value of density is reported as 0.7689 gcm−3 as shown in Table 12. This value is higher than the value of 0.611 gcm−3 reported by Onyekunle et al. 27 The S.H.C of the produced ceiling board was determined using the experimental method reported by Onyekunle et al. 27 , with equation (11). The following data; an initial temperature of water, T1 = 30°C, temperature of boiling water, T2 = 100°C, and the final temperature of the mixture, T3 = 43°C was obtained from the experiment to determine the S.H.C of the ceiling sample. The thermal energy supplied was recorded as shown in Table 12. The S.H.C of the produced ceiling board sample as shown in Table 12 indicated that the biomass-based ceiling board has a low S.H.C value of 769.23 Jkg−1K−1. This established that biomass-based ceiling boards would generate low thermal energy. The S.H.C of 769.23 Jkg−1K−1 obtained from the produced ceiling board is in close range with the value of S.H.C of asbestos (848.3107 Jkg−1K−1) reported by Onyekunle et al. 27 , and also, in close range to the value of agro-waste based ceiling board (909.1 kg−1K−1) reported by Ezenwa et al. 3 This result shows that the developed sample is a suitable substitute for asbestos.
Other properties of the ceiling board.

The heat flux of the ceiling board sample was determined using equation (12) and reported in Table 12. The result of heat flux is significantly low and is in reasonable agreement with the result of 23.86 Wm−1 for PVC as reported by Onyekunle et al. 27
Conclusion
Cane wood and PKF have successfully been used as filler materials for producing ceiling boards. Its low density and good thermal resistivity are two main characteristics that make it suitable as a filler material for this purpose. With recycled LDPE as the binder, this work goes forward to encourage recycling and consequently the reduction of polyethylene pollution of the environment. From the results obtained from this work, the following conclusions are drawn;
Both the process and production parameters studied have significant effects on both the physical and thermal properties of the ceiling board.
The recycled LDPE proved to reduce the water absorption rate of the developed ceiling board on its increase.
On thermal testing of cane wood, it showed a thermal stable up to temperatures as high as 325°C and PKF can be said to be thermally stable up to 310°C.
Cane wood and PKF showed the presence of one active functional group, which is the C–N group from Amine and the O–H group from alcohol.
The optimized ceiling board showed a thermal resistivity, thermal conductivity, water absorption and thickness swell of 16.192 W/M.K, 0.6618 Wm−1K−1, 4.669% and 6.594% respectively and also, a specific heat capacity, thermal energy and heat flux of 769.23 Jkg−1K−1, 60 W and 23.07 kWm−1, respectively.
As a result of the results obtained in comparison to other agro and synthetic waste-based ceiling boards, the developed hybrid cane wood-PKF, and recycled LDPE-based ceiling is an excellent choice for building applications.
To reduce water absorption or permeability, the composite ceiling board must be treated with bituminous materials. To improve the qualities of the ceiling board, commercial production might be mechanized.
Footnotes
Handling Editor: Chenhui Liang
Declaration of conflicting interests
The author(s) declared no potential conflicts of interest with respect to the research, authorship, and/or publication of this article.
Funding
The author(s) received no financial support for the research, authorship, and/or publication of this article.