
Abstract
To study the influence of the free piston generator structure on its stable operation, this paper chose the combining mathematical and physical methods to build a simulation model to investigate the influence factors. According to the dynamic and thermodynamic equation, the mathematical model of the free piston internal combustion generator system was established. the simulation model was built with the help of MATLAB/Simulink software, and the validity of the model was verified. Based on this, the influences of ignition position and piston group mass on the operation characteristics of free piston generator were investigated. The simulation results show that the factors such as ignition position, piston group mass have significant effects on the compression ratio, cylinder pressure, maximum acceleration, etc. of the free piston generator, which provides a theoretical basis for the stable operation control of the free piston internal combustion generator.
Keywords
Introduction
The free piston internal combustion generator (FPEG) cancels the crank connecting rod structure, and the piston drives the generator mover to do reciprocating cutting of the magnetic inductance line, thus outputting electric energy. Therefore, as a new type of power mechanical device, FPEG is suitable for applied in new energy vehicles, marine submarines and other hybrid power devices due to its simple structure, light weight, multi-fuel adaptability, 1 good balance characteristics, and high thermal efficiency. 2
However, since the engine lacks limitations from the crank connecting rod structure, it is difficult to constrain the piston motion state, 3 and the change of the piston motion state will inevitably affect the next compression process and lead to the change of the compression ratio. 4 The change of compression ratio directly results in the deterioration of combustion conditions, which is very easy to cause engine misfire or cylinder collision shutdown in serious cases, and has an important impact on FPEG performance. Therefore, at present, domestic and foreign researchers have conducted multi-directional research around FPEG cylinder stable operation. 1 For example, Mikalsen et al. carried out predictive control of FPEG’s piston motion to improve the load anti-jamming ability. 5 Raheem et al. investigated the operating parameters of FPEG to improve the generator performance and reduce emissions. 6 The University of West Virginia used the methods of numerical simulation to study the parameters that have impacts on the work index, and found that there is a correlation between frequency and quality. 7 Zhang et al. studied the source of cycle variation and inter-cylinder variation of two-cylinder FPEG, and built a working model to analyze its influence on piston motion characteristics and generator performance. Results showed that FPEG is easily affected by external conditions and operating parameters. 8 Goto et al. studied the basic characteristics of FPEG through experimental methods, and the results showed that control logic is the key technology to achieve stable operation. 9 Moriya et al. studied piston motion by building a one-dimensional model and concluded that control is the key factor for stable operation of the system. 10 Raheem et al. studied parameters affecting FPEG performance through experiments, and the results showed that piston motion control is the key issue to affect FPEG stability. 11 ZHANG et al. studied the influence of structural parameters on generator performance by simulation, and the results showed that cylinder diameter ratio and stroke have great influences on thermal efficiency, fuel economy and ignition position. 12 Feng et al. studied the influence of key parameters on the startup process, proposed a method for comprehensive optimization of design and operation parameters, and investigated the impact of key design parameters (like the mover assembly mass and stroke ratio) on the system operation characteristics. 13 Li et al. built a MATLAB/Simulink model to study the friction differences between traditional crankshaft engine and FPEG. The simulation results showed that the total average friction power in FPEG decreases observably. The friction power of piston ring increases along with the growth of lubricating oil temperature and operating frequency, while decreases with the growth of lubricating oil viscosity. 14 Li et al. studied the effect of external resistance load and equivalent ratio on the performance of FPEG. It was found that the Top Dead Center (TDC) was susceptible to external loads and other parameters. Along with the decrease of the equivalent ratio, the compression ratio and the thermal efficiency increase. Under the same conditions, the peak temperature of traditional engine is much higher than that of FPEG engine. 15 Free operation of pistons leads to differences between FPEG cycles, 16 and in-cylinder cycle stability is a key factor for high performance of FPEG systems. 17 Therefore, it is of great significance to study the influence of operation and structural parameters on system performance for stable operation 18 and high performance 19 of FPEG.
In this work, the characteristics of FPEG were described by combining mathematical and physical methods, a system-level mathematical model of the working cycle of a FPEG with opposable two cylinders was constructed based on dynamics and thermodynamic equations, and the modeling and simulation were carried out in Matlab/Simulink to verify the effectiveness of the model. Based on the model, the effects of operation and structural parameters on the performance of the FPEG were studied. In order to improve the performance of FPEG, the performance parameters were optimized to obtain the optimal values. This work will provide theoretical reference for the design of the prototype structure of the FPEG and the development of the subsequent control strategy.
Mathematical simulation model of FPEG
The opposed FPEG is mainly composed of the opposed cylinder, piston assembly and the generator rigidly connected with the piston. The structural diagram is shown in Figure 1.

Structure diagram of the FPEG.
As shown in Figure 1, the FPEG system can be divided into the internal combustion engine part and the generator part. The internal combustion engine part is composed of cylinders and pistons. The pistons oppositely distributed in the cylinders are connected by the rigid method through the connecting rods. The generator is mainly composed of stator and mover. The mover is fixed in the middle of the connecting rod. When the stator and mover generate relative motion, the electromotive force will be produced. During the piston motion along with the cylinder, the intake, exhaust, and scavenging valves will be opened and closed in accordance with the specified order, therefore realizing the intake, compression, work and exhaust processes of the internal combustion engine. Because its working principle is similar with the two-stroke internal combustion engine, it can be studied by means of the working mode of traditional internal combustion engine.
Dynamic model of piston under steady state
The piston assembly is the main moving part of the FPEG. When the system is in stable operation, the force exerted on the piston assembly will be transmitted to the direction of piston motion, and the direction of resultant force will determine the movement state of the piston. The force exerted on the piston assembly is shown in Figure 2.

Stress diagram of piston assembly.
Based on Newton’s second law, the dynamic equation of the piston assembly can be deduced as follows:

Wherein, Fburn is the gas pressure of combustion chamber, Fprs is the gas pressure of gas drive chamber, and subscripts 1 and 2 represent two cylinders on both sides, respectively. Felc and Ffrc are electromagnetic resistance and friction force of mover assembly, respectively.
Modeling of internal combustion engine module
The modeling of internal combustion engine module is mainly based on the research methods and structures of previous studies.20,21 A zero-dimensional single zone model is used to express the thermodynamic process of FPEG. As the working principle of this module is similar to that of a traditional two-stroke engine, therefore, the unilateral cylinder thermodynamic cycle of the FPEG can be divided into four processes: compression, combustion, expansion, and exhaust/scavenging. The schematic diagram of the relationship between cylinder piston phase and thermodynamic cycle is shown in Figure 3.

The relationship between cylinder piston phase and thermodynamic cycle.
Modeling of compression process
In the compression process, the exhaust port is closed. In an enclosed space, the gas works on the piston and moves to the bottom dead center (BDC). There is no fuel combustion in the first stage of compression, therefore, the pressure change in combustion chamber and scavenging chamber can be described by Formula 2:
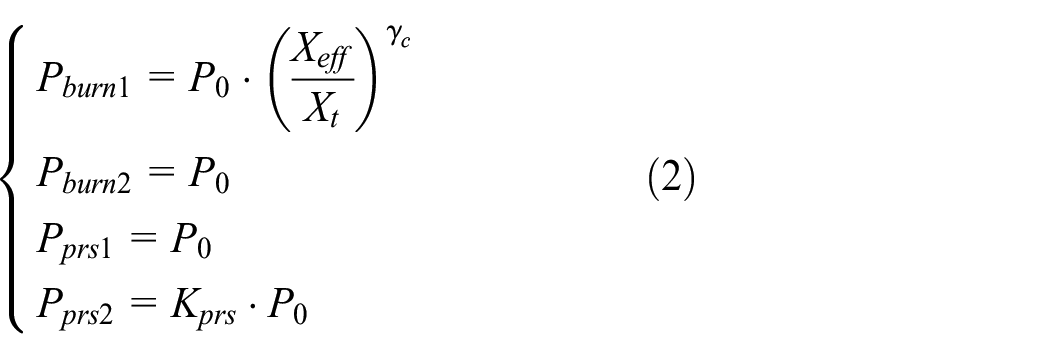
Wherein, Pburn1 and Pburn2 are the gas pressure in the left and right combustion chambers of the FPEG, respectively. P0 is atmospheric pressure, Pprs1 and Pprs2 are the gas pressure in the left and right scavenging chambers of the FPEG, respectively. Kprs is a constant coefficient representing the relationship between atmospheric pressure and scavenging pressure. Xeff is the compression length, Xt is the actual position of the piston, γc is the compression polytropic index. Then the thrust Feng of the internal combustion engine module can be calculated by Formula 3:

Wherein, Aps is the piston area.
The second stage of compression has combustion heat release, so this will be introduced in the combustion process.
Modeling of combustion process
In case of combustion and heat release in a confined space, it can be seen from the first law of thermodynamics that:

In order to satisfy the conditions of the ideal gas equation, it is assumed to be an ideal gas, then the equation is:

Take the derivative of formula 5 as follows:

Formula 6 is sorted out, and the change rate of gas pressure is shown in Formula 7:

Among them, γ is the thermal insulation coefficient. The change of heat can be expressed by combustion heat release and heat exchange:

Wherein, Qc is the energy released by combustion, and Qht is the energy change due to heat exchange.
The combustion heat release is usually obtained based on the combustion heat release model. Here, the zero-dimensional heat release model is used for research, and the heat release process is described by Wiebe combustion rate formula. 22 Since the heat release rate formula uses the crankshaft angle to judge the combustion process, which cannot be directly applied to FPEG, the time parameter is used to replace the crankshaft angle parameter in the formula, and the heat release rate function can be expressed as:

Wherein, Qin represents the heat entering the system, τ(t) represents the mass fraction of combusted gas at time t. t0 is the start time of combustion, tc is the duration of combustion, a and b are adjustable empirical parameters. 23
In the combustion process, the loss caused by the heat transfer of the gas to the cylinder wall has a great impact on the thermal efficiency, which needs to be considered. The energy change Qht caused by the heat exchange can be obtained by using the heat transfer model, and the Hohenberg formula can be used to obtain:
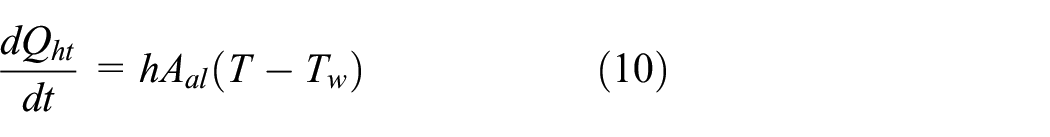

Wherein, Aal represents the contact area between the cylinder and combustion gas, Tw is the cylinder wall temperature, and Vsp is the average speed of the piston assembly.
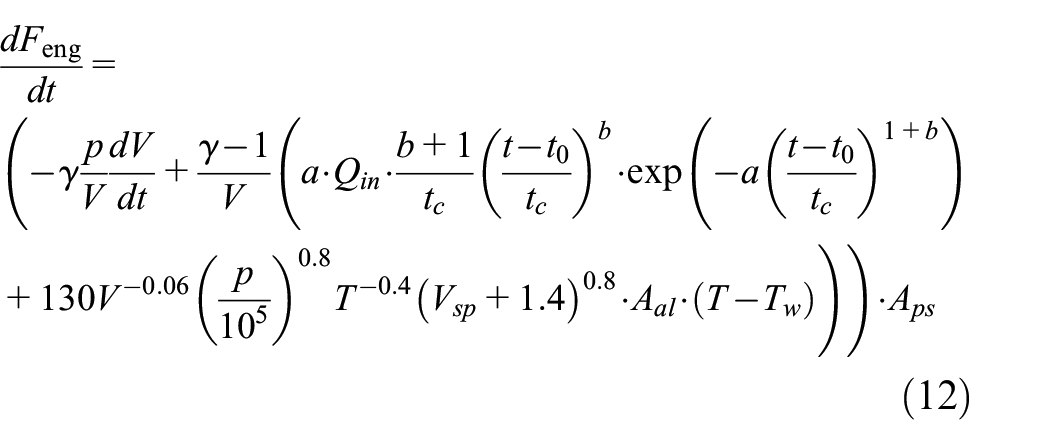
The force exerted on the piston during heat release process can be obtained by substituting Formulas 8–11 into Formula 7:
Modeling of expansion process
The first stage of expansion is still accompanied by combustion heat release, so this stage is put into the combustion process. After the combustion is complete, the second stage of expansion begins. At this time, the high-temperature gas expands rapidly, and the energy is converted and dissipated. It can be described by Formula 13 obtained by substituting Formula 10 into Formula 7:

In this process, the thrust of high-temperature gas on the piston is:

Modeling of exhaust/scavenging process
After the exhaust port is opened, the pressure in the cylinder drops rapidly. Meanwhile, the impact on the piston at this stage is far less than that of cylinder compression. In order to calculate, we assume that when the external atmosphere is connected with the combustion chamber, the air pressure in the cylinder drops rapidly to the atmospheric pressure, meanwhile, this stage and the compression process are mutually inverse, as shown in Formula 15:

Wherein, Xtot is the maximum stroke of the piston. Meanwhile, the force exerted on the piston in this process can be expressed by Formula 16, in which the positive and negative signs indicate that the force exerted is the same as and opposite to the piston motion.

Modeling of linear generator
In the FPEG system, the final and very important energy converter is the linear generator, which can convert kinetic energy into electrical energy for external energy output. However, because different generators have different working principles and output characteristics, it is impossible to use one model to describe different generators. Therefore, only common descriptions are made during model modeling, and the relationships are described by Formulas 17–19:

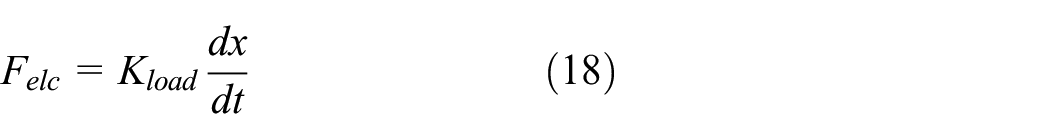

Formula 17 describes the changing relationship between generator induced electromotive force ε and magnetic flux Φ. Here, only the relationship between electromotive force and magnetic flux is described, and the mechanism of magnetic flux generation is not discussed. Formula 18 describes the relationship between electromagnetic resistance and speed, and Formula 19 describes the relationship between electromagnetic resistance and current. Wherein, Kload and Ki are generator load coefficient (N·m−1·s−1) and thrust coefficient (N/A), respectively.
Modeling of friction force
In the working process of the FPEG, the mechanical friction caused by the alternating motion of the piston in the cylinder is the main source of friction force. Compared to the traditional engine, FPEG is only affected by the force in the direction of movement, so the friction force action relationship is relatively simple and the friction force value is stable. Since the influence of the piston lateral force of is not considered, it can be simplified as sliding friction, which can be shown in Formula 20:
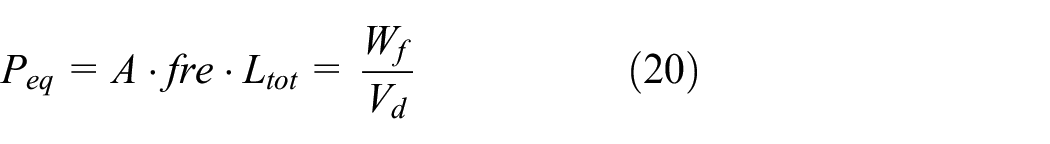
Wherein, Peq is the equivalent pressure (Pa), A = 150 (kg·m−2·s−1), Fre is the frequency, Ltot is the maximum stroke of the piston, Wf is the work done by the piston to surmount friction, and Vd is the combustion chamber volume (m3).


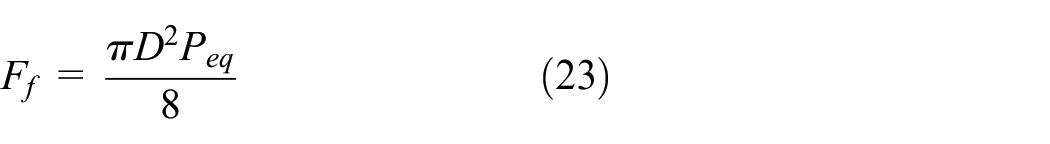
Wherein, D is the piston diameter (m 2 ), and the equivalent friction force is:
Simulink modeling and analysis
Simulink modeling
Through the mathematical modeling of each subsystem of the FPEG, the FPEG system can be completely described. Meanwhile, in order to further analyze the operation characteristics of the system, Simulink is needed to build a simulation model, as shown in Figure 4. Figure 4(a) shows the general system model. The models of the generator and friction force subsystem can be directly displayed in the general model. The internal combustion engine subsystem is represented by two-cylinder modules, left and right, because the system contains many contents. Figure 4(b) shows the expanded view of the single side cylinder system, which is designed in four parts: compression, combustion, expansion and exhaust/scavenging. Each subsystem works together to complete the thermal process. The parameters of each subsystem are input into the simulation model to realize the simulation of the working process of the existing prototype. Based on the existing small FPEG platform, some parameters to improve the Simulink model are adjusted, and then the target simulation was achieved, the simulation parameters are shown in Table 1.

Simulink model of FPEG: (a) general system model and (b) internal combustion engine subsystem model.
Parameters of simulation prototype.

Operation characteristics analysis of FPEG
The cylinder pressure characteristic curve is one of the basic operation state curves of the FPEG, and this curve can be used to evaluate its basic performance. The model simulation calculation is conducted according to the parameters in Table 1, and the piston operation curve and cylinder pressure curve are obtained, as shown in Figures 5 to 7. Figure 5 shows the cylinder gas pressure curve of a FPEG system, suggesting the system process from startup to stable operation. As can be seen, the cylinder pressures of the two cylinders do not overlap because the overlap length of the valves in the model is set as 0, and the exhaust ports are alternately opened and closed, with one side at the compression stroke and the other at the exhaust stroke. The downward phase of the curve pressure spike has a trend toward a vertical drop at the end, this is because, in the model, the in-cylinder pressure is set as equal to the external atmospheric pressure when the exhaust valve is opened.

Cylinder gas pressure characteristic curve.

“P-V” curve of single side cylinder.

Piston motion phase curve.
Figure 6 shows the “P-V” curve of the cylinder on the operation side of the FPEG system. The area of the curve represents the indicated work of the system cycle, whereby the indicated work and indicated efficiency of the system working cycle can be analyzed. Meanwhile, as shown, when the volume is about 1.8 × 10⁻⁵ m3, the pressure on the curve drops to the standard atmospheric pressure, which also indicates that this position is the position where the exhaust port on this side is opened. The cylinder pressure is then the same as the ambient atmospheric pressure until the start of the next compression stroke.
Figure 7 shows the phase curve of piston motion. It can be seen that under stable operation conditions, the piston motion trajectory will converge to form a limit cycle. Any point on the ring shows the relationship between piston speed and position at a certain moment, thereby clearly understanding the operation state of the piston.
Model validation
The simulation results in Figures 6 to 7 were compared with the test and simulation results in previous literatures,23,24 as shown in Figures 8 to 9. As can be seen from Figure 8, the simulated in-cylinder pressure in the model is close to the experimental result of the FPEG, and the simulated pressure distribution area is similar to that of the experiment data, indicating that the model can predict the efficiency and operation of the FPEG. As displayed in Figure 9, the simulated speed is close to the experimental speed. Therefore, the proposed model can accurately predict the performance of the FPEG, and provide theoretical support for the study of operation control of the FPEG.

Relationship curve between in-cylinder gas pressure and combustion chamber gas volume.

Relationship curve between piston speed and piston position.
Parameterized research on characteristics of FPEG
During the operation process of a FPEG, the mass of the piston assembly and the load applied to it will have an impact on its motion state. Therefore, in this work, the effects of these parameters on the piston operation characteristics were analyzed and studied, which can reveal the operation characteristics of the FPEG and provide a reference for its structural design. Due to the choice of heat release is based on the factors such as combustion chamber volume and fuel availability, in order to simulate different combustion heat release conditions, three different types of heat release (23.6/30.3/37 J) were selected for simulation analysis. Besides, the piston mass and ignition position were selected as variables to study their impact on system operation.
Impact of piston mass on the operation of FPEG
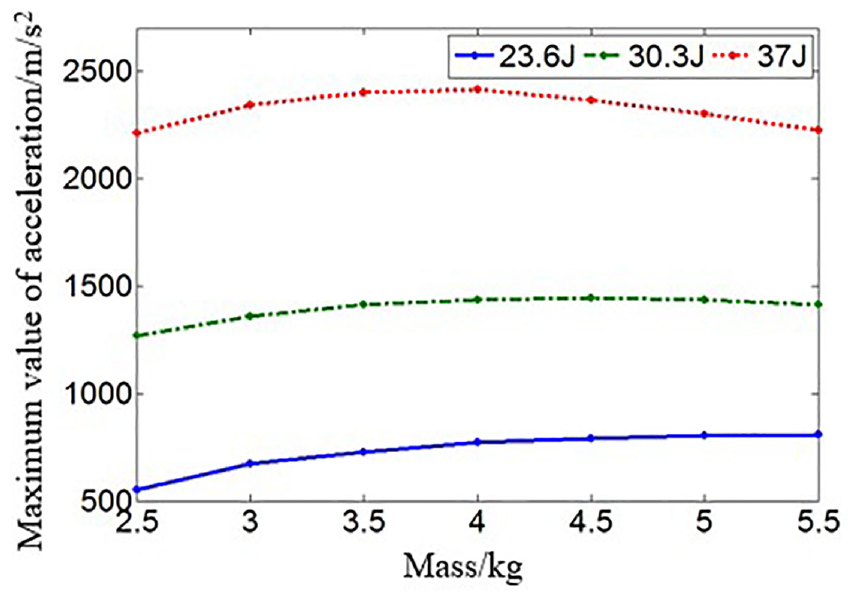
During the working process of the system, the piston moves under the effect on high-pressure gas, and the piston mass has a significant impact on acceleration, which will cause changes in operation conditions. Figure 10 shows the relationship between piston mass and maximum acceleration. As can be seen, in the three curves, the maximum acceleration exhibits a trend of first increasing and then decreasing as the piston mass increases. The height of the acceleration curve increases with the increase of heat release, but the piston mass corresponding to the maximum acceleration value gradually decreases. The reason is that the change in piston mass is related to the change in compression energy. As the mass increases, the compression ratio increases, thus greater cylinder pressure will be generated during combustion, and the acceleration will also increase. As the mass increase continually, the increase in cylinder pressure will not be able to overcome the impact of the increase in mass, therefore leading to a decrease in acceleration. This process is shown in Figure 10.
Relationship curve between piston mass and maximum acceleration.
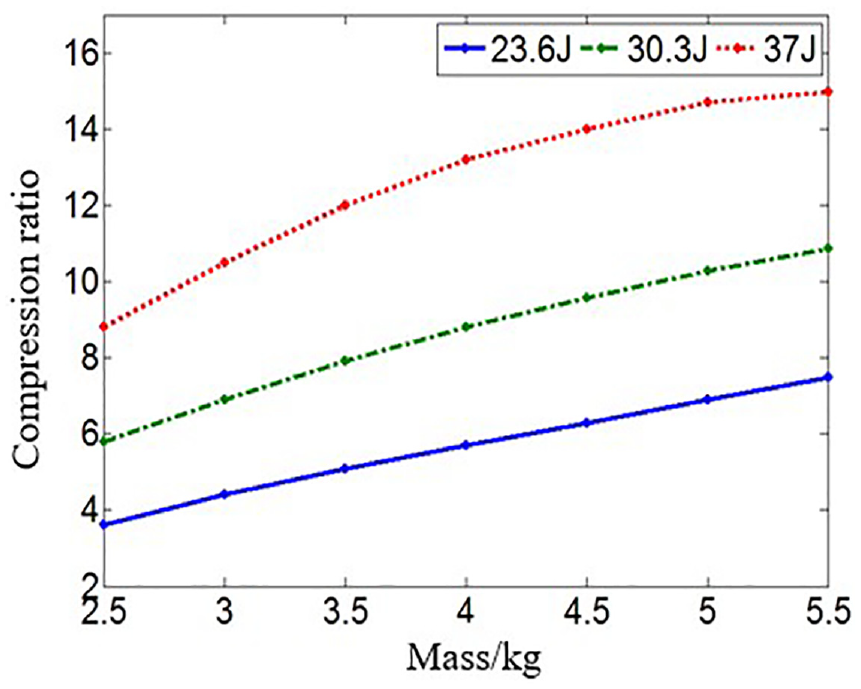
Figures 11 and 12 show the relationship between compression ratio, peak cylinder pressure, and piston mass. As can be seen from Figures 11 and 12, the compression ratio and cylinder pressure show a monotonic increasing trend as the piston mass increases, and larger heat release will correspond to higher cylinder compression ratio and cylinder pressure at higher positions on the curve. Therefore, there is a strong correlation between the compression ratio and the peak cylinder pressure of the FPEG. However, due to the constraint of the crank, the compression ratio of a traditional engine is constant and not related to the cylinder pressure.
Relationship curve between piston mass and compression ratio.

Relationship curve between piston mass and cylinder gas pressure.
Figures 13 and 14 show the influence curves of piston mass on output power and thermal efficiency, respectively. As shown in Figure 13, when the heat releases are 23.6 J and 30.3 J, the output power first increases and then decrease. When the heat release is 37 J, the output power presents a downward trend. Since the system cannot work stably when the piston mass is low, it is speculated that if the piston mass can decrease continually, there may be an extreme point corresponding to the heat release, leading to a decrease in power. As can be seen from Figure 14, under three different heat release conditions, the indicated efficiency presents a trend of first increasing and then decreasing, the maximum position moves toward the direction of decreasing mass as the heat release increases. The reason is that after the piston mass changes, movement away from TDC and toward TDC will result in speed changes.
Effect of piston mass on output power.

Effect of piston mass on indicated efficiency.
Figure 15 is a schematic diagram of the impact of piston mass on reciprocating frequency, and the frequency variation trend varies with different heat releases. When the heat release is 23.6 J, the reciprocating frequency of the piston first increases and then decreases, with a maximum value in the range of 3–4 kg. When the heat release is 30.3 J, the frequency curve corresponding to a smaller piston mass is flatter, and then begins to decline. When the heat release is 37 J, the piston frequency presents a monotonic decreasing trend.

Effect of piston mass on reciprocating frequency.
Effect of ignition position on FPEG
The impact of ignition position on FPEG and the impact of ignition advance angle on traditional engines are similar. The ignition position is usually using TDC of the cylinder as the reference zero point for distance calculation. The ignition position premise will increase the peak pressure of the cylinder, but it will be very prone to detonation. A delayed ignition position will decrease the cylinder peak pressure and the engine efficiency. Therefore, selecting the appropriate ignition position is very important. For the convenience of analysis, assuming the same combustion duration, the effect of ignition position on piston acceleration is shown in Figure 16. As can be seen, there is an extreme point on the curve with the lowest heat release, and the piston acceleration decreases after the point. The acceleration of the other two curves gradually decreases with the ignition position lagging. At the position of the attachment at the top of the cylinder, the curve shows a gentle trend.
Impact of ignition position on acceleration.
As shown in Figure 17, the backward movement of TDC position will lead to an advance in the ignition position, leading to an earlier occurrence of the cylinder peak pressure. Moreover, as the TDC position moves backward continually, this time will appear earlier. Therefore, the backward movement of the ignition position of the piston will result in a continuous decrease in compression ratio.

Effect of ignition position on compression ratio.
Figure 18 shows the change of the peak pressure in cylinder, with an extreme point appearing on the curve with a heat release of 30.3 J. This is because that the peak cylinder pressure approaches the TDC, resulting in a relatively small space volume that forms the cylinder pressure, and leading to the occurrence of the extreme value. When the ignition position continues to move backward, a larger pressure prevents the piston from further compressing, resulting in the decreases in compression ratio and cylinder pressure. Meanwhile, as the heat release increases, the impact of heat release on the change in cylinder pressure exceeds the impact of compression ratio, leading to a gradual decrease in cylinder pressure without any extreme points, as shown in the 33.6 and 37 J curves in Figure 18.
Effect of ignition position on peak cylinder pressure.
Figure 19 is a schematic diagram of the relationship curve between ignition position and indicated efficiency. The indicated efficiencies of the three curves shows a monotonic decreasing trend as the ignition position moves backward. This is because that as the ignition position moves backward, the speed of the piston moving toward TDC decreases, while the relative time increases. On the indicator diagram, it shows an increase in compression work, thus indicating a decrease in efficiency.

Effect of ignition position on indicated efficiency.
Figure 20 is a schematic diagram of the relationship curve between ignition position and piston reciprocating frequency. Moving the ignition position backward will cause the reduction in distance between the left and right cylinders, and the increase in the reciprocating frequency of the piston. Meanwhile, moving the ignition position backward will also decrease the pressure inside the cylinder, reducing the piston recovery force, piston speed, and reciprocating frequency. The two factors are rising and falling. The increase in reciprocating frequency caused by the ignition position moving backward is much more significant, resulting in an overall increase in reciprocating frequency.
Effect of ignition position on reciprocating frequency.
Figure 21 shows the relationship curve between ignition position and output power, and the variation of piston output power is influenced by reciprocating frequency and indicated efficiency. During this process, the piston reciprocating frequency increases, but the change rate is very small. Meanwhile, the indicated efficiency decreases significantly, therefore, the impact of a decrease in efficiency on output power exceeds the impact of an increase in frequency on that, leading to an overall decrease in system power. At the same time, the shape and position of the efficiency curve corresponding to different heat releases are very similar, so it can be considered that the influence of heat release on the indicated efficiency is relatively weak.
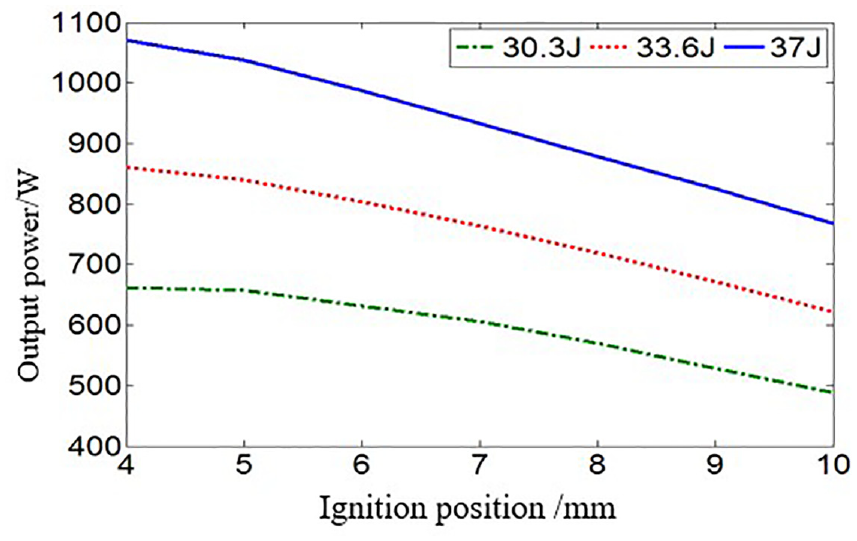
Effect of ignition position on output power.
Conclusions
Compared with the traditional engine, the FPEG is not constrained by the crank connecting rod structure, which leads to the differences between its cycles, and then affects the performance of the FPEG. In order to solve these problems, simulation methods were used in this work to study the effects of structural parameters and operation parameters on the performance of FPEG. A system-level mathematical model of FPEG was built based on dynamics and thermodynamics equations and its accuracy was verified, then the effects of piston mass and ignition position on FPEG performance were studied. The influence of piston mass on FPEG performance is relatively significant. The maximum acceleration and indicated efficiency have maximum values on the mass gradient, while the output power has similar characteristics, and there may be extreme points. The compression ratio and peak cylinder pressure show a monotonically increasing trend with the increase of piston mass. When the ignition position is far away from the top of the cylinder, the variation trends of the piston maximum acceleration and the cylinder peak pressure are similar. When the heat release is low, they show downwards trends. When the heat release is large, the variation trend is relatively gentle near the top of the cylinder, but the overall trend is downwards. The compression ratio shows a downwards trend of concavity. The indicated efficiency and output power tend to decrease as the ignition position moves away from the top of the cylinder, and the efficiency curves corresponding to different heat releases have similar variation trends. In short, this work provides theoretical reference for the design of the prototype structure of the FPEG and the development of the subsequent control strategy. In the future, we will devote ourselves to develop the real FPEG control system and design available prototype.
Footnotes
Handling Editor: Chenhui Liang
Declaration of conflicting interests
The author(s) declared no potential conflicts of interest with respect to the research, authorship, and/or publication of this article.
Funding
The author(s) received no financial support for the research, authorship, and/or publication of this article.