
Abstract
During the operation of high-speed railway, the transition-point disappearance phenomenon, which is caused by the deformation of pantograph head, poses a safety threat to the pantograph-catenary system. In this study, the analytical model for transition-point disappearance analysis is presented. The instantaneous profile, as well as the deformation process of the pantograph head under different contact force values and positions or different pantograph-head parameters can be solved using the model. Curve equation, force analysis, coordinate axis rotation, and few other methods are adopted to achieve simplified modeling. The proposed modeling method and analysis conclusion provide theoretical support for the permissible contact force range calculation and pantograph-head parameters optimization to prevent transition-point disappearance. The effectiveness of the proposed model is verified using both finite element simulation and experimental measurements. Finally, a case analysis for the prevention of transition-point disappearance is conducted, using pantographs with the models CX-GI and DSA250 as examples.
Keywords
Introduction
The pantograph of a high-speed railway is generally installed on the roof of high-speed vehicles to transfer electric energy from the catenary to the vehicle. 1 The pantograph head, which consists of contact strips and pantograph horns, is the uppermost component of the pantograph. The contact strip is the only interface between the vehicle and fixed power supply equipment. Therefore, the interaction between the contact strip and the contact line is significant to the power supply of the high-speed railway and directly impacts the safe and reliable operation of the vehicle. 2
The contact strip will be deformed due to the normal force exerted by the contact line, thereby changing the relative shape of the contact strip and the pantograph horn. When the end of the strip horn is tilted and above the profile of the pantograph horn, the intersection point between the contact strip and the pantograph horn disappear. This phenomenon is referred as transition-point disappearance in this study. It will cause abnormal wear of the contact strips and the pantograph horn near the transition point as well as the offset of the pantograph arm. 3 The abnormal wear can lead to irregularities in the contact line, increasing safety hazards. The offset of the pantograph arm alters the effective range of the contact strip. Under extreme circumstances, the contact strips get detached from the contact line, and the vehicle power supply is disconnected, causing accidental shutdown. In a word, transition-point disappearance is a serious safety hazard during high-speed railway operation and needs to be eliminated.
To date, some efforts have been made aiming at the above issue. The core idea is online monitor or fault detection. For example, online contact point detection (CPT) is widely utilized and extensively researched.4–7 The use of artificial neural networks for CPT has also been proposed, thus improving the adaptability of traditional method to a complex background.8–12 Zhang et al. 13 combines kernelized correlation filters, result refinement, and result confidential evolution to realize the real-time tracking ability of CPT in image sequences. A contact point regression residual network (CPRR-Net) is proposed in Shen et al. 14 to further improve the CPT accuracy. In addition to CPT, there are also extensive studies on fault detection or monitoring of the contact strip. The traditional method relies on manual judgement.15–18 The laser-displacement-sensor based detection algorithms have strong anti-interference ability, high accuracy, but high cost.19–21 Image processing used for contact strip monitoring has been a research hotspot in recent years. 22 Edge algorithm and deep learning algorithm are two main research directions.23–26 In addition, other methods, such as infrared ray, 27 multi-view analysis, 28 multi-scale wavelet analysis,29,30 CCD measurement technique, and adaptive mathematical morphology,31,32 have also been applied in fault detection or monitoring of contact strips. 33
However, the above methods only contribute to the detection of transition-point disappearance after it has occurred. No single study exists focusing on the prevention of transition-point disappearance. In fact, the occurrence of this phenomenon is influenced by multiple factors, such as parameters and operation conditions of the pantograph. A practical analytical model is at the heart of the problem.
Motivated by the above-mentioned issue, a modeling and analysis method of transition-point disappearance is proposed in this study. It has guiding significance for the design and operation of pantographs to prevent the occurrence of transition-point disappearance. The main contributions of this paper are as follows:
A static model of pantograph-head profile for the analysis of transition-point disappearance is established according to actual characteristics and parameters. Based on that, a dynamic model to establish the mathematical relationship between the contact force, pantograph parameters, and profile of the pantograph-head, is proposed. The complex deformation process of the pantograph-head is simplified and modeled using curve equation, force analysis, coordinate axis rotation, and few other methods.
The conditions leading to transition-point disappearance are analyzed. Ideas for preventing the transition point from disappearing are provided.
The paper is structured as follows: Section II provides an introduction of transition-point disappearance. In Section III, the static model of the pantograph-head profile is proposed. Section IV analyzes the dynamic model of the pantograph-head profile and examines the conditions leading to transition-point disappearance. Section V presents verifications and discussions. Finally, Section VI concludes the paper.
Transition-point disappearance
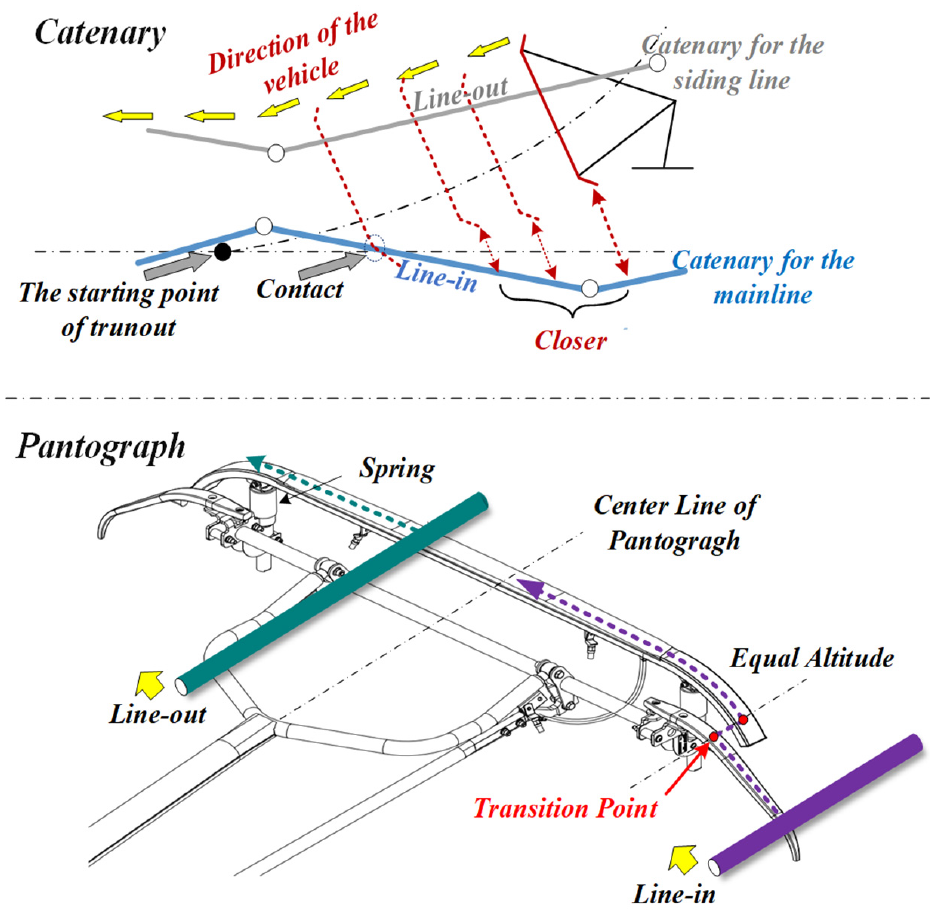
In the high-speed railway pantograph-catenary system, the contact strips are come into direct contact with the contact line which is the only interface between the vehicle and fixed power supply equipment, as shown in Figure 1. When the pantograph passes through a turnout of catenary, it moves from one contact line to another. The transition process can be described as shown in Figure 2.

Schematic diagram of pantograph components and the contact force.
Movement of two contact lines relative to the pantograph head.
At the turnout, the parameters of the catenary system for the main line are consistent with those of a regular catenary system. This means that the catenary system at the main line of turnout consists of a 150 mm contact wire, a 120 mm messenger wire, and a 35 mm elastic sling. The tension values for these components are 30, 21, and 3.5 kN, respectively. When the pantograph passes through the turnout of catenary, the train transitions from a siding track to a mainline track and operates at a speed of only 60 km/h. In this scenario, the oscillations of contact force induced by aerodynamic forces can be neglected.
As labeled in Figure 2, the transition point is the intersection point of the surface profile of the contact strip and the pantograph horn. This point also represents the equal altitude point of the two profiles. The contact line of the exit branch (“Line-out” for short) exits the pantograph along the blue track line, while the contact line of the entry branch (“Line-in” for short) moves along the purple track line. The Line-in comes into contact with the pantograph horn first, then passes through the transition point before moving toward the horn of the contact strip. Finally, it reaches the working range of the contact strip.
When the contact force of the Line-out acts on the contact strip, the contact strip tilts due to the different support forces on both sides of the contact strip. If the inclination angle is extremely high, the strip horn on the Line-in side also tilts, and the tail end of the strip horn is higher than that of the pantograph horn. Under such cases, there is no intersection point between the contact strip and the pantograph horn, as shown in Figure 3. This phenomenon is called transition-point disappearance.

Schematic diagram of translation-point disappearance.
Obviously, transition-point disappearance creates a step near the original transition point which hinders the contact between the Line-in and pantograph. When the step height is relatively low, the contact line collides with the tail end of the contact strip which resulting in abnormal wear to both the contact line and the pantograph horn. Further, when the step height is sufficiently high, the contact line cannot transition to the contact strip. The continuous friction of the contact line and contact strip leads to abnormal wear on both the tail end of the contact strip and the pantograph horn, as illustrated in situations A and B in Figure 4.

Consequences caused by the transition-point disappearance: (a) abnormal wear of the pantograph horn, (b) abnormal wear of tail end of the contact strip, and (c) offset of the pantograph arm.
There is a possibility of the pantograph arm getting offset by the mutual extrusion of the contact line and the contact strip, as depicted in situation C of Figure 4. Under such conditions, the contact line of the entry branch fails to enter the working state, resulting in a loss of electricity supply to the vehicle. In serious cases, this can lead to damaging consequences for the pantograph and catenary system.
Both engineering and academic research indicate that improper parameters of the pantograph or overhead contact system can lead to the occurrence of this phenomenon. As for the pantograph, when there is a significant height difference between the contact strip and the pantograph horn, causing a reduction in the overlapping region of their profiles, it may result in the transition-point disappearance. Alternatively, when the stiffness of the pantograph head spring is too low, causing excessive tilting of the contact strip after being subjected to forces, this phenomenon can also occur. As for the overhead contact system, irregularity of the contact wire can cause bad dynamic interactions with the pantograph, 34 leading to severe fluctuations in the contact force or even exceeding the contact force over the maximum allowable. Consequently, it can cause the tilting of the contact strip and leads to the transition-point disappearance. Under such circumstances, active or semi-active control of vertical contact forces should be applied to reduce the induced vertical oscillations of the line. 35 Additionally, for high-speed trains, we should also consider the influence of aerodynamics on contact forces. 36
Static model for pantograph-head profile
In this section, the profile of a pantograph without force is modeled first. As shown in Figure 5, the contact strip and the strip horn are simplified as two circular arcs that are tangent to each other, whose radii are R1 and R2, and the center coordinates of the circles are O1 and O2, respectively. The center coordinate of the curve of the right contact strip is (xo1, yo1). Obviously, xo1 = 0, yo1 = h − R1, where h represents the height difference between the bottom of the straight segment of pantograph horn and the highest point of the contact strip.

Modeling diagram of pantograph-head profile.
The center coordinate of the curve of the right strip horn, (xo2, yo2), can be deduced as follows:

According to the circular curve equation, the right-side profile equation of the contact strip is described as follows:


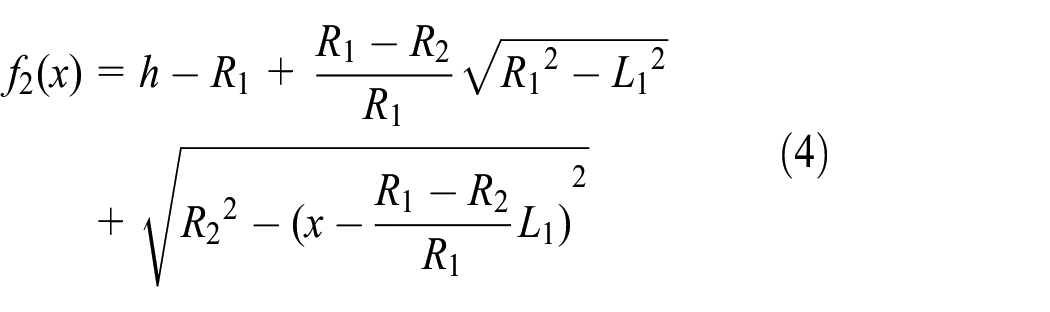
The profile of the pantograph horn is composed of two curves and one straight line. The radius of the curve near the contact strip is R3. The horizontal distance between the two ends of the straight line and the centerline of the pantograph-head profile are L3 and L4, and the angle between the straight line and the horizontal line is represented by β. The curve segment at the outermost end of the pantograph is not within the range of the transition zone specified by the pantograph function. Therefore, it is not considered here. The right-side profile equation of the pantograph horn is described as follows:


The transition point, (xt, yt), is the intersection point of the contact strip profile and the profile of the pantograph horn. The intersection point can occur on the curved section or straight section of the profile of the pantograph horn. Consequently, the following two sets of binary first-order equations are established:


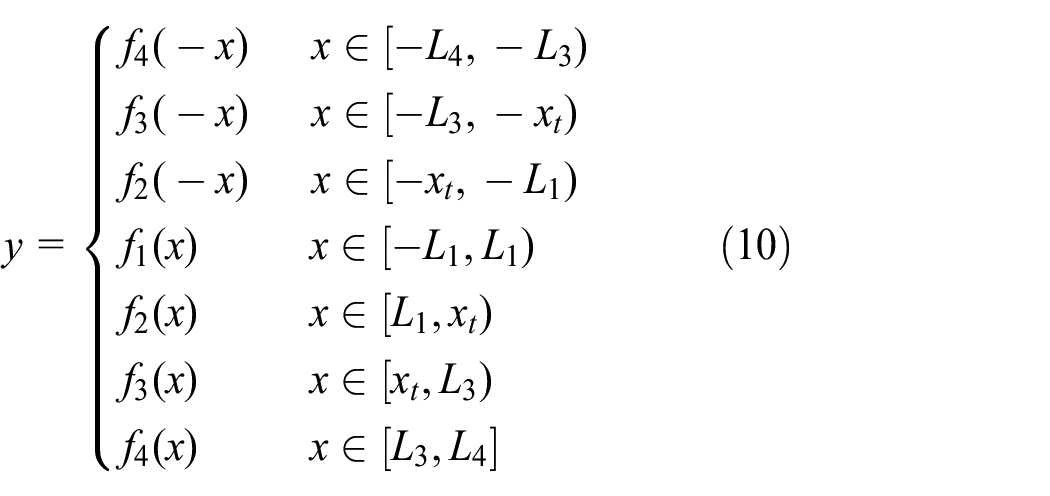
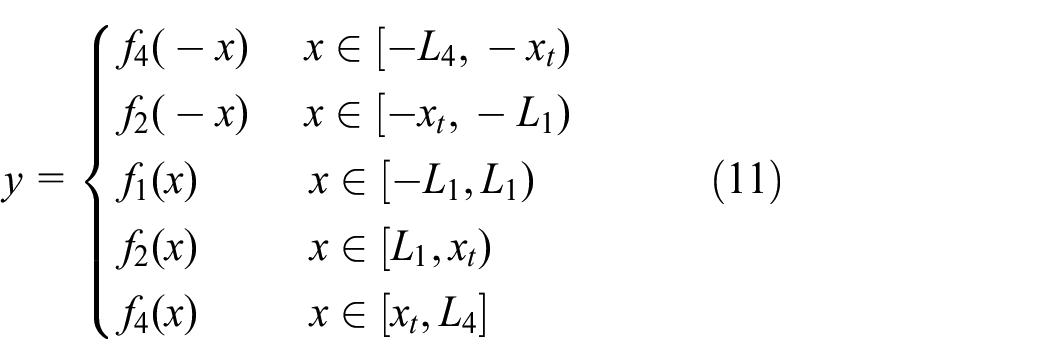
When the transition point is on the curved section, there is a real solution exists for equation (8), and xt ≤ L3 is satisfied. When it is on the straight section, there is a real solution exists for equation (9) and xt ≥ L3 is satisfied.
The pantograph head is symmetrical along the centerline. In the case of xt ≤ L3 and xt ≥ L3, the pantograph head profile can be described respectively as follows:
Dynamic model for pantograph-head profile and condition of transition-point disappearance
Sinking amount calculation of contact stripe
Under the contact force, F, at point xF on the X-axis, the pantograph springs on the left and right sides of the contact strip compress to different degrees. As a result, there are two sinking amounts (i.e. hL and hR) at the two springs as depicted in Figure 6.
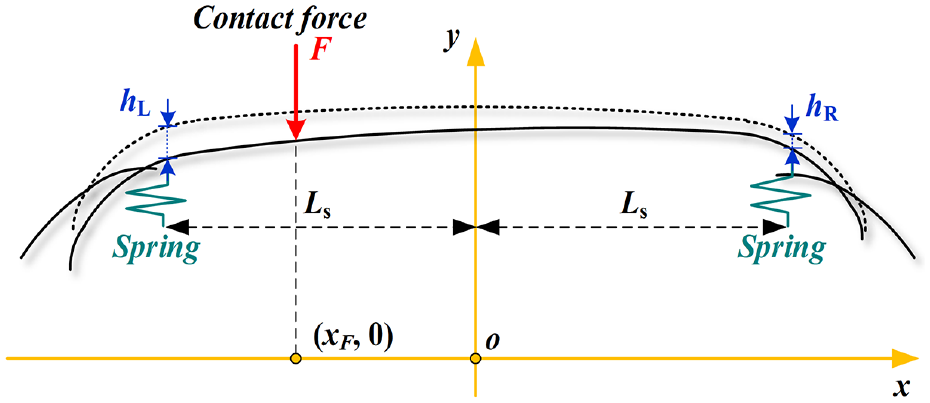
Deformation diagram of pantograph profile under the contact force.
For the pantograph with one contact strip, the pantograph springs are mounted perpendicular to the contact strip. In this case, the sinking amount hL or hR is proportional to the normal force acting on the corresponding pantograph spring. According to Hooke’s theorem, hL and hR can be expressed as follows:


where: kL and kR are the stiffnesses of the left- and right-side springs, respectively; and Ls is the distance between the centerline of the pantograph and each spring.
For the pantograph with two contact strips, the spring is not perpendicular to the pantograph head. Therefore, the relation between the sinking amount of the contact strip and the normal force at the spring is nonlinear. A simplified force analysis model is given in Figure 7.

Force analysis of horizontal springs (single side).
It can be deduced that: the spring force under the action of gravity, F1, and that under the combined action of gravity and normal force, F2, are as follows:
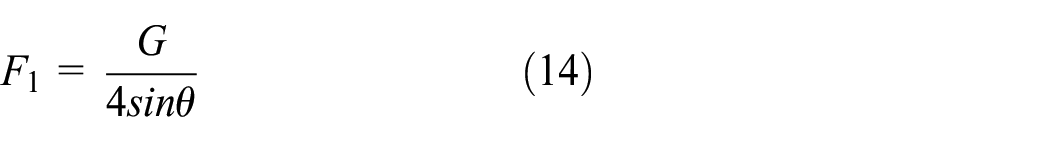
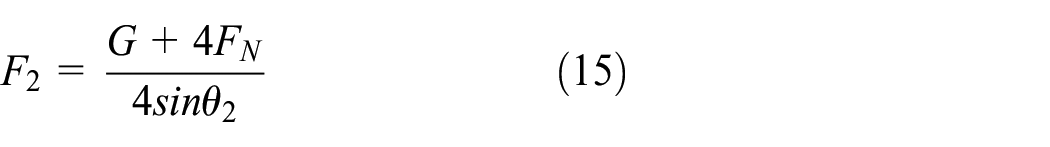
where: G represents the total weight of the contact strip and its components.
The following equation can be given according to Hooke’s theorem.

where: Lsp and Lsp2 are the equivalent lengths of the springs before and after the pantograph head is stressed by FN.
Further derivation shows that the sinking amount of the contact strip can be solved by following equations:


Dynamic model derivation
The move of the pantograph head under force can be divided into two processes: sinking and rotation, as shown in Figure 8.

Equivalent processes of the move of the pantograph head under force.
Based on the calculation results in the above section, the sinking amount, Δh, and the rotation angle, α, shown in Figure 8 can be expressed as follows:


In order to obtain the profile model under force, a new rectangular coordinate system, A(x′, y′), is established with the rotation point as the origin.
The following conversion can be used between A(x′, y′) and A(x, y):

In the coordinate system A(x′, y′), the profile rotates by α is the same thing as the coordinate system being rotated by −α. According to the rotation formula of coordinates, the rotation of (x′, y′) and (x″, y″) is given by:

According to above two conversion formulas, the key coordinate points in coordinate A(x, y) can be expressed in coordinate A(x′, y′) as given in Appendix I.
Similar to the derivation of static model, the dynamic model for pantograph-head profile can be obtained based on O1, A, C, O2r, O2l, B, and D in coordinate A(x′, y′). However, the detailed derivation will not be provided here due to space constraints.
In general, the profile of the pantograph head can be modeled as follows:

where: F presents the contact force; L presents the distance between F and the centerline of the pantograph; LS presents the distance between the pantograph springs and the centerline of the pantograph; k presents the stiffness of the pantograph springs; and ς presents the design characteristic parameters of the pantograph head.
For the pantograph head with a single contact strip:

For the pantograph head with double contact strips:

Notably, ς holds only for the pantograph-head profile composed of a circular curve and straight line. If the pantograph profile includes a circular gentle curve, ζ should be adjusted according to the specific situation.
Condition of transition-point disappearance
The transition point on the right side, tr(xtr, ytr), can be solved by the following equations:


Either equation (23) or equation (24) has a real solution for (xtr, ytr). The right transition point of the pantograph head disappears when xtr has no solution in [0, xB]. The analysis of the left transition point is similar and will not be repeated here.
Based on the above derivation and analysis, the following applications can be achieved:
(1) The possibility of transition-point disappearance under the allowable range of contact force for the existing pantograph can be estimated.
(2) The permissible range of contact force to prevent transition-point disappearance can be calculated.
(3) The design principles regarding the parameters of the pantograph to prevent transition point disappearance within the allowable range of contact force can be provided.
Verifications and discussions
Verification by finite element model
In this section, the accuracy of the proposed modeling method is evaluated by a finite element model in the finite element analysis software, ANSYS.
DSA250 is a typical double-strip pantograph, whose parameters are given in Appendix II. The finite element model of DSA250 is established in ANSYS. The types of contact for the finite element model are: spherical contact between the contact strips and pantograph springs; rotation contact about the Y-axis between the pantograph horn and the pantograph springs. To simplify the model, the connections between the pantograph upper arm, lower arm, low rod, adjusting rod, balancing, frame, insulator, and other parts unrelated to the analysis of pantograph-head deformation, are all set as fixed connections.
The model of DSA250 and its load positions are shown in Figure 9. Normal forces (i.e. A and B) of the same magnitude act on the contact strips. The ground fixation (i.e. C) is at the bottom of the insulator. The gravity load (i.e. D) for all components is along the −Z-axis.

The finite element model of DSA250 and its load positions.
The deformations of the pantograph are simulated under different force values ranging from 80 to 250 N. The force is located at the middle of the right contact strips. The pantograph profiles obtained from the simulation model and the analytical model are compared. Figure 10 shows the comparison results under the force of 160 N. By observing the pantograph center and the supporting points on both sides, it can be concluded that the calculation model is highly consistent with the simulation model.

Comparison of the profiles obtained from the simulation model and the analytical model under the force of 160 N.
More simulation results are given in Figure 11, and the relative errors between simulation and analytical model are given in Table 1. The deformation of the simulation model at the left and right support points (labeled as points A and B) and the center position (labeled as point C) are almost the same as that of the analytical model at the same position, with a maximum relative error of 2.43% and a mean relative error of 1.54%. Keeping the contact force position unchanged and increasing the contact force from 80 to 200 N with a step of 20 N, the results demonstrate that the deformation of the feature points is linearly related to the magnitude of the force. This linear relationship can also be supported by the mathematical model described in Section IV. In a word, the proposed mathematical model is in good agreement with the finite element simulation model, thus proving the effectiveness of the modeling method.

Comparison of the key displacement solved by simulation and analytical model.
The errors between simulation and analytical model.

Verification by actual measurements
To further evaluate the proposed mathematical model, the verification has been carried out based on actual measurements. The pantograph CX-GI, which parameters are listed in Appendix II, was utilized as the experimental object. A normal force, F, is applied to a certain position on the contact strip offset from the centerline. Subsequently, the deformations of the left and right support points and the center position (points A, B, and C) are measured. The relative error between the calculated and measured deformations is investigated.
Specifically, F is applied at 200 and 300 mm from the left side of the centerline. Some conventional force values of the contact force in engineering, such as 80, 100, and 120 N, are taken into consideration. Taking Figure 12 as an example, the profile of the pantograph head with and without F is respectively depicted by the dotted line and the actual image. A high-definition camera is used in the same position to capture images to ensure the measurement accuracy of the displacement of points A, B, and C.

The experiment of actual measurements.
The results of this experiment are presented in Figure 13. According to the 24 groups of data, the average relative errors between the analytical method and the actual measurement are 6.94% at the left support point, 8.5% at the right support point, and 6.64% at the center of the pantograph. The errors are greater than those between simulation and analytical method since experimental and measurement errors are inevitable. Nevertheless, the coincidence of the solid and dotted lines proves the validity of the analytical method.

Comparison of the key displacement solved by measurement and analytical method: (a) force offset centerline 200 mm and (b) force offset centerline 300 mm.
Analysis cases for preventing transition point disappearance
In this section, the contact force range where transition point disappearance can be prevented is analyzed in detail for CX-GI and DSA250.
The standard profiles of DSA250 and CX-GI are given in Figure 14 based on the parameters and the proposed modeling method.

Standard profiles of DSA250 and CX-GI.
The response of the profiles under different force values and positions is calculated as shown in Figure 15. It can be observed from the results that, the greater the force or the farther the force position offset from the centerline, the easier it is to deform the contact strip. Therefore, there is a range of the combination of the value and position of the contact force, such that, beyond that range, the transition point will not disappear.

Pantograph profiles with different values and positions of contact forces: (a) CX-G1 and changed force with fixed position, (b) CX-G1 and changed position with fixed force, (c) DSA250 and changed force with fixed position, and (d) DSA250 and changed position with fixed force.
To prevent transition-point disappearance, the critical state should be solved. According to Section 4.3, the transition-point is in the critical disappearing state when xtr = xB or xtl = xD. The relationship between the value and position of the contact force can be determined when the transition point is in the critical disappearing state, with different spring stiffness (k), as shown in Figure 16. When the contact force is below the curves in the figure, the transition-point disappearance will be prevented.

Relationship between the values and positions of the contact force when the transition point is at the disappearance point with different spring stiffness: (a) CX-G1 and (b) DSA250.
Specifically, either the force position (distance from the centerline of the pantograph) is smaller than the corresponding point on the curve for a chosen contact force value, or the contact force value is smaller than the corresponding point on the curve for a chosen force position, the transition-point disappearance will be prevented.
Therefore, for the two types of pantographs in this example, the allowable contact force range of the pantograph should be controlled below the curve corresponding to the pantograph spring stiffness. With an increase in the stiffness of the pantograph-head spring, the deformation of the contact strip decreases, and the disappearance of the transition point becomes more difficult. Consequently, a larger spring stiffness allows for a larger allowable range of contact force, ensuring the absence of the transition point.
According to the analysis in Section IV, the position of the transition point is closely related to the length of the strip horn. As shown in Figure 17, the longer the strip horn, the more difficult it is for the transition point to disappear. Therefore, appropriately increasing the length of the strip horn is an effective measure to prevent the disappearance of transition points.

Relationship between the value and position of the contact force when the transition point is at the disappearance point with different lengths of strip horn: (a) CX-G1 and (b) DSA250.
According to the analysis in Section 4.1, the larger the offset of force relative to the centerline of the pantograph, the more unevenly the pantograph springs are subjected to force. Consequently, the tilt of contact strips caused by the contact force becomes more severe. Therefore, to avoid the disappearance of the transition point, as the permissible range of contact wire movement on contact strips increases, the allowed limit of contact force should decrease accordingly. This relationship is effectively demonstrated in Figures 16 and 17.
Conclusion
In this paper, the modeling and analysis method of the transition-point disappearance phenomenon in high-speed railway pantograph-catenary system is proposed. Through the presented model, the profile and deformation process of the pantograph under different contact force values and positions can be solved. This helps with the prevention of transition-point disappearance in practice. The proposed analytical model is verified by both finite element simulation platform and experimental measurements. Finally, the analysis case for transition-point disappearance prevention is given taking CX-GI and DSA250 as examples.
Footnotes
Appendix I
The center of the contact strip curve, O1 (xo1, yo1),
The right tail end of the contact strip, A (xA, yA),
The left tail end of the contact strip, C (xC, yC),
The center of the curve of the right strip horn, O2r (xo2r, yo2r)
The center of the curve of the strip horn, O2l (xo2l, yo2l)
The right tail end of the strip horn, B (xB, yB),
The left tail end of the
Appendix II
Input pantograph parameter for CX-GI and DSA250.

| Symbol | Description | CX-GI | DSA250 |
|---|---|---|---|
| Distance between springs and the centerline of pantograph (mm) | 565 | 550.7 | |
| Elastic coefficient of springs (N/mm) | 3.2 | 15 | |
| Radius of contact strips (mm) | 10,000 | 9018.2 | |
| Radius of strip horns (mm) | 272 | 363.7 | |
| Radius of pantograph horn (mm) | 248 | 310 | |
| Half-length of contact strips (mm) | 525 | 515.6 | |
| Horizontal distance between the end of the strip horns and the centerline of pantograph (mm) | 735 | 795 | |
| Distance between the tangent point of the pantograph horn and the centerline of pantograph (mm) | 791 | 730 | |
| Horizontal distance between the end point of the pantograph horn (excluding the outermost curve) and the centerline of pantograph (mm) | 923 | 960.8 | |
| Vertical distance between end point and the top point of pantograph head (mm) | 260 | 305.5 | |
| Angle of horizontal line and line between tangent point and end point (°) | 40 | 40 | |
| Equivalent length of the spring of the pantograph head (mm) | / | 251 | |
| Angle of horizontal line and the spring of the pantograph head (mm) | / | 7.9 | |
| Weight of pantograph head and its components (N) | / | 74.4 |
The parameters in this table are unofficial and only used for the experiment.
Handling Editor: Chenhui Liang
Declaration of conflicting interests
The author(s) declared no potential conflicts of interest with respect to the research, authorship, and/or publication of this article.
Funding
The author(s) disclosed receipt of the following financial support for the research, authorship, and/or publication of this article: (N2022G029) Science and Technology Research and Development Plan of China State Railway Group – Study on Safety Service Performance Optimization of overhead contact line anchor Support Transition Zone in High speed railway. (N2021G029) Science and Technology Research and Development Plan of China State Railway Group – Research on Service Performance of OCS Elastic Sling of High Speed Railway (P2021G053) Science and Technology Research and Development Plan of China State Railway Group – Research on key technologies of infrastructure adaptability of 400km/h high-speed railway.