
Abstract
In this paper, aiming at the identification of blade vibration parameters such as constant speed synchronization, constant speed asynchronous, and variable speed synchronization, the simulation platform Simulink is used to model the blade vibration system, and the blade tip timing vibration measurement system model is constructed. A method of blade vibration parameter identification based on genetic algorithm is proposed, and numerical simulation and experimental verification are carried out. The results show that the parameter identification of blade vibration by genetic algorithm has high accuracy and strong anti-noise interference ability. The influence of key parameters on the identification of blade vibration parameters is studied. For the constant speed synchronous and constant speed asynchronous vibration of the blade, the angle between the sensors should not be an integral multiple of 2π as far as possible, and the larger DR (Distribution Range) value should be guaranteed. The higher the frequency doubling of blade vibration, the more sensors are needed. For the variable speed synchronous vibration of the blade, the frequency doubling is greater than the influence of the sensor layout on the parameter identification results, but the number of sensors is too small, which will seriously affect the identification accuracy of the frequency doubling. Aiming at the blade vibration test, a blade vibration tester is designed. The blade variable speed synchronous vibration test is carried out by using the strain gauge method and the tip timing method. The measurement results of the strain gauge method are basically consistent with the measurement results based on the genetic algorithm and the tip timing.
Introduction
Aero-engine blade is one of the key parts of aero-engine. Especially for small and medium-sized aero-engine blades, the structure size is small, the speed is high, the load on the blade is particularly complex, and the vibration problem is particularly prominent.1,2 Therefore, it is extremely important to monitor blade vibration. The vibration measurement technology of rotating blade based on tip timing principle 3 overcomes the shortcomings of traditional measurement technology and is widely used in blade vibration monitoring.4,5 Aiming at the blade vibration monitoring based on the principle of timing signal, researchers have done a lot of work, which is mainly divided into three directions: curve fitting, spectrum analysis, and other data processing methods.
In terms of curve fitting, Zablotskiy and Korostelev 6 proposed a single-parameter method to obtain the amplitude and resonance speed frequency of synchronous vibration response, but this method cannot provide engine order information. Heath 7 developed a two-parameter mapping method, which can obtain the amplitude, frequency, phase, and other information of blade resonance using only two sensors. However, this method is very susceptible to noise interference and is not reliable in practice. Joung et al. 8 proposed a circumferential Fourier fitting method. Ouyang 9 proposed a multi-sensor vibration parameter identification method based on arbitrary angular distribution. Li et al. 10 used the high-order B-spline function to reconstruct the undersampled time-domain signal of tip-timing, which can well reflect the parameter characteristics such as blade vibration peak. Chen et al. 11 proposed a non-aliasing reconstruction algorithm based on Shannon’s theorem and wavelet packet transform for down-sampling tip time series signals. Diamond et al. 12 transformed the blade tip signal into an angular domain, and then processed the instantaneous phase in the signal to obtain the tip deflection of the signal. This method has higher calculation accuracy. Wu et al. 13 proposed a method, where cross-correlation and Savitzky Golay filter are used to locate the resonance region. Then an adaptively reweighted least-squares periodogram algorithm is designed to identify parameters of the resonant vibration. Wang et al. 14 proposed an alternative feature extraction method called autocorrelation method for asynchronous vibration analysis to identify the vibration amplitude and frequency of the under sampled BTT (Blade Tip Timing) signal simultaneously. Fan et al. 15 investigated, the relationship between blade vibration and blade vibration difference, and it can be concluded that blade vibration difference can estimate blade vibration. There are also various autoregressive analysis methods.16,17
In the aspect of spectrum analysis, it is necessary to solve the problem of multi-modal reconstruction of blade asynchronous vibration signals under undersampling conditions. Fast Fourier transform method, 18 but its accuracy is strongly affected by low sampling rate, aliasing, and measurement noise. Zhang et al. 19 proposed a “5+2” scheme with double sampling rates to solve the undersampling problem, and extracted asynchronous blade vibration through frequency identification. Chen et al. 20 proposed to use compressed sensing algorithm to reconstruct the BTT signal, and Mousavi and Baraniuk 21 improved the accuracy of compressed sensing algorithm through deep learning. Hoskoti 22 used multiple signal classification algorithm to solve the problem of BTT undersampling multi-frequency blade vibration blind reconstruction. Wang and Lei 23 established an asynchronous vibration parameter identification algorithm for blades by using all-phase FFT and least square method, and gave the test parameters and empirical values of the rationality of sensor arrangement. Zhang and Ding 24 proposed a non-uniform undersampling tip-timing signal analysis method based on EDFT, which expands the analysis frequency range and improves the frequency resolution. Wu et al. 25 proposed an adaptive online BHM (Blade Health Monitoring) method that includes two steps: automatic resonance region recognition and parameters identification in resonance area. Dong et al. 26 addressed the problem of the reconstruction of time frequency characteristics of sparse multi-band signals by using the discrete multi-coset sampling model. Then, an analysis method of the multi-coset sliding window is proposed. He et al. 27 studied the rotational invariance technique with total least squares principle to estimate the original frequency information from the under-sampled signal with strong noise interference. The estimated frequency information will be further used as priori knowledge for the tip-timing signal reconstruction with interpolation function. Both simulation and experiment signal are used to verify the effectiveness of the proposed method. Dong et al. 28 described the characteristics of BTT signals under blade synchronous resonance, and the deficiency of this feature in the recovery process using the orthogonal matching pursuit algorithm is found. Based on the problem, the subspace pursuit algorithm adapted to this feature is proposed. The validity of the algorithm is verified by the blade rotation experiment.
In terms of other BTT data analysis, Fan et al. 15 used double BTT sensors to analyze and process the blade vibration displacement difference to complete the identification of blade synchronous vibration amplitude and engine order. Chen et al. 29 proposed a reconstruction method based on nonlinear time transformation (NTT) for the influence of speed fluctuation on vibration reconstruction, which can effectively reduce the influence of speed fluctuation. Zhang et al. 30 proposed a multi-phase reference method to solve the problem of speed fluctuation. In the aspect of speed sensorless BTT algorithm, Zhang et al. 31 proposed a new two-parameter method without OPR sensor to identify the synchronous vibration parameters of variable speed blades. Xu et al. 32 developed a non-convex optimization model based on GMC penalty for reconstructing the undersampled BTT signal to obtain the accurate blade-tip displacement and blade natural frequency.
In this paper, the genetic algorithm is used to fit the blade vibration data, and the blade vibration parameters are identified by the multi-sensor vibration parameter identification method. 9 The blade vibration model and tip timing test simulation system are constructed by the graphical simulation platform Simulink. Numerical simulation and experimental verification of parameter identification of typical vibration states such as constant speed synchronous vibration, variable speed synchronous vibration, and constant speed asynchronous vibration are carried out by genetic algorithm. The influence of sensor layout, number of sensors, engine order, and noise on the identification results of blade vibration parameters is studied. The influence of aerodynamic force will be considered in the subsequent research on blade vibration and parameter identification.
Simulation of blade vibration and blade timing vibration measurement
Theoretical model of blade vibration
The vibration of the real blade is very complex, but the most likely vibration mode of the blade is the bending mode, and the tip surface of the blade shows a large vibration displacement. Therefore, the tip timing sensor is usually installed on the casing to capture the vibration displacement of the blade rotation direction. In order to simplify the blade vibration model, a single blade can be regarded as a single degree of freedom system. The vibration differential equation of a single blade is simplified as:

Model of tip-timing vibration measurement system
Based on the above analysis, the blade vibration system is modeled based on the Simulink platform. The blade vibration model is as follows:
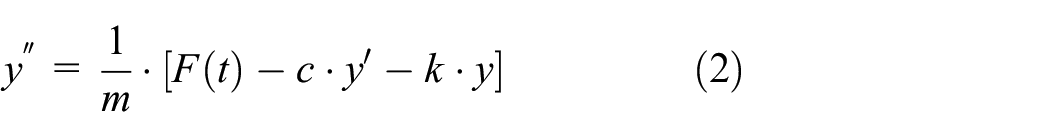
The Simulink model of blade vibration created according to equation (2) is shown in Figure 1. Different external excitation F(t) is simulated by different functions, the output is the displacement response y(t) of the blade vibration.

Simulink model of single blade.
According to the principle of blade tip timing, only one vibration response value of each blade is sampled by a single sensor per circle. Multiple sensors are installed on the casing in turn according to the speed direction, and the sensors are numbered 0to n−1 in turn according to the blade rotation direction. The installation angles of all sensors relative to the No.0 sensor are α0, α1, α2,···αn−1 (α0 = 0) respectively.
The Hit-Crossing function module and the switch module in the Simulink platform are used to simulate the tip timing signal acquisition, as shown in Figure 2. Assuming that the time when the blade passes through the No.0 sensor TIP0 is t = 0, and the rotor rotation fundamental frequency Ω = 2πfv (fv is the rotor rotation frequency), when the blade reaches the sensor TIPi, there is: αi = 2πfv·t. According to the rotation periodicity, the sine function can be used as a condition to determine the moment when the blade reaches the sensor: when sin(2πfv·t) = sin(α i ), and the direction of Hit-Crossing is set according to the quadrant where αi is located (αi belongs to the first and third quadrants, the direction is upward; when α i belongs to the second and fourth quadrants, the direction is downward). When the above conditions are satisfied, the sensor collects the vibration response value, YTIP = y in Figure 2. When the above conditions are not satisfied, the sensor output value YTIP can be equal to a larger constant for subsequent elimination.

Sampling model of tip timing.
Simulation of blade vibration and sampling
When the vibration frequency is an integer multiple of the speed frequency, the blade vibration is synchronous vibration, otherwise it is asynchronous vibration. Synchronous vibration can be divided into constant speed synchronous vibration and variable speed synchronous vibration according to whether the speed changes.
Simulation of constant speed synchronous vibration
When the rotating speed is constant, it is considered that the frequency of the exciting force on the blade remains unchanged. Considering the excitation force of a single frequency, the excitation force on the blade is 22 :

where, FA is the amplitude of the excitation force, φ is the initial phase, fv is the speed frequency, and Ne is the excitation engine order.
The Simulink blade vibration simulation model is used to model the blade vibration system, and the mass, damping, and stiffness parameters are set to obtain the vibration response of the blade constant speed synchronous resonance. As shown in Figure 3, after 0.1 s, the blade vibration tends to be stable.

Simulation of blade constant speed synchronous vibration response.
Six sensors are distributed on the casing, and the layout is shown in Figure 4. The blade vibrates synchronously at a constant speed. Since the vibration frequency of the blade is an integer multiple of the rotational speed, different tip timing sensors sample different constant displacement values. The response collected by each sensor is shown in Figure 5.
Sensor layout.

Sampling simulation of blade constant speed synchronous vibration response (full sensor).
Simulation of variable speed synchronous vibration
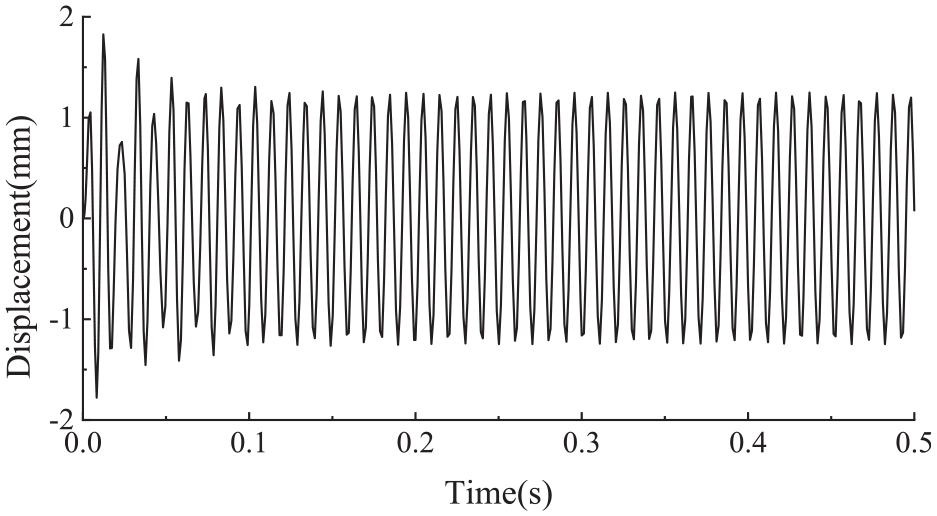
When the speed changes, the frequency of the excitation force changes accordingly. When the frequency of the excitation force is equal to the natural frequency of the blade, the blade resonates. The Simulink blade vibration simulation model is used to model the blade vibration system, and the mass, damping, and stiffness parameters are set to obtain the blade variable speed synchronous vibration response, as shown in Figure 6. When the blade passes through the sensor, the blade vibration displacement response collected by a single sensor is shown in Figure 7:

Simulation of variable speed synchronous vibration response of blade.
Sampling simulation of blade variable speed synchronous vibration response (single sensor).
Simulation of constant speed asynchronous vibration
When the blade vibration frequency is not an integer multiple of the rotational frequency, the relationship between the blade vibration frequency and the rotational frequency is:

Where m is a positive integer, Δm is a decimal of 0–1, ω is the blade vibration frequency, Δω is the vibration difference frequency, and Ω is the speed fundamental frequency.
The blade vibration system is modeled by Simulink blade vibration simulation model, and the mass, damping, and stiffness parameters are set to obtain the constant speed asynchronous resonance response of the blade, as shown in Figure 8. The blade vibration response measured by a single sensor is shown in Figure 9. It can be seen that when the blade vibrates synchronously, only a stable constant deviation value is measured by a single sensor. When the blade vibrates asynchronously, a single sensor measures a fluctuation signal equivalent to the actual peak.
Simulation of blade constant speed asynchronous vibration response.

Sampling simulation of blade constant speed asynchronous vibration response (single sensor).
Parameter identification algorithm of blade vibration
Genetic algorithm
Genetic algorithm is a theory and method proposed by Professor Holland and his team. 33 Genetic algorithm is a model that imitates the natural selection and evolution mechanism of “survival of the fittest” in nature to construct artificial systems. 34 Genetic algorithm is a general method to solve search and optimization with limited cost, which is different from traditional search and optimization methods. In this paper, the genetic algorithm is used to fit the blade vibration displacement curve to obtain the key information of blade vibration. The genetic algorithm flow chart is shown in Figure 10.

Genetic algorithm process.

Simulation data of blade constant speed synchronous vibration.
Hyperparameters of genetic algorithm
Genetic encoding scheme
The genetic algorithm is used to identify the blade vibration parameters. The parameter types are mainly real and integer. In this paper, the real and integer mixed coding method is used to encode the parameters. The integer coding is used for the vibration frequency doubling of the synchronous vibration of the blade, and the other parameters, such as the resonance frequency, amplitude, and offset, are encoded in real numbers.
Fitness function
Blade constant speed synchronous vibration
The parameter vector

Where A is the amplitude, Ne is the engine order, φ is the initial phase, and C is the initial displacement.
From the simulation of 1.3.1 simulation of constant speed synchronous vibration, it can be seen that the displacement of a blade through each sensor in each circle is the same. Therefore, n sensors can get n values.
The objective function of blade resonance parameter identification is constructed as follows:

Blade variable speed synchronous vibration
The parameter vector

Where A0 is the static amplitude; Ω n is the resonant speed frequency; Q is the amplification factor of the resonance region; ϕs is the initial phase; C is the initial displacement.
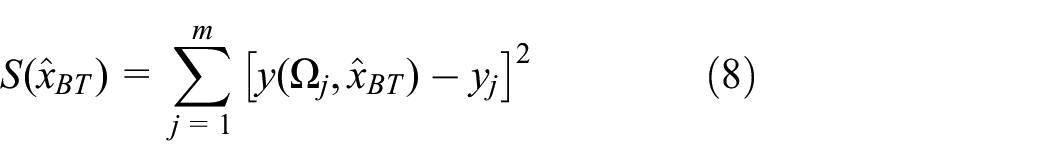
Assuming that the rotation speed of the jth circle is Ω j , when a blade passes through a sensor, the vibration displacement measured by the sensor is yj, that is, the data (Ω j , yj) are obtained, j = 1, 2, 3,…, m, and m is the number of circles.
The objective function is constructed as
Blade constant speed asynchronous vibration
The parameter vector

Where A is the amplitude, m is the multiple of the speed frequency, is a positive integer; Δm is the difference frequency multiple, which is the decimal of 0–1; φ is the initial phase; C is the initial displacement.
Suppose the number of turns of blade rotation is N, the vibration displacement of blade measured by the jth sensor in the kth turn is

According to the above introduction, different types of blade vibration correspond to different objective functions, as shown in equations (6), (8), and (10) respectively. In this paper, the reciprocal of the objective function is used as the fitness function. The greater the fitness function value of the individual, the higher the probability of being selected. In this paper, the reciprocal of the objective function is used as the fitness function. The greater the fitness function value of the individual, the higher the probability of being selected. The output of the genetic algorithm is the blade vibration parameters, and the input is the range of the blade vibration parameters.
Genetic operators
For the selection strategy, the linear ranking selection strategy is used to select the individual. All the solutions are ranked according to the fitness function value, and then a probability of being selected is formulated according to the ranking of the solutions. The higher the ranking, the greater the probability.
For the crossover strategy, the crossover rate is set to 0.75, by selecting a gene locus, and then the selected two chromosomes are exchanged for genes after this position.
For the mutation strategy, the mutation rate is set to 0.05. In this paper, uniform mutation is used to specify each locus in the individual coding string as the mutation point. For each mutation point, a random number is taken from the range of the corresponding gene to replace the original gene value with the mutation rate.
Population size
Population size specifies the number of individuals in each generation. Appropriate population size can balance the ability to explore and utilize the search space. Too small population may lead to local convergence, while too large population will increase the computational cost. The population value in this paper is set to 1000.
Parameter identification of blade vibration and noise influence
Parameter identification of constant speed synchronous vibration
According to Table 1, the constant speed synchronous vibration parameters of the blade are set. According to the sensor layout in Figure 4 and the tip timing vibration measurement model, the time of the blade passing through the first sensor is set to t = 0, and the vibration of a blade collected by all sensors can be obtained. As shown in Figure 17, the black curve represents the blade vibration simulation data, and the red dots represent the blade vibration data collected by the sensor.
Parameters of blade constant speed synchronous vibration simulation.

According to Section “Introduction,” the single degree of freedom blade constant speed synchronous vibration equation is:

Where A is amplitude, Ne is engine order,
Through the data collected by the simulation sensor, the parameters of the blade vibration curve are identified based on the genetic algorithm. The evolution curve of the objective function value is shown in Figure 12. After the parameters have evolved to 40 generations, they have stabilized. The parameter identification results are shown in Table 2.

Evolution curve of objective function value of constant speed synchronous vibration simulation.
Parameter identification results of blade constant speed synchronous vibration.

The above simulation and parameter identification process are established in an ideal state, and the influence of noise on the data needs to be considered in the real test. Therefore, it is necessary to study the influence of different degrees of noise on the identification results of blade vibration parameters. In this paper, the noise added in the simulation is Gaussian white noise, and the mathematical expression is

Simulation data of blade constant speed synchronous vibration with SNR of 1.
Parameter identification results of blade constant speed synchronous vibration with SNR of 1.

Parameter identification of variable speed synchronous vibration
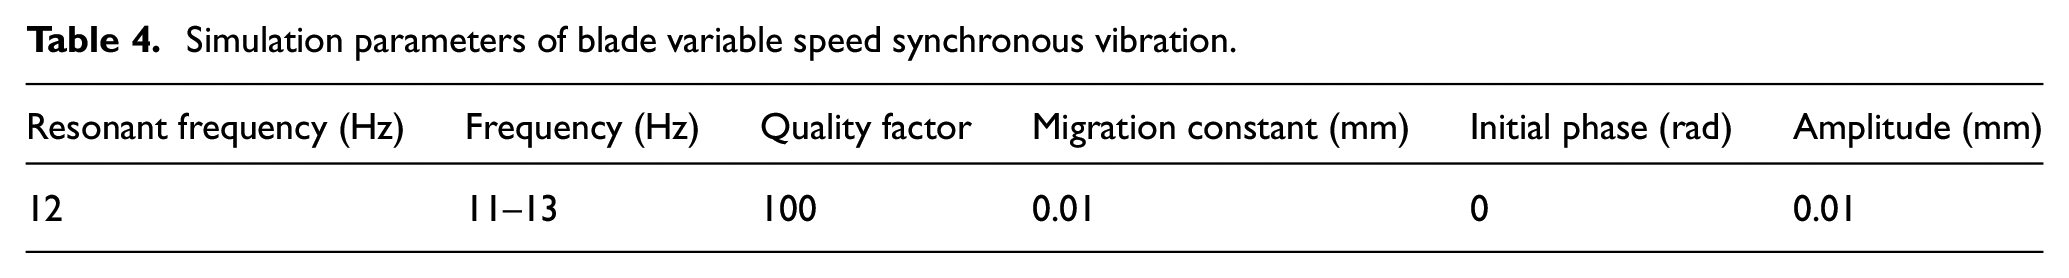
According to Table 4, the simulation parameters of blade variable speed synchronous vibration are set. At the same time, according to the sensor layout of Figure 4, the vibration displacement response curve of the blade measured by the sensor can be obtained from the tip timing vibration measurement model, as shown in Figure 14.
Simulation parameters of blade variable speed synchronous vibration.

Simulation data of blade variable speed synchronous vibration (full sensor).
According to the Ouyang, 9 the blade variable speed synchronous vibration response equation is:

Where
Where, A0 is the response amplitude, Ne is the vibration frequency multiplication, φ0 is the initial phase, C is the offset constant, ωn is the natural frequency of the blade vibration, αi is the sensor installation angle, and Ω is the fundamental frequency of the rotational speed.
Based on the genetic algorithm, the parameters of the blade vibration curve are identified. The evolution curve of the objective function value is shown in Figure 15. The parameters have stabilized after 40 generations. The identification results are shown in Table 5.

Evolution curve of objective function value of variable speed synchronous vibration simulation.
Parameter identification results of blade variable speed synchronous vibration.

The noise with signal-to-noise ratio of 1 is added to the simulation signal of variable speed synchronous vibration of the blade. The vibration displacement response of the blade collected by the sensor is shown in Figure 16. The parameters of blade vibration curve are identified based on genetic algorithm, and the results are shown in Table 6.

Simulation data of blade variable speed synchronous resonance with SNR 1 noise (full sensor).
Parameter identification results of blade variable speed synchronous vibration with SNR 1 noise.

Parameter identification of constant speed asynchronous vibration
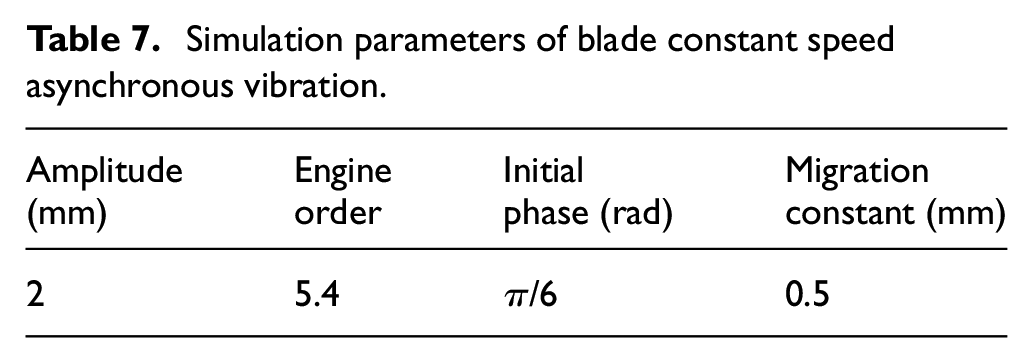
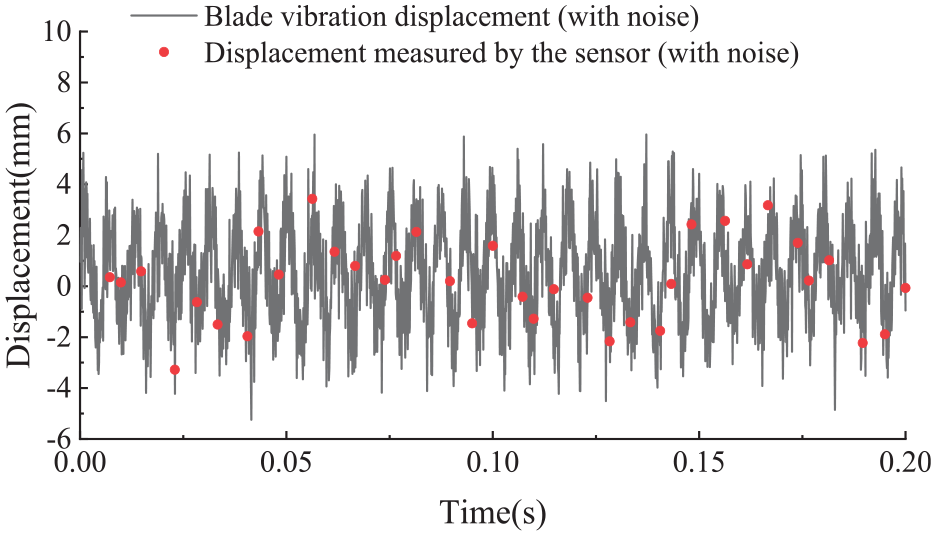
According to Table 7, the constant speed asynchronous vibration parameters of the blade are set. According to the sensor layout shown in Figure 4, the vibration displacement response of a blade passing through all sensors can be obtained by setting the time of the blade passing through the first sensor as t = 0 by the tip timing vibration measurement model. As shown in Figure 17, the black curve represents the blade vibration simulation response, and the red punctuation indicates the blade vibration response collected by the sensor.
Simulation parameters of blade constant speed asynchronous vibration.
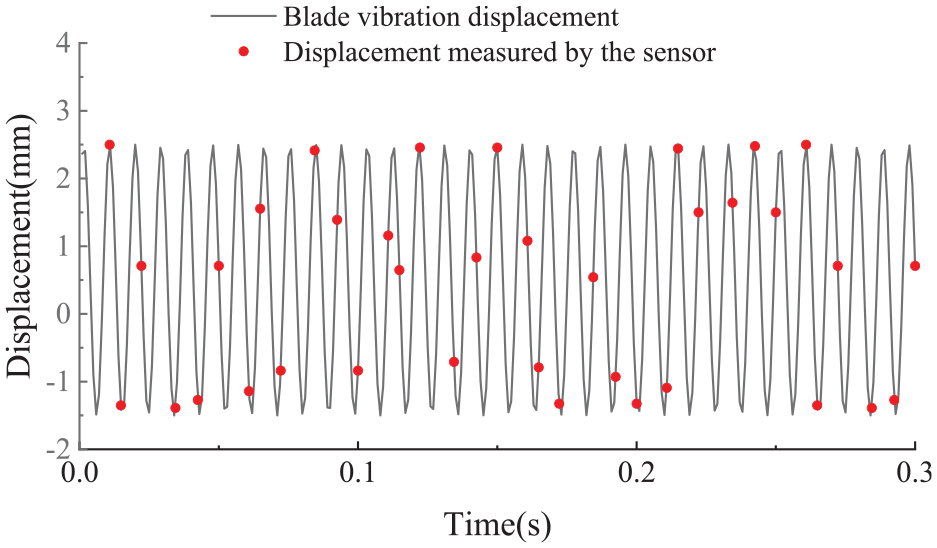
Simulation data of blade constant speed asynchronous vibration.
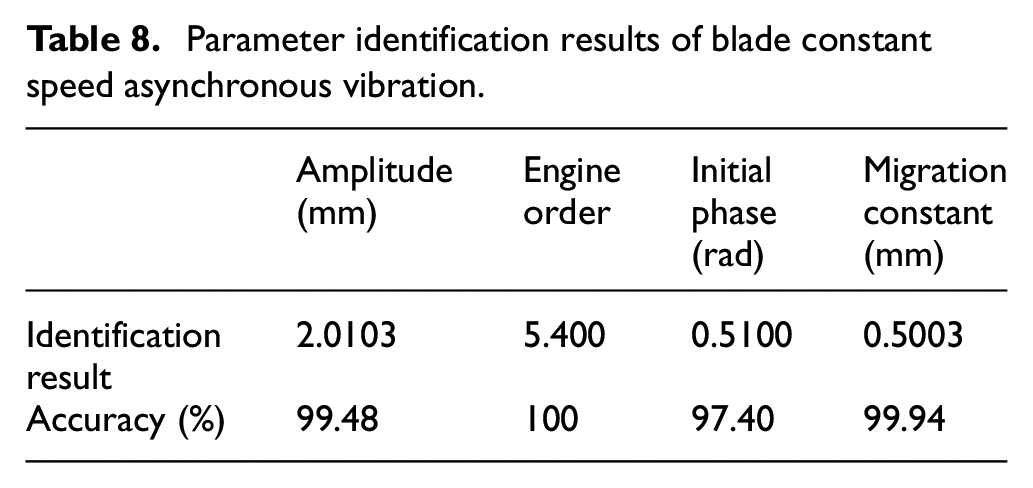
Constant speed asynchronous vibration is similar to constant speed synchronous vibration, but its engine order is no longer integer. By simulating the data collected by the sensor, combined with the multi-sensor vibration parameter identification method of arbitrary angle distribution. 9 The evolution curve of the objective function value is shown in Figure 18, and the parameters have stabilized after 30 generations. The parameter identification results are shown in Table 8.

Evolution curve of objective function of constant speed asynchronous vibration simulation.
Parameter identification results of blade constant speed asynchronous vibration.
When the noise with signal-to-noise ratio of 1 is added to the blade constant speed asynchronous vibration simulation signal, the blade vibration response and sensor acquisition signal are shown in Figure 19. The parameters of blade vibration are identified by genetic algorithm, and the results are shown in Table 9.
Simulation data of blade constant speed asynchronous vibration with SNR of 1 noise.
Parameter identification results of blade constant speed asynchronous vibration with SNR of 1 noise.

The influence law of key parameters
In section “Parameter identification algorithm of blade vibration,” the parameter identification of blade constant speed synchronous vibration, variable speed synchronous vibration, and constant speed asynchronous vibration based on genetic algorithm is discussed in detail. The influence of key parameters such as the number and layout of sensors and the engine order of blade vibration on the vibration identification results is discussed below.
Blade constant speed synchronous vibration
Corresponding to the constant speed synchronous vibration of the blade, different tip timing sensors sample different constant response values. Therefore, in theory, the more the number of sensors, the more accurate the parameter identification results. The sensor angle arrangement is also an important factor affecting its identification accuracy. 35 In addition, the blade vibration engine order will also affect the parameter identification results. 36
Sensor layout
Suppose that P sensors are arranged around the casing, and the angle between each sensor and the key phase sensor is α i . According to equation (11), the vibration displacement response of the blade measured by the ith sensor can be obtained:

In order to avoid the same blade vibration displacement response collected by different sensors, so as to obtain more blade vibration information, the layout of the sensor needs to meet the following conditions:

As shown in Figure 20, the blue part represents Ne·|αi-αj|, and the red part represents N·2π. Therefore, the sensor layout needs to be based on engineering experience and actual conditions to avoid being in the intersection of red and blue and its vicinity. The layout of the sensor should not be evenly distributed, and the angle between the sensors should not be an integer multiple of 2π.

Sensor layout requirements for constant speed synchronous vibration of blade.
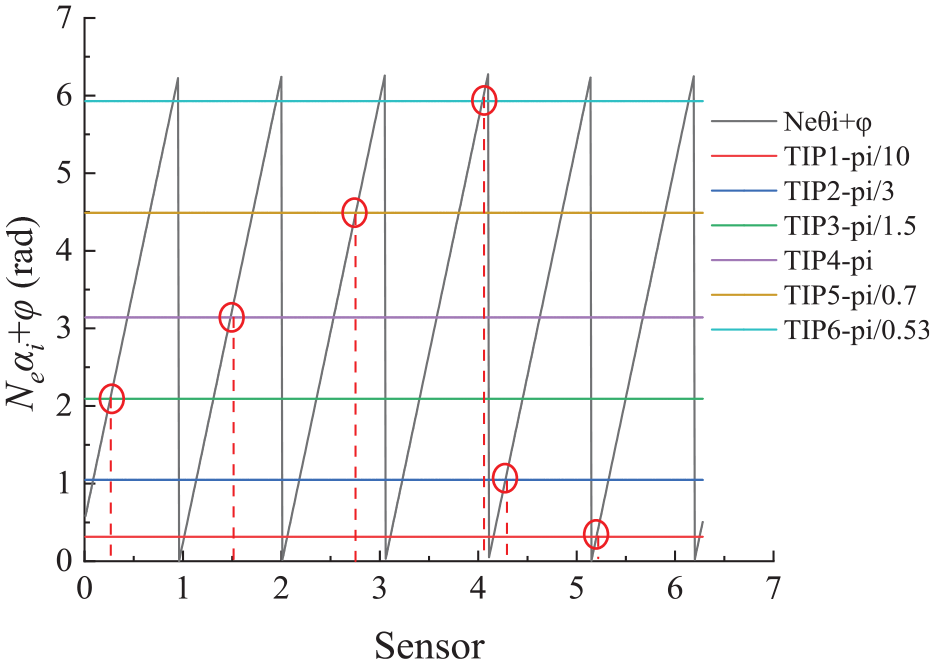
Parameter identification based on genetic algorithm requires sensors to collect as many blade vibration response values as possible. After (Neαi + φ) is normalized to [0, 2π], it needs to be evenly distributed between [0, 2π] as much as possible, and the installation position of the sensor needs to be considered so that the installation will not be too crowded. In order to more clearly represent the layout of the sensor, the sampling point distribution range function DR (Distribution Range) is introduced:

where γ is the angle after the sampling angle (Neαi + φ) is normalized to [0, 2π].
In theory, when other conditions are the same, the larger the DR, the more accurate the parameter identification results. For example, the installation angle of six sensors is [π/9 π/3 5π/9 5π/6 4π/3 5π/3], the blade vibration engine order is 5, the initial phase is 0 (Neαi + φ) is normalized to [0, 2π] to obtain [5π/9 5π/3 7π/9 π/6 2π/3 π/3]. As shown in Figure 21, DR = 55.56%.

Sampling point distribution map.
Six sensors are used to simulate and collect the blade vibration data with engine order of 6 and initial phase of π/6. As shown in Figure 22, six different blade vibration displacement responses can be collected in a circle of six sensors. The installation angle of the sensor also corresponds to 6, according to the actual situation of the sensor installation angle selection, the sensor sampling point distribution range should be as large as possible. At this time, the sampling point layout is [π/12 7π/15 157π/180 231π/180 49π/36 5π/3], and DR = 78.6%, which is obviously superior to the above layout.
Selection of sensor installation angle.
Number of sensors
The number of sensors has a great influence on the parameter identification results. The same blade constant speed synchronous vibration parameters as in Section “Simulation of constant speed synchronous vibration” are selected for simulation. As shown in Table 10, only the number of sensors is changed. The parameter identification results are shown in Figure 23. It can be seen from Figure 23 that when the number of sensors is less than 4, the accuracy of parameter identification will be greatly reduced.
Simulation of blade constant speed synchronous vibration parameter identification under different number of sensors.


The influence of the number of sensors on the identification results of blade synchronous vibration parameters.
Engine order
The engine order of blade vibration has a great influence on the accuracy of parameter identification results. Different frequency multiplications are simulated under the same sensor layout in Figure 4, and the parameter identification results are shown in Figure 24. It can be seen that with the increase of blade vibration engine order, the requirement for the number of sensors increases.

Influence of engine order on parameter identification of blade constant speed synchronous vibration.
Blade constant speed asynchronous vibration
In this paper, genetic algorithm is used to identify the parameters of blade vibration. The constant speed asynchronous vibration of blade is different from the constant speed synchronous vibration of blade only in the engine order value. The latter is a positive integer and the former has a decimal number. The parameter identification based on genetic algorithm is not much different in essence, so this paper will not repeat it here.
Blade variable speed synchronous vibration
According to Ouyang, 9 only one sensor is needed to identify the parameters such as resonance center speed frequency, quality factor, constant deviation, initial phase, and amplitude. The vibration engine order is obtained by the traversal algorithm through the different phases of the sampling points of multiple sensors. Therefore, the number and layout of sensors will only affect the engine order identification results of the variable-speed synchronous vibration of the blade.
Sensor layout
For the convenience of research, the simulation parameters of blade variable speed synchronous vibration in Section “Simulation of variable speed synchronous vibration” are used. The initial phase is set to zero, and only the sensor layout is changed, and the remaining parameters are unchanged. The sensor layout is shown in Table 11, and the parameter identification results are shown in Figure 25. It can be seen from Figure 25 that the engine order identification results under different sensor layouts are all 10, which is consistent with the preset engine order value.
Different layouts of sensors.

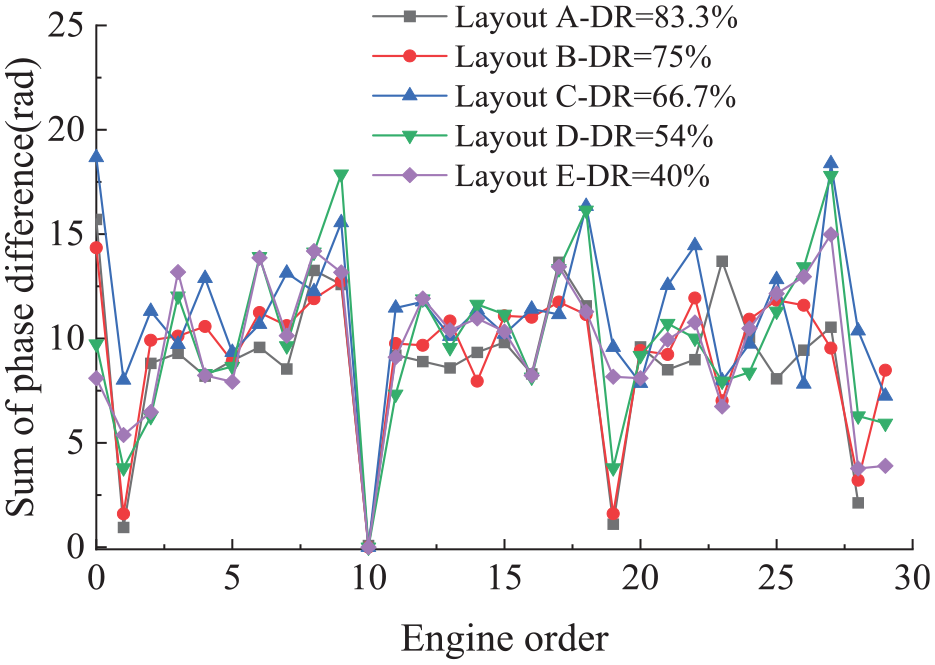
The influence of sensor layout on engine order identification results.
Number of sensors
Using the parameters of the blade variable speed synchronous vibration simulation in Section “Simulation of constant speed asynchronous vibration,” only the number of sensors is changed, and the remaining parameters are unchanged, the parameter identification of the blade vibration engine order is carried out, and the results are shown in Figure 26. It can be seen from Figure 26 that when the number of sensors is higher than 4, the value of engine order can be accurately obtained, that is, the number of sensors will not have a great impact on the engine order identification results, but the number of sensors cannot be too small.

The influence of the number of sensors on the engine order identification results.
Engine order
In the case of other parameters unchanged, the blade vibration engine order is changed, and the engine order identification results are shown in Figure 27. It can be seen that under the same sensor layout (the same number and the same installation angle), different engine orders hardly affect the engine order identification results.

The influence of different engine order on the identification results.
Experimental verification
Tester introduction
The rotor blade vibration tester is shown in Figure 28, which can simulate the blade vibration of real aero-engine. The rotor tester has a local casing with six circumferentially evenly distributed pores, and the high-pressure gas emitted by the pores is used as the excitation source of blade vibration, as shown in Figure 29.

Tester physical diagram.
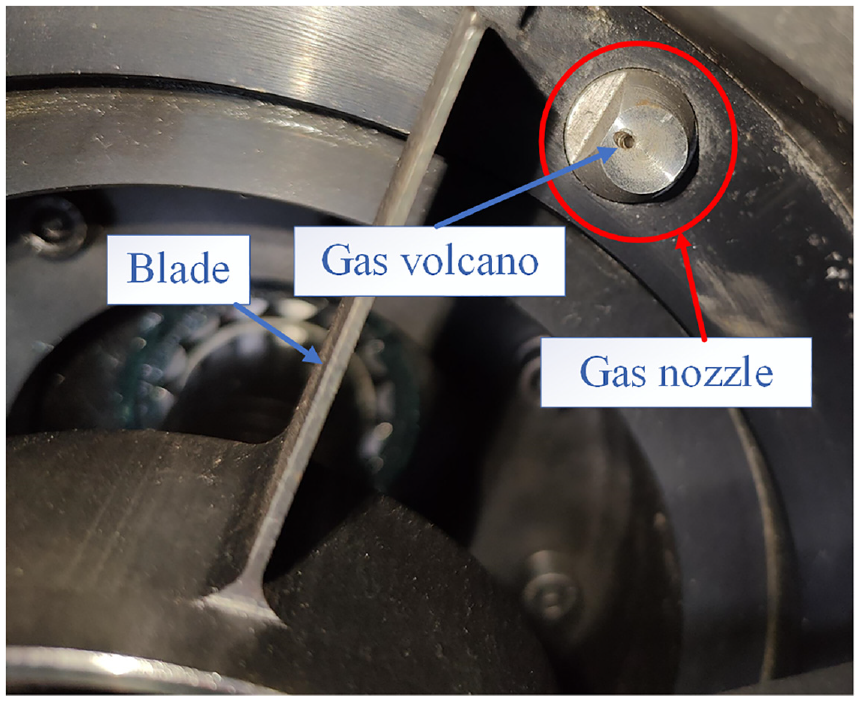
Gas excitation device.
Test scheme
In this paper, two methods are used to test the blade vibration. One is the blade vibration test based on tip timing, and the other is the strain gauge test. The strain gauge test results are used to compare and verify the tip timing test results. The blade vibration test system is shown in Figure 30, which is mainly composed of two parts: the tester and the signal acquisition and analysis system.

Blade vibration test system.
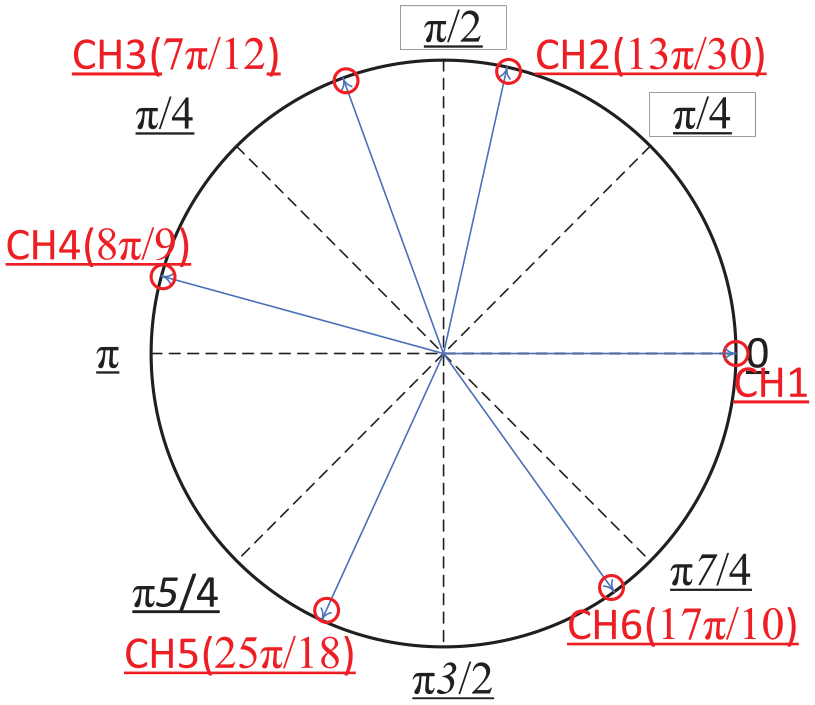
The BTT measurement method measures the arrival time of the blade tip through the optical fiber sensor installed on the casing, generates the voltage signal through the preamplifier, and then enters the computer through the data collector. A total of 6 fiber optic sensors were used in the BTT blade vibration test, which were installed in the circumferential direction of the casing at 0, 13π/30, 7π/12, 8π/9, 25π/18, 17π/10, as shown in Figure 31.

Installation diagram of optical fiber sensor.
The strain gauge measurement equipment includes strain gauge, slip ring lead, strain amplifier, and data collector. As shown in Figure 32, the strain gauge is pasted on the blade, and the voltage change is generated due to the strain generated by the blade vibration strain gauge. The vibration signal is transmitted to the data collector through the strain amplifier. Finally, the signal is processed by the signal processing software to obtain the blade vibration parameters.

Strain gauge installation.
Experiment
Test based on BTT method
Based on the BTT method, the blade variable speed synchronous vibration test is carried out. The tip timing signal is collected during the rotor speed rising from 2200 to 3400 r/min, and the blade vibration displacement response is calculated. Using the parameter identification method of blade variable speed synchronous vibration described in section “Parameter identification of variable speed synchronous vibration,” the parameter identification of blade vibration displacement is carried out. The curve fitting result is shown in Figure 33 and the parameter identification result is shown in Table 12.
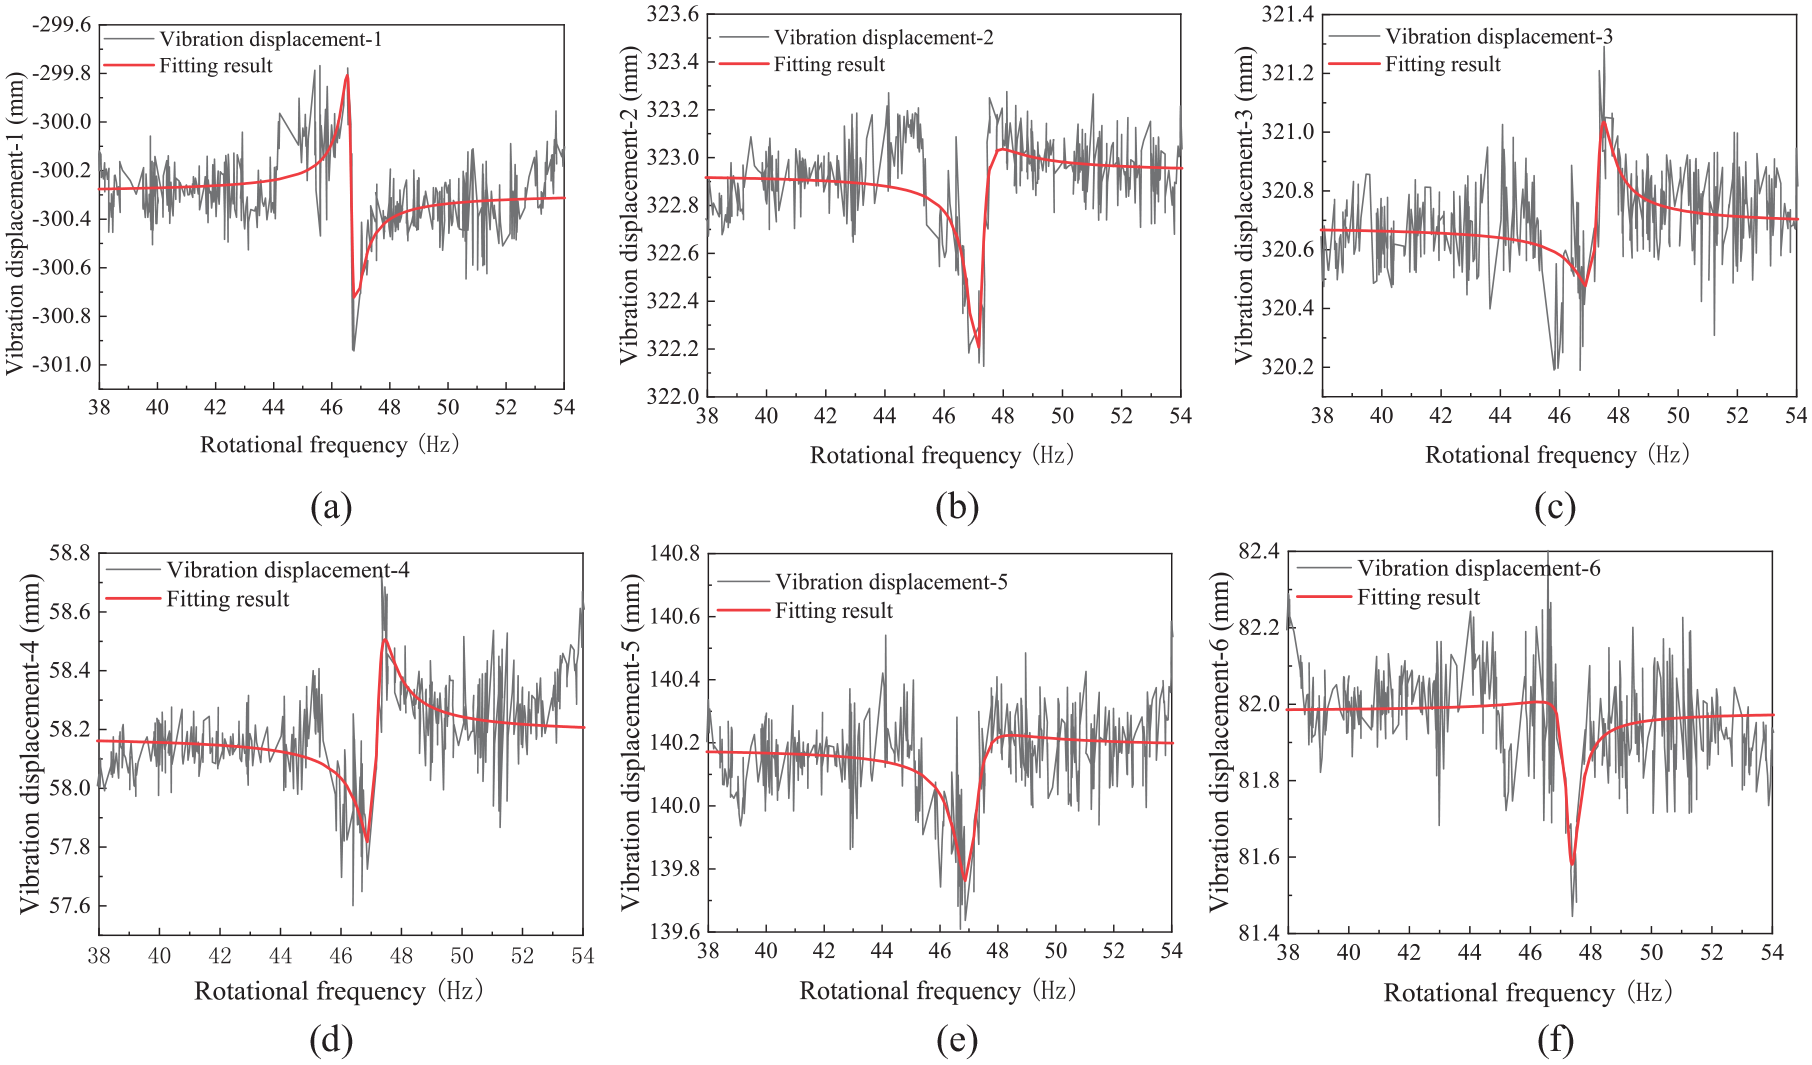
Fitting results of blade vibration displacement response measured by BTT method: (a) fitting results of vibration displacement-1, (b) fitting results of vibration displacement-2, (c) fitting results of vibration displacement-3, (d) fitting results of vibration displacement-4, (e) fitting results of vibration displacement-5, and (f) fitting results of vibration displacement-6.
Parameter identification results of blade vibration displacement response measured by BTT.

As shown in Figure 34, it is known that the blade vibration engine order identification result is six times the frequency. The average value of the resonance speed frequency of the six sets of parameter identification results is selected as the blade resonance speed frequency, and the natural frequency of the blade is 283.2 Hz.

Identification results of blade vibration engine order measured by BTT method.
Test based on strain gauge method
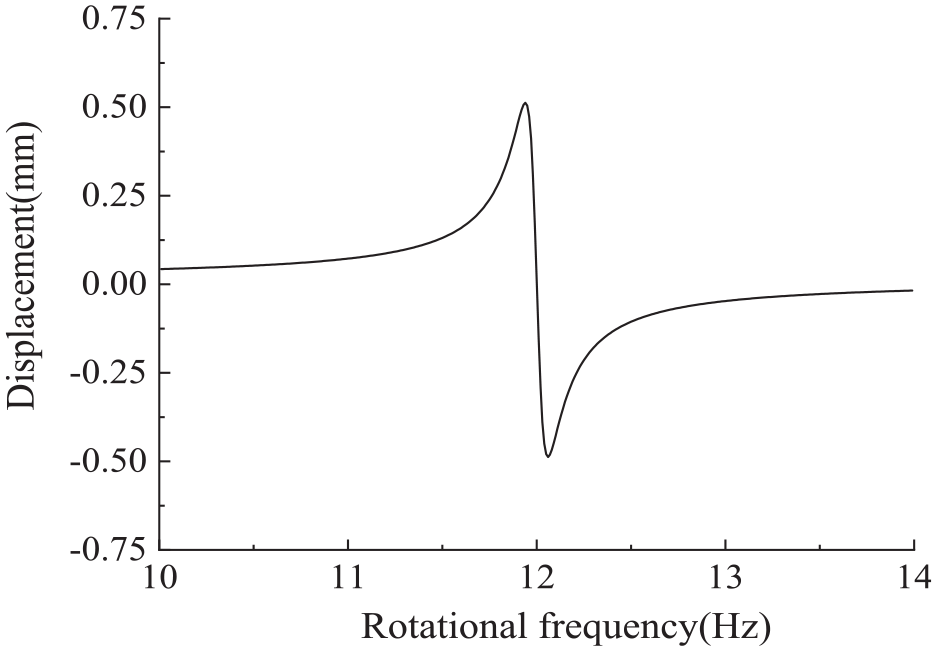
The results of blade vibration measured by strain gauge are shown in Figure 35, and the natural frequency of blade vibration is 283 Hz. The blade resonates at a speed of 2800 r/min, and there is a very obvious six-fold frequency, which corresponds to six excitation pores. The Bode diagram of the blade vibration measured by the strain gauge method is shown in Figure 36. From the diagram, it can be more clearly seen that the blade resonance speed is about 2823 r/min, which is converted into a frequency of 47.05 Hz, which is almost consistent with the BTT vibration measurement results. It shows the accuracy and practicability of the genetic algorithm and BTT vibration measurement system.
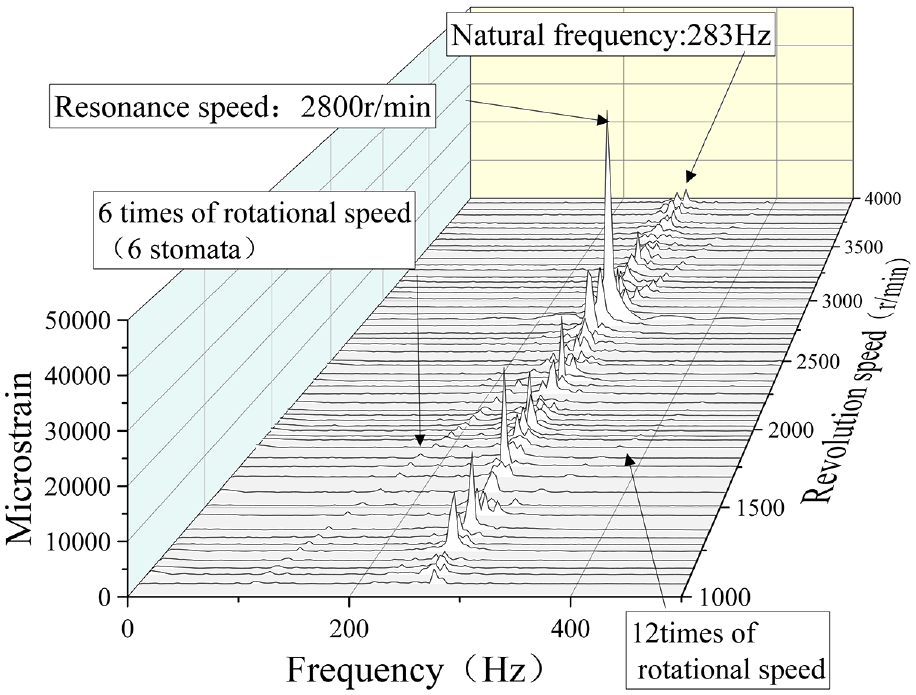
Results of blade vibration measurement by strain gauge method.

Bode diagram of blade vibration measurement by strain gauge method.
Conclusion
In this paper, based on genetic algorithm and tip timing, the parameter identification of typical vibration states such as constant speed synchronous vibration, variable speed synchronous vibration, and constant speed asynchronous vibration is carried out, and the accuracy of the results is very high. In the absence of noise, the accuracy of parameter identification such as blade vibration frequency and amplitude can reach more than 98%. Under the noise with signal-to-noise ratio of 1, the accuracy of parameter identification such as blade vibration frequency and amplitude can still reach more than 89%. The research shows that the identification of blade vibration parameters by genetic algorithm has strong anti-noise interference ability, and the principle is simple, and there are no tedious formulas and too many restrictions in operation.
In this paper, the parameter identification results are simulated in terms of sensor layout, number of sensors, and blade vibration engine order size. For blade constant speed synchronous vibration and blade constant speed asynchronous vibration, the layout and number of sensors have higher requirements. In terms of sensor layout, the angle between each sensor should not be an integer multiple of 2π, and a larger DR value should be guaranteed. The higher the engine order, the more sensors are needed. For blade variable speed synchronous vibration, engine order and sensor layout have little effect on parameter identification results, but the number of sensors cannot be less than 3, otherwise the identification accuracy will be seriously affected.
In this paper, the blade variable speed synchronous vibration test is carried out, and the blade vibration is measured by BTT method and strain gauge method. Based on genetic algorithm and blade tip timing, the parameter identification of blade vibration data is carried out, and the results are consistent with the results of blade vibration measurement by strain gauge method. The practicability of the blade vibration parameter identification system based on genetic algorithm is illustrated.
Footnotes
Handling Editor: Chenhui Liang
Declaration of conflicting interests
The author(s) declared no potential conflicts of interest with respect to the research, authorship, and/or publication of this article.
Funding
The author(s) disclosed receipt of the following financial support for the research, authorship, and/or publication of this article: This study is supported by the National Natural Science Foundation of China (Grant No. 52272436) and the National Science and Technology Major Project (J2019-IV-004-0071).