
Abstract
Statistical size and geometrical size are the main factors affecting the service life of mechanical structure calculation. To explore the reliability of the lifespan of beam structures, a probability lifespan numerical calculation method based on Vector Form Intrinsic Finite Element Method (VFIFEM) was proposed, and the method was verified through full lifespan experiments on I-beam welded structures. First, a fatigue fracture model that considers the coupling of residual stress (RS) and cyclic load variations was established. Based on this fatigue fracture model, a probability lifespan calculation model for beam elements was defined by proposing a cross-sectional shape correction coefficient and a position correction coefficient. The proposed probability lifespan model for beam elements was used to calculate the I-beam welded structure, and the calculated results were compared with the full lifespan experiment results, which were close in statistical results, with all experimental results falling within the [10%, 90%] interval except for one experiment. This method effectively couples the influence of statistical size and geometric size on probability lifespan, providing a new approach for the structure probability lifespan calculation in the future.
Introduction
In modern industrial equipment, beams are important load-bearing components, and complex beam structures are commonly welded by plate structures. In welded beam structure systems, size effect is very significant for studying the prediction structure life considering the effect of defects on fatigue strength.1,2 For the size effect, Kloos 3 first made the most detailed classification: (1) Statistical size effect; (2) Geometrical size effect; (3) Production size effect; (4) Surface size effect. The effect of statistical size on the fatigue life of metal structures can be explained as follows: as the size of the material increases, the number of defects gradually increases, and the strength of the material begins to decrease. 4 Different metal structure shapes have different effects on metal fatigue life, 5 and this effect is called the geometrical size effect. The effect of production size on metal fatigue is mainly due to different processes. The influence of surface size effect on metal fatigue is mainly caused by differences in surface processing and electrochemical corrosion.6,7
Various factors affecting the fatigue mechanism have been extensively studied by scholars, such as material properties of different metal materials,8,9 load variation,10,11 and special environments.12,13 However, the application of material fatigue behavior to predicting the life of engineering components also requires appropriate structural fatigue theory for calculation. Zhou et al. 14 calculates the life of turbine blade by deterministic life analysis method. First, Ansys is used to analyze the position where the maximum stress occurs on the turbine blade, and then the life calculation results at this position replace the results of the whole machine. This deterministic analysis method is one of the most commonly used design schemes today. But this design method ignores the randomness of the initial defect distribution, so the design results tend to be conservative, which makes it difficult for designers to discover a better design scheme. Nominal stress method, hot spot stress method 15 and structural stress method16,17 are three widely used structural life design methods. Although the structural stress method effectively reduces the sensitivity of the element type in the calculation of the structural life, it still cannot characterize the uncertainty of the material strength. The deterministic analysis methods for determining the metal structure fatigue have gradually shifted from using solid elements18,19 assumption to using plate and shell elements 20 assumption in recent years. Due to significant geometric simplifications made in beam elements, calculating the fatigue life of beam elements has become a challenging task. Currently, there is a lack of research on fatigue damage in beam elements. However, beam elements have the inherent advantage of lower computational requirements, making the investigation of fatigue assumptions for beam elements crucial in terms of both theoretical and engineering applications.
By combining probabilistic methods to describe the uncertainty of material strength, probabilistic fatigue design quantifies the effect of load variation, material properties, and model parameters caused by statistical uncertainty on fatigue life. 21 Therefore, probabilistic fatigue design has great research value in structural life design.
The probabilistic life design of the structure needs to effectively combine the material properties with the structural characteristics, which needs to consider the effects of statistical size effects and geometrical size effects. Scholars have established a lifetime probability model with statistical size effects.22–24 In order to explore the influence of defects in different parts, that is, the influence of geometric size on life, Wang et al. 25 used highly-stressed-volume model to study the effect of geometric size on life. Ai et al. 26 and Wang et al. 27 studied the effect of defect depth on lifetime. And Ai used the combination of the weakest chain theory and the highly-stressed-volume model to establish a lifetime probability model of the coupling of the geometric size effect and the statistical size effect. 26 Although the above-mentioned research has thoroughly investigated the structural characteristics of probabilistic life for structures, the conclusions drawn may not be directly applicable to the probabilistic life calculation of beam structures due to the unique characteristics of beam structures themselves. In the assumptions for beam structures, the positions of different cross-sections and the varying distances from the neutral axis within the same cross-section all affect the calculation of structural probabilistic life. Therefore, it is necessary to give full consideration to these two aspects in order to accurately calculate the probabilistic life of beam structures.
The remainder of this study is as follows. The basic theory of Paris law and VFIFEM beam element are introduced in Section 2. Section 3 mainly introduces the implementation method of the probability lifespan numerical calculation method for welded beams based on VFIFEM and the derivation process of the main formulas. Section 4 calculates the residual stress initial stress using finite element technology, and uses the random defect method to calculate the lifespan prediction proposed by this method, and verifies the effectiveness of the proposed method through full lifespan experiments on I-beams. Section 5 analyzes and discusses the experimental results and the calculated results. Finally, Section 6 presents some of the main conclusions of this study.
Basic theories
Fracture mechanics
Fatigue life is often calculated by stress-number curve, S-N curve, which is completely based on a large number of tests. And different loading forms need to use different S-N curves to predict the life, such as load ratio, alternating load, etc. Elastoplastic fracture mechanics provides a more scientific theoretical basis for fatigue life calculation. Scholars divide the whole fatigue life into three stages according to the fatigue crack growth rate


Where

where

Where
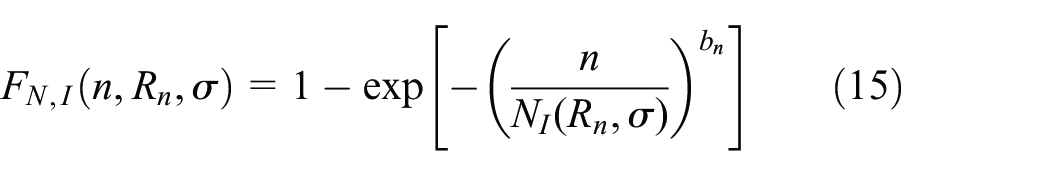
Although the number and size distribution of the initial defects of materials are uncertain, it can satisfy the statistical law, and fatigue nucleation crack also has statistical characteristics. Zhu
21
assumed that the nucleation initiation of each defect

Where,
Vector form intrinsic finite element method
VFIFEM provides a new and efficient numerical method to explore the stress distribution of complex structures.29,30 Therefore, VFIFEM may be used to calculate the probabilistic life of complex beam systems. Objects in VFIFEM are described by a series of particles. These particles, or nodes, are described by point values of the position vectors

Where,

Methodology
Based on VFIFEM beam element probability life calculation process
Statistical size is one of the main factors affecting the calculation of probabilistic life. In order to calculate the beam probability life with beam element, statistical dimension should be introduced to define the beam element. The minimum volume of the beam element shall be greater than or equal to that which reflects the statistical size of the material. VFIFEM is used to calculate the stress distribution of the beam to reflect the influence of geometrical size on life calculation. Based on the above logic, a probabilistic life calculation method based on VFIFEM beam element will be proposed, and the introduction of the implementation process can be found below.
The probability life is expressed mathematically by Weibull distribution function. The key of this method is to obtain the scale parameter

Technology roadmap.
Coupling analysis of residual stress and fatigue crack growth
Residual stress is one of the main factors affecting the lifespan of composite material connections, 31 including welding. The release of residual stress decreases with the increase of cyclic loading cycles. Due to the uneven thermal expansion and contraction of the material during welding, residual stresses exist after the welding is completed. As the crack expands, the energy in the weld is gradually released, which energy is caused by residual stress. And resulting in micro-deformation in a local range and gradually released, the residual stress also decreases sharply with the release of the energy. Under the influence of high temperature welding, the material in the heat affected zone has a great plastic deformation due to uneven heating. After plastic deformation, the elastic-plastic properties of the material are no longer the same. After cyclic loading, plastic defects are more likely to occur. As the load is applied, its mechanical properties gradually decrease, and the residual stress is further released.
The tendency of residual stress to decrease, define a decay function


where
Residual stress is gradually released with cyclic loading, so its effect on the metal structure is not linearly additive. Its effect on defects makes it difficult to gradually increase the defects in a linear form under the action of cyclic loads, but gradually increase in a non-linear form. The essence of this distribution is that due to the existence of residual stress, there is an additional load applied to the defect position. According to the decay functions of residual stress in equations (8)∼(9), the graph of the coupling of cyclic load and residual stress with time is drawn as Figure 2. The fatigue failure probability model with residual stress is studied in the flowing study.
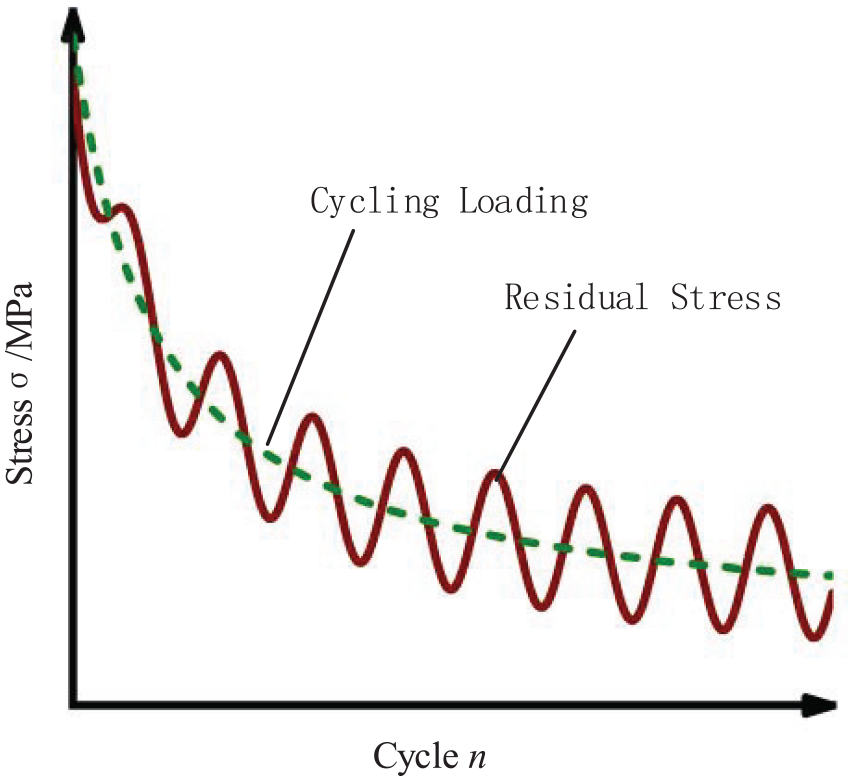
Coupling diagram of cyclic load and residual stress.
When calculating the effect of residual stress on crack propagation, the local stress


where
During a load cycle, the release of residual stress is continuous. However, since the residual stress release is related to its own magnitude and the instantaneous load situation, the process is a very complex nonlinear function related to the load history. Especially when the cyclic load is cosine load, the equation (9) is brought into the stress cyclic ratio equation (11), and the stress ratio

where

Walker equation is often used to calculate the influence of stress ratio on fatigue crack growth under cyclic loading, and the equivalent stress intensity

Where
It can be seen from Figure 3 that under the same stress level, the life predicted by the model with RS correction is smaller. This difference is more obvious in low cycle, and the life prediction values gradually tend to be consistent in high cycle. This is because the residual stress is gradually released with cyclic loading. And the life prediction value of RS modified model is always smaller than that of the model without RS modified model. The characteristic life of

S-N curve of life model with or without RS.
Calculating probabilistic life model of beam element
In the section 3.2, the probabilistic life model under the residual stress influence has been established. However, for the complex welded beam structure, the above probabilistic life model can’t fully express the residual life probability of each part. Because the load levels at different positions are not the same in the complex welded beam structure. Referring to Ai et al. 26 and Zhang et al.’s 33 zoning approach in calculating lifespan and reliability issues. The position information considered in this paper includes: (1) welding affected zone and non-welding affected zone on the same beam section; (2) different beam section positions in a beam structure.
The first kind of location information is calculated and analyzed in detail in the section 3.2, and the basic model is established in the section 3.3. With regard to the second kind of position information, that is, the difference of stress level distribution in different sections, VFIFEM gives a numerical calculation method superior to FEM. 34 Referring to the idea of discretization of continuum by finite element method, the continuous beam structure is also discretized when calculating the probabilistic life model of complex welded beam structure. The biggest difference between the discrete element here and the finite element model is that it needs to characterize the statistical size effect of different metals, and the size of the element should be greater than or equal to the statistical volume that can effectively describe the material defects. And equation (16) should be satisfied.

Where
Assuming that there are
Where

The length of the beam is

According to Euler-Bernoulli beam theory, the stress distribution on both sides of the neutral surface of the beam satisfies the linear distribution, that is,

Where
The interpolation function inside the beam is denoted as
According to the above definitions of


where

Splicing beam element
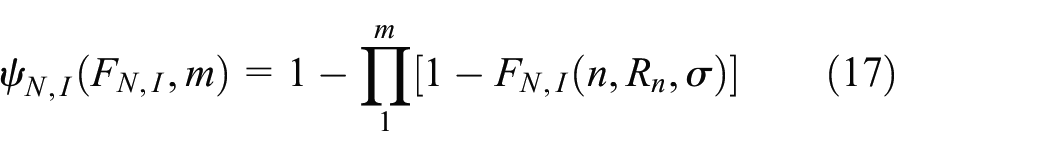
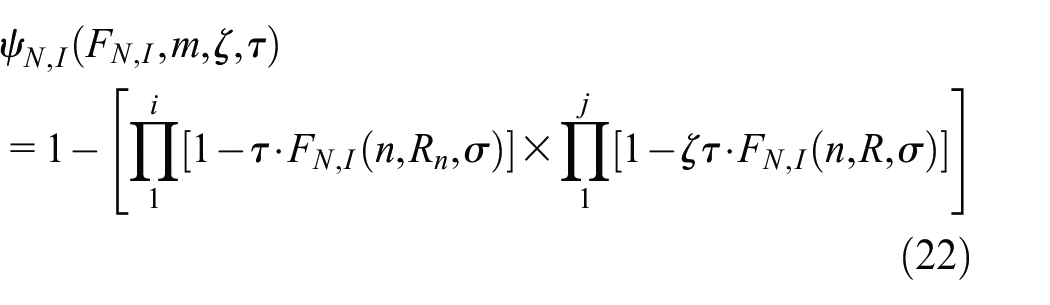
Based on the assumption that the nucleation initiation is independent of each other, it can be extended that the fatigue life of beam elements does not affect each other, and the fatigue fracture between beam elements is an independent event. The probability of failure of a beam element after
In the beam with

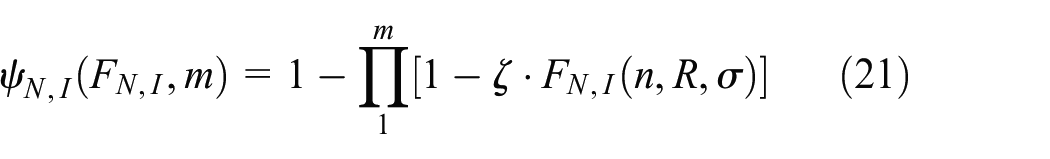
In addition to series relationships, parallel relationships also exist in mechanical structures. When the beam elements are in parallel, the entire beam structure will only fail if all the parallel beam elements fail. Assuming that in a beam structure, there are
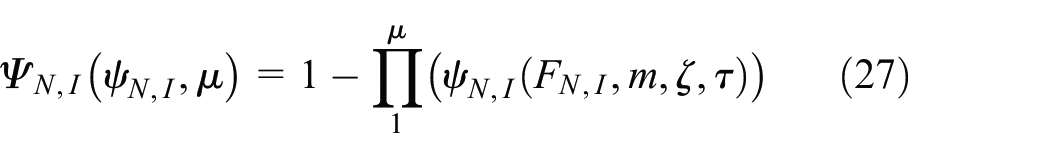
The probabilistic life of the beam structure is rewritten as equations (26) and (27).
Calculation and experimental verification of welded I-beam lifespan
Welded I-beam life test
This test adopts Chinese structural steel Q235. The

The size of the specimen.
The web and upper and lower flanges of the I-type welded beam are 8 mm thick, the length of the welded beam is 650 mm, the height is 80 mm, and the size of the two welds is 6 mm. The width of the upper flange plate of I-beam is 100 mm and the width of the lower flange plate is 50 mm.
The cycle load stress level is based on the theoretical critical point position, and the strain gauge layout is shown in Figure 5.
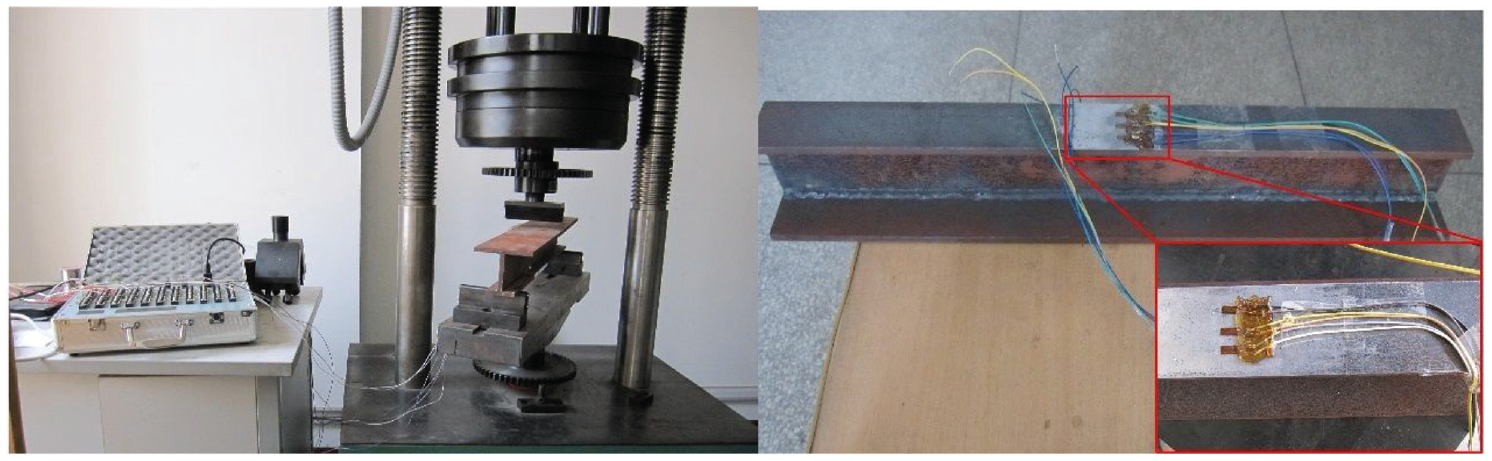
Fatigue test equipment installation.
The stress level was based on the theoretical dangerous point position, and the strain gauge arrangement was shown in Figure 5. The applied stress levels were 175, 160, 140, and 120 MPa respectively, and the stress cycle characteristic was 0.25. A total of 28 I-beams with the same technology were tested in full life. The standard of failure was defined as the occurrence of cracks over 20 mm visible. Stopped loading immediately after the crack was found.
Figure 6 shows typical cracks produced by several test pieces. Cracks are marked by red dotted lines, black dotted lines are the geometric axis of I-beam, and black elliptical points are the origin of coordinates. The weld is more prone to initial defects, the stress concentration level in this position is higher, thus the weld becomes the initiation position of failure crack.

Partial results of life test.
Welded I-beam structures thermal elastoplastic mechanical calculation
The experimental measurement of residual stress (RS) is difficult.
36
But FEM provides a convenient solution for different forms of residual stress.37,38 In the welding process, due to the local welding heat source, the material does not expand evenly in heat and contract in cold, which inevitably leads to residual thermal stress. Referring to the welding requirements of Q235, load the moving three-dimensional Gaussian heat source, heat source movement speed

Where
Welding heating cloud diagram.
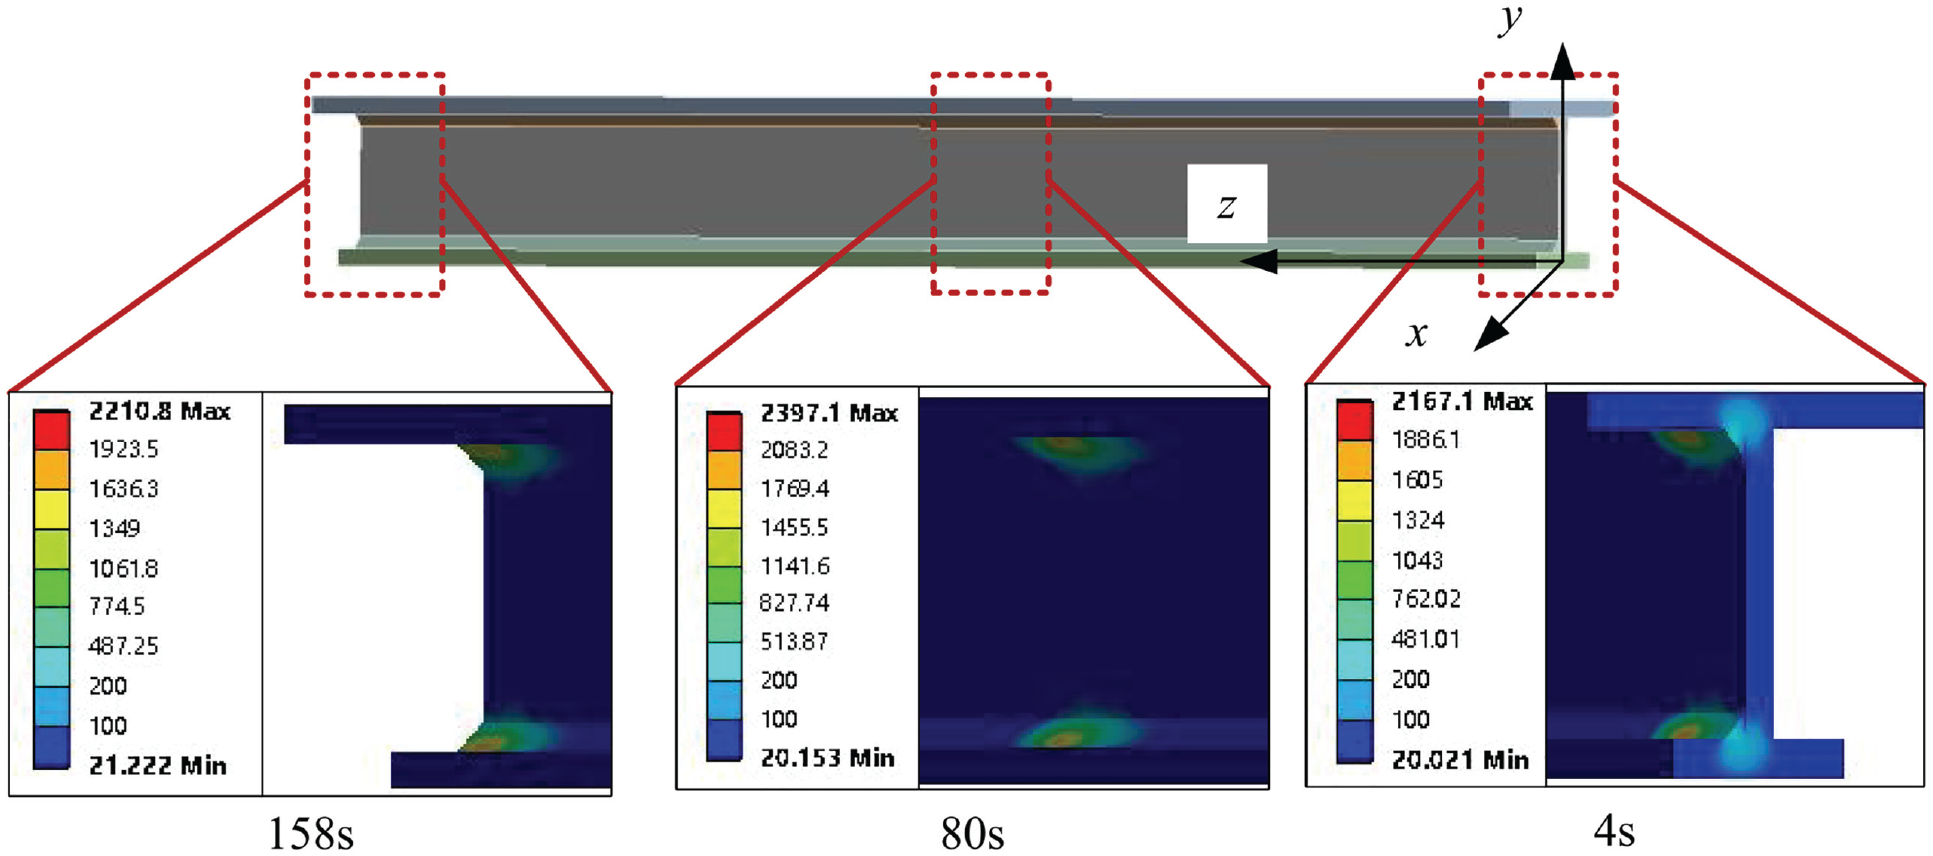
The RS of I-beam middle position is shown in the Figure 8, three paths around the weld are selected for stress observation. Paths 1 and 2 are the position where the weld bead and the web are close and the position where the weld bead is close to the lower flange plate, respectively. Path 3 represents the position of the weld throat. The direction of the arrow in the legend represents the positive direction when extracting data. It can be seen from Figure 8 that due to the free surface of the welding throat, there is no other object constraint in the process of thermal expansion and contraction, and the residual stress is small. The residual stress of path 2 is larger than that of path 1 as a whole. And due to the different effects of gravity, the stress distributions of paths 1 and 2 are not the same. The weld fillet has the largest residual stress, which may be related to the structure of the model.
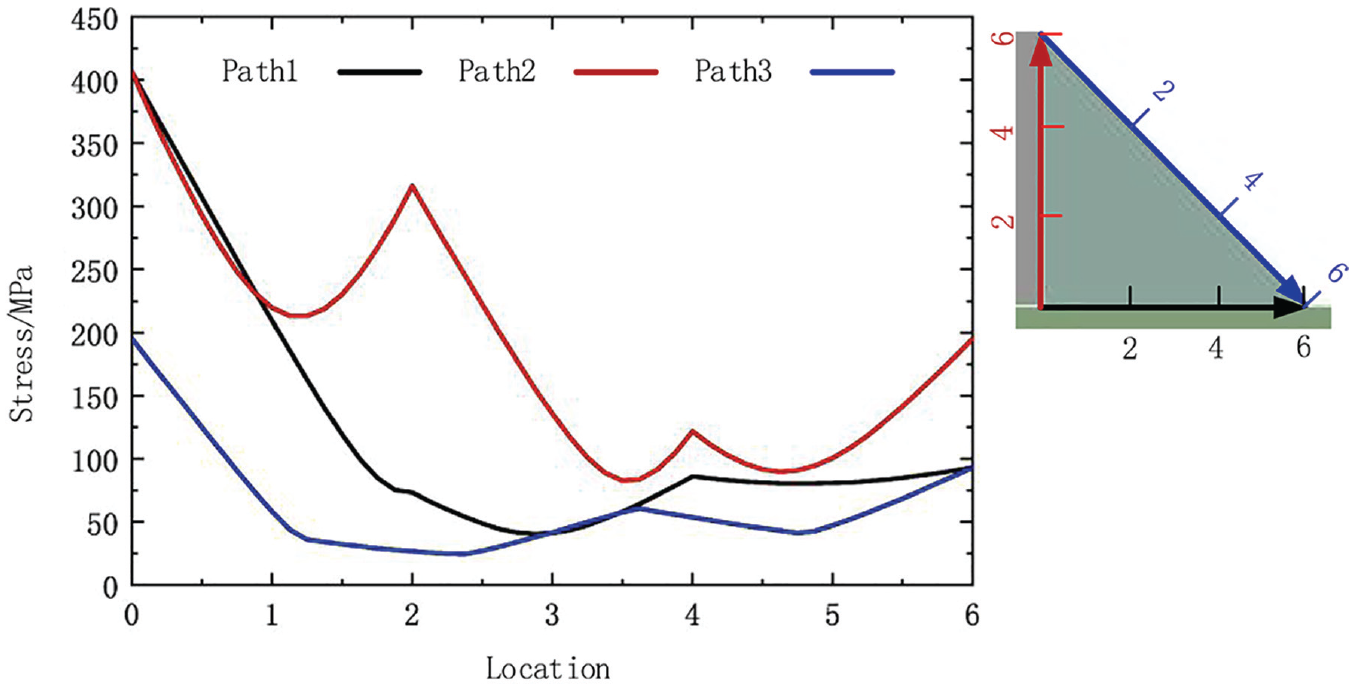
Residual stress under different paths.
Calculation model
In this test, the simplification of simply supported beam is satisfied. The load applied to the neutral surface can be approximately assumed as beam with bending moment only. According to the conditions that the element proposed in this paper needs to meet, when the beam length exceeds 20 mm, the minimum statistical distribution size

I-beam diagram: (a) I-beam force diagram and (b) element nodes diagram.
To verify the results of the life model, the random defect method is used to simulate the probability model. Firstly, it is necessary to generate random initial defects. Now the inverse transformation method is used to generate random size and number of initial defects. The size and number distribution of initial defects satisfy Weibull distribution. A set of uniformly distributed random numbers

The distribution function is inversely transformed.


Where


The diameter of the main plane projection area of the initial defect of low carbon steel is mainly 0.02∼0.3 mm, and the value of m in each volume is 0∼4000 within the beam length of 20 mm. First, 10,000 points are randomly selected from the array
The distribution of defects per unit volume can be randomly selected from this 10 million samples. For a single I-beam, the initial defects of
Two hundred fifty simulation tests are carried out for each load level, that is, 1000 tests are carried out in total, so as to ensure that the results are sufficient to characterize the distribution characteristics of I-beam life.
Results and discussion
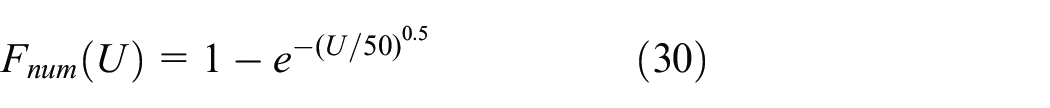
According to the independent hypothesis of defects, each defect on a beam is calculated to obtain different life, and the minimum value of defect life on each beam is extracted as the life value of this following beam. The above life calculation process was performed 250 times for each stress level and the following results were obtained. In order to make the simulation life calculation results more significant compared with the test life results, the results are plotted in the following figure. Under the stress cycle grades of 160 and 175 MPa, there was one test where no obvious crack was found after
Under these four stress levels, according to the method proposed in this paper, the life results are well predicted, and the predicted results are in good agreement with those of the whole experiment. Except for one experiment with a load cycle of 160 MPa, which exceeded 10% of the life reliability interval, the other life predictions all fell within the range of 10%–90%. It shows that the proposed calculation model can effectively simulate the situation. It can be seen from the comparison of the four figures in Figure 10 that with the increase of load magnitude, the calculated life values become more and more concentrated.
Lifetime comparison between simulation and experimental results: (a) 120 MPa, (b) 140 MPa, and (d) 175 MPa.
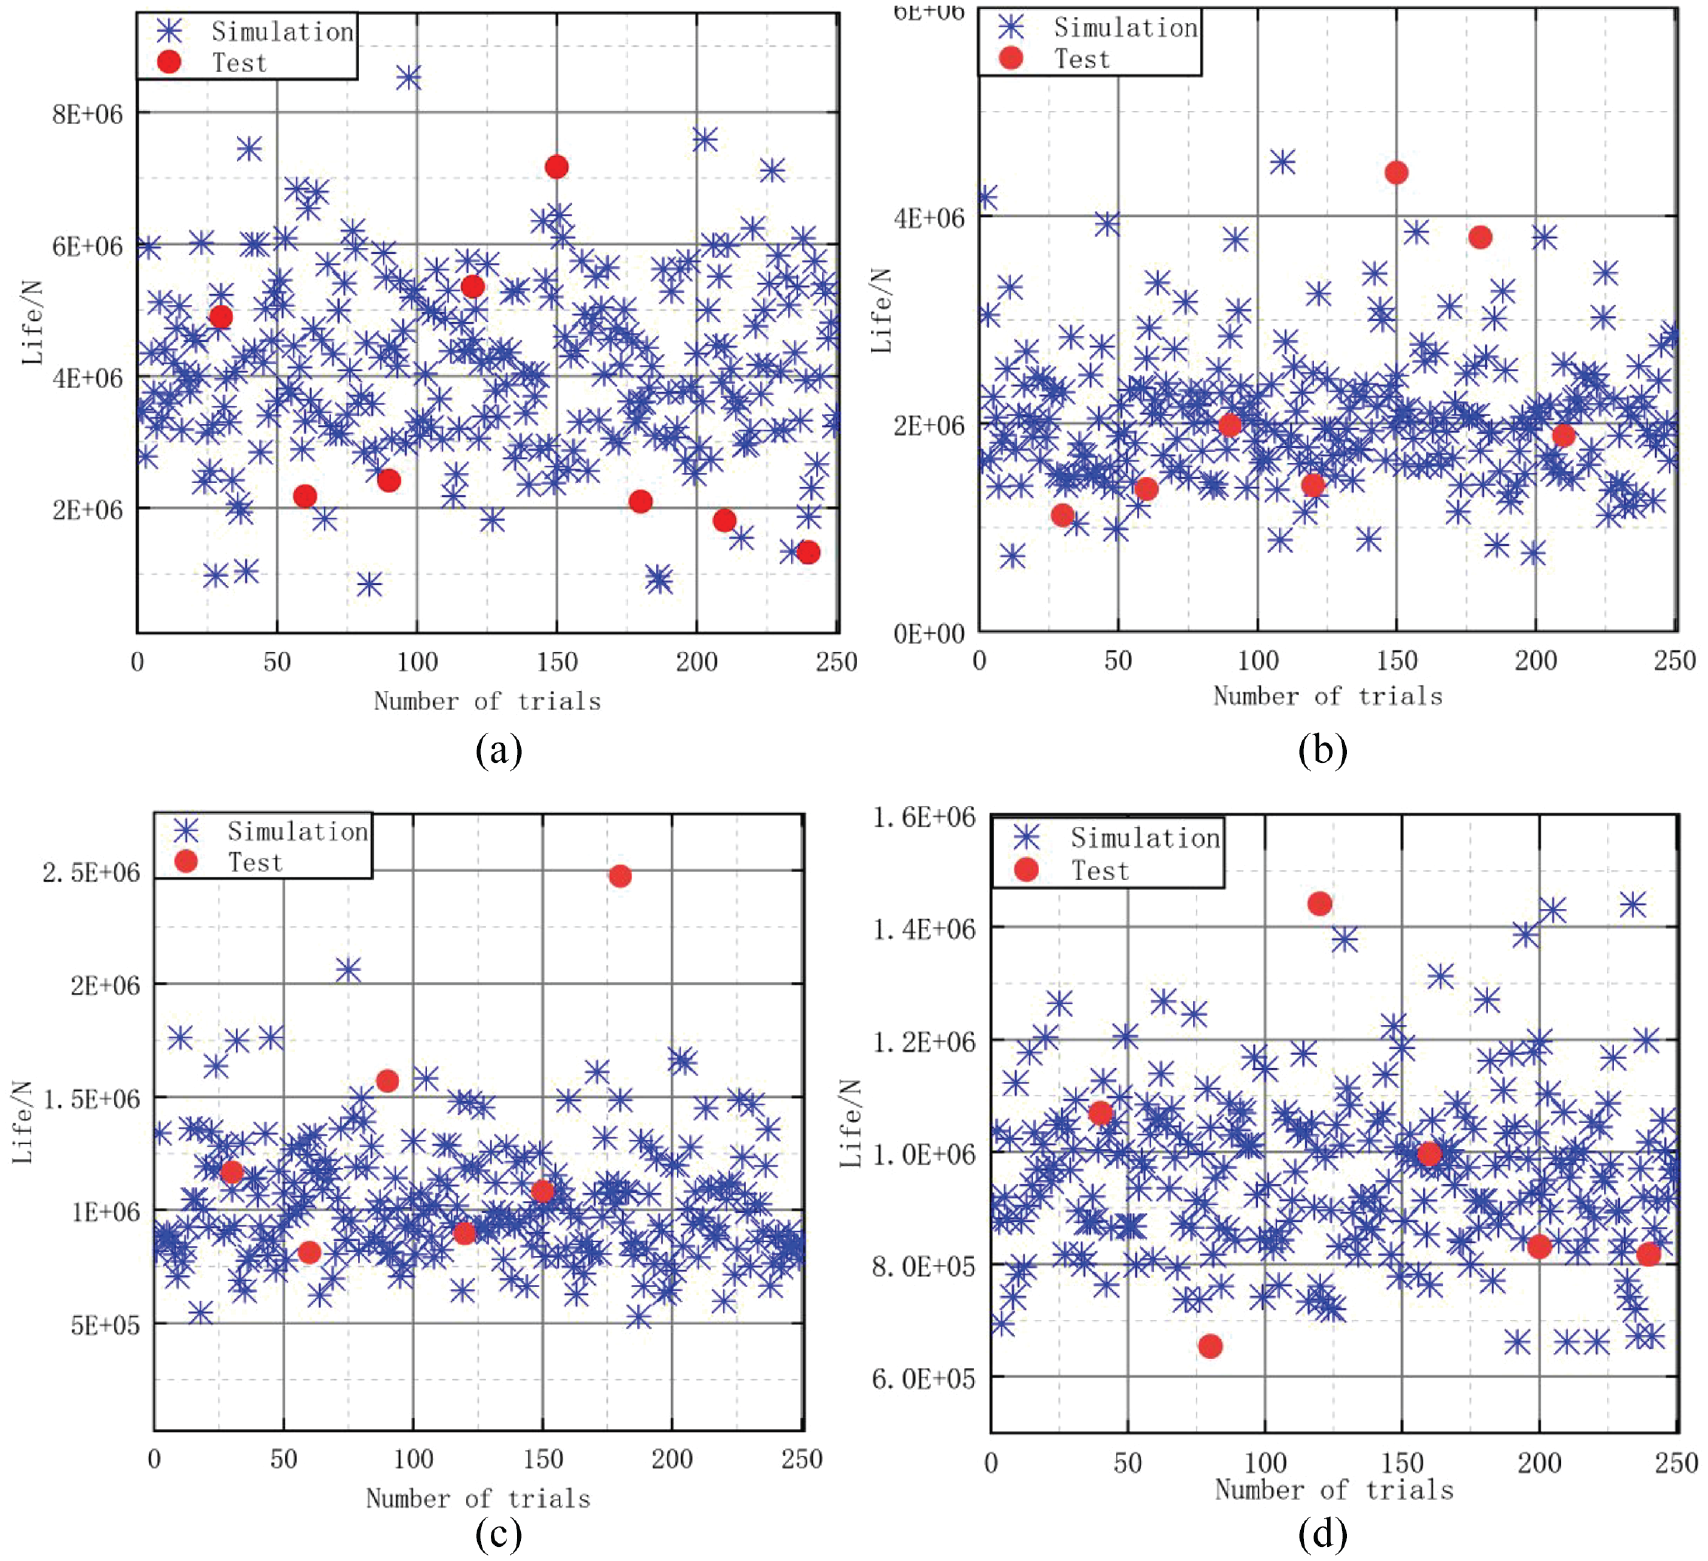
As the result of one life test in the 160 MPa load level experiment far exceeds the expectation, it may be caused by the inconsistent distribution of material defects, which will be removed in the subsequent statistical calculation. The calculation results as shown in Table 1 can be obtained. With the increase of the load level, the error between the simulated mean value and the experimental mean value gradually approaches, and the error is 4.79% at the highest level of 175 MPa, with the maximum error not exceeding 17.30%. The error is obvious under low load cycle, which may be caused by inaccurate simulation values of defects. With the increase of load, the crack propagation rate is increasing, and the load gradually replaces the crack size as the main factor affecting the life span. That is, under low load cycle, the life of the structure is mainly determined by the crack size; and under heavy load, the life of the structure is mainly determined by the load. Therefore, when predicting the low load life, the distribution of defects needs more detailed statistical discussion. Compared with the experimental value, except under the low load cycle of 120 MPa, the average life calculated by simulation is smaller than that obtained by the life experiment, which is a safe design.
Simulation and experimental life error analysis.
Conclusion
This research proposes a method for calculating the probabilistic life of welded beam structures based on VFIFEM. It comprehensively considers the influence of statistical and geometric dimensions on the fatigue life of welded beams.
A probabilistic life model, considering the coupling between residual stress and load under initial material defects, is established, and a combined finite element and probabilistic life calculation method is proposed.
By introducing the beam correction factors ζ and τ, as well as the calculation method for probabilistic beam elements ζ and τ, a VFIFEM-based method for calculating the probabilistic life of welded beam structures is developed.
The effectiveness of the proposed method is validated through full-life experiments on I-type welded beams. All experimental results (except one) fall within the predicted probability range of [10%, 90%]. We simulate the life of I-type welded beams using a random defect method. The simulation results demonstrate that this method has higher computational accuracy in life design than the hot spot stress method.
Footnotes
Handling Editor: Chenhui Liang
Declaration of conflicting interests
The author(s) declared no potential conflicts of interest with respect to the research, authorship, and/or publication of this article.
Funding
The author(s) disclosed receipt of the following financial support for the research, authorship, and/or publication of this article: This work supported by Shanxi Provincial Natural Science Foundation, China (20210302123217), Innovation Project Fund for Graduate Students of Shanxi Province, China(2022Y676), Research Project Supported by Shanxi Scholarship Council of China(2020-124), Innovation Project Fund for Graduate Students of Taiyuan University of Science and Technology, China(BY2022012; BY2022014).