
Abstract
Geopolymer concrete (GPC) is an eco-friendly, sustainable, cementless and green concrete. It could be an alternative to the conventional concrete. In alkaline circumstances, the alumina and silica concentration in geopolymer concrete creates the geopolymer bond, while regular concrete creates C-S-H (calcium silicate hydrate bond). The final result of the geopolymer bond does not include any water. At elevated temperatures, geopolymer concrete would thus be more stable. Due to its greater strength and durability quality, geopolymer concrete may be the ideal replacement for ordinary portland cement (OPC) concrete. This research intends to examine how specimens of geopolymer concrete and regular concrete respond to exposure to increased temperatures between 100°C and 800°C. Mass loss, ultrasonic pulse velocity, compressive strength, X-ray diffraction, thermogravimetric analysis and derivative thermogravimetric analysis were all examined throughout the experimental examination. Both concrete specimens lose mass or weight as the exposure temperature rises; OPC concrete samples spalls at 600°C, while GPC sample fail at 800°C. GPC specimens lose around 12% of their original mass after being exposed to temperatures of 800°C, while OPC specimens lose about 7%. The GPC specimens maintained 60% of their initial compressive strength after being exposed to a temperature of 700°C, but the OPC concrete specimens only kept 52%. With each increase in exposure to extreme temperatures, the peaks of quartz and cristobalite are lowered. Only the form or structure of the mineral oxide would change; the chemical linkages would remain. The GPC samples subjected to temperatures of 100°C exhibit effective thermal stability than all other specimens exposed to extreme temperatures. As the exposure temperature rises, the GPC specimens become more thermally stable. According to the experimental findings, the GPC specimens’ bonding structure makes them more resistant to high temperatures than regular concrete specimens. Micropores are present in the voids of the geopolymer matrix, while mesopores and micropores are present in the voids of the OPC matrix. While OPC bonding is C-S-H formed by the hydration of lime and silica contained in the cement, the geopolymer bonding did not include the water content in the final or end result of geopolymerisation for strengthening.
Introduction
Geopolymer concrete would be an example of sustainable construction. Concrete is a primary building material around the globe for many decades, in which OPC works as a binder material in the mix. High energy utilises production of Portland cement and causes significant carbon dioxide emissions due to burning large quantities of fuel and calcareous breakdown. The carbon dioxide emission during the production of cement contributes around 8% of total carbon dioxide emissions. 1 In future years, the carbon emissions increase due to the increment in the demand for concrete. So, GPC could be an alternative to conventional concrete because it utilises pozzolans like GGBFS, flyash, calcined clay, rice husk ash, etc. as a binding material for the replacement of cement.2,3 Geopolymer is a name of the chemical bond which were initially developed by Prof. Davidovits in 1991. This novel bond is a three-dimensional (3D) inorganic polymeric matter produced using an alkaline solution including sodium silicate and sodium hydroxide that reacts with any substance rich in silica and alumina.4–8 GPC is an environment-friendly inorganic polymers that are produced by the synthesis action of aluminosilicate sources in alkaline and hydrothermal conditions. 9 In contrast to Portland cement, geopolymer concrete’s manufacturing cuts energy and produces less greenhouse gases because it utilises industrial waste and by-products as binding. 10 As an engineering binder material, geopolymers may also be used to create geopolymer mortars and concrete.11–14
Due to its extensive spectrum of chemical components and reactions, geopolymer concrete exhibits several characteristics that are common to concrete.15–17 Geopolymer concrete has a growing concern in many areas as an alternative construction material to ordinary concrete in the context of environmental preservation and sustainable development.18,19 Fly ash and slag are the key raw materials used in the production of geopolymers. In recent years, there has been a lot of interest in the properties of geopolymer paste formed from blast furnace slag or fly ash.20–31 Currently, there is less research publication on the high-temperature performance of geopolymer concrete. Concrete buildings should be resistant to high-temperature impacts due to natural or human-related incidents over their service lifetime. The increase in temperature leads to a sequence of physicochemical changes that are not reversible, resulting in many internal defects like cracks and pores. 32 These defects might lead to concrete degradation and cause local damage or collapse in the structure. The characteristics and kind of binder vary between the GPC and OPC concrete. Calcium silicate hydrates are formed via the hydration processes of calcium oxide and silicon dioxide in the OPC binder. Furthermore, the GPC binder is made by alkali activating aluminosilicate raw materials, then polymerised in a high pH environment and hydrothermal circumstances at fairly low temperatures to produce the reaction result. This chemical structure gives GPC materials advantages over their OPC concrete. It also improved the strength performance against exposure to high temperatures. 33 Previous research on the thermal characteristics of flyash geopolymers found that these materials had little thermal shrinkage and maintained their strength after being exposed to high temperatures.34–37 The flexibility of geopolymer mortars after 800°C exposure has a significant influence on their residual strength. 38 Alkali-activated metakaolin with Na2SiO3 and NaOH solutions creates a lightweight geopolymer mortar that can unite broken shale, haydite sand and withstand fire. 39 After being exposed to a high temperature of 950°C for 30 min, the lightweight geopolymer mortars that had been cured at 20°C for 28 days indicated a strength loss of up to 63% of their original strength. 40
It offers a scientific basis for the destruction or remediation of fireproof structures made with geopolymer concrete and helps to generalise the use of geopolymer concrete.41–45 The non-destructive identification and deterioration of fire-damaged buildings are always utilised for ultrasonic testing. 46 Geopolymers are highly fire-resistant due to their inorganic structure, and they have exceptional thermal resistance with little gel structure deterioration identification up to 700°C–800°C. Therefore, the GPC may be a replacement for OPC concrete in the building of high-risk infrastructures. It is important to realise that geopolymeric materials change their compressive strength after heat exposure.47,48 Gel structures analyse the GPC’s pore structure network, which manages moisture at high temperatures with lesser porosity, improving fire resistance by releasing trapped water vapour.49,50 Particle size distribution, fly ash content, the kind of alkaline solution used and the exposure temperature are all factors that may affect the reaction rate, chemical composition and microstructure of a GPC that is based on fly ash.51–59 The GPC’s main reaction is an alkaline silicon tetrahedron alloy arranged into three dimensions.60–64 Recent study has concentrated on the following topics: (1) A study of the mechanical properties of geopolymers at high temperatures, (2) investigating the effectiveness of different FA-based geopolymer and geopolymer composite types, as well as their performance at elevated temperatures and (3) researching the details of the unique behaviours of GPC and OPC concrete in fires.38,55,65–67
The geopolymer mortar gains or loses strength after being exposed to high temperatures. 68 After conducting the experiments, the authors concluded that sintering or additional geopolymerisation at a higher temperature has the impact of increasing strength, and the second is thermal incompatibility damage.9,69 The smaller degree of damage was shown, the greater the frequency of retention components. The small frequency components would otherwise prevail over the observed frequency range.70,71 Therefore, by modifying the recorded ultrasonic signals in the frequency area, you may indirectly demonstrate high-temperature damage to concrete.72,73
Research significance
This study is to determine the thermal stability of GPC and ordinary concrete to elevated temperatures and validate them with predict models by other authors and code. Firstly, cast the GPC and ordinary concrete cube samples and check the compressive strength UPV of that. Both concrete samples were kept in the muffle furnace for 2 h from 100°C to 800°C and found that the ordinary concrete samples fail at 600°C, whereas the GPC samples fail at 800°C. Continuously, check the mass loss, UPV and compressive strength after the exposed temperature. After the destructive test, matrix powers were extracted from the samples and checked the microstructure analysis by the XRD and TGA tests. Validate the results of the test with the model equation givens by the various authors. After the study, it could be concluded that the GPC is highly stable than ordinary concrete.
Experimental programme
The experimental programme includes the properties of the materials, mixing, casting, curing and test setups.
Materials
Cement, fine aggregates, coarse aggregates, binding materials (Sodium silicate and sodium hydroxide), water and superplasticiser are all included in the materials section. The materials used to create the OPC concrete and GPC specimens for the experimental analysis are introduced in the next paragraph.
To determine the properties preliminary tests were performed on material samples at the DTU Concrete Laboratory, Civil Engineering Department. The materials were subjected to SEM and EDS testing at Jamia Millia Islamia’s nanotechnology lab, while the XRD test was performed at DTU, Delhi. JK Cement OPC 43 grade was purchased from the market and its qualities were tested in accordance with Indian standards. 74 All basic properties of cement are checked in the laboratory for quality check as per the Indian standard. Flyash were collected from the thermal power plant because it is a solid waste of the thermal power industry.
During the experimental study, the GPC mix design includes class c flyash. In Figure 1(b), the SEM image of flyash reveals the spherical and porous character of the particles. Figure 1(a) shows fly ash amorphous character. Table 1 lists the chemical components identified in the flyash by XRF analysis. The elemental composition of flyash was determined by the Jamia Millia Islamia Nanotechnology Laboratory in New Delhi, India, as seen in Figure 1(d). Slag is the waste material found in iron ore and steel ore after the steel industry’s rubbish has been removed. In a steel manufacturing facility, molten iron steel is used to remove slag. The GGBFS composition also comprises silica and alumina in substantial amounts. GGBFS was brought in from the Bhilai steel factory in order to test and create GPC mix specimens. On exhibit in Table 2 is the mineral oxides of GGBFS, and on display in Figure 1(a) is the GGBFS XRD graph, which illustrates the amorphous nature of samples. SEM image of the GGBFS sample is shown in Figure 1(c), which illustrates the irregular shape of the particles at 2 microns, and Figure 1(e) depicts the EDS graph, which illustrates the components in the samples. Figure 2 depicts the flyash and GGBFS gradation curve.

(a) Graph of XRD, (b) flyash SEM image, (c) GGBFS SEM image, (d) flyash EDS graph and (e) GGBFS EDS graph.
GGBFS and flyash mineral oxides.

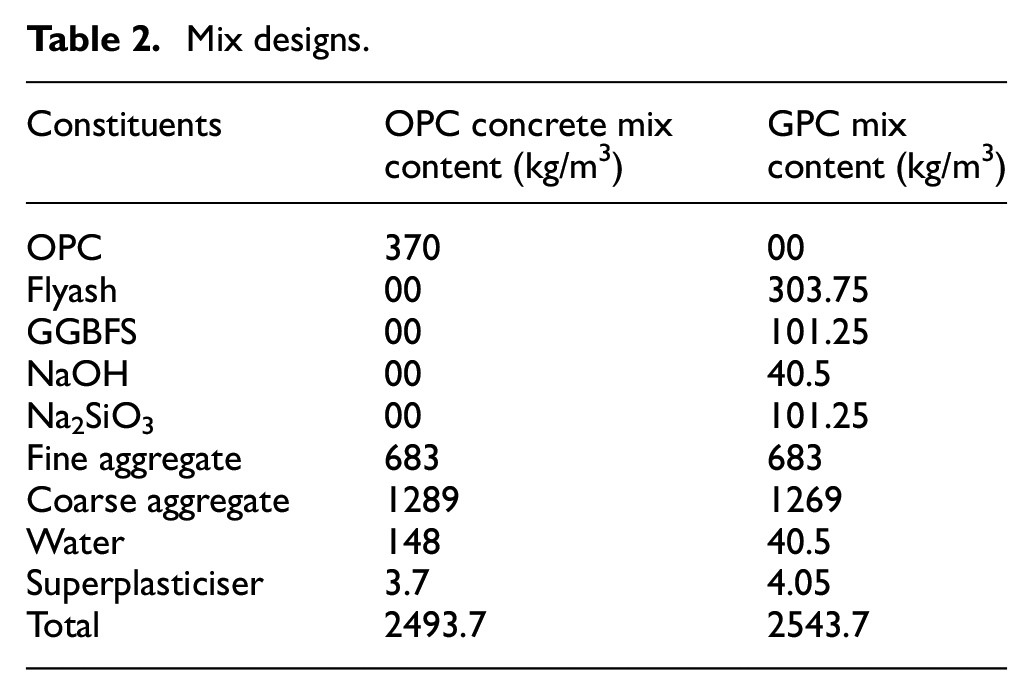
Mix designs.

GGBFS and flyash cumulative particle size.
In order to get the pozzolanic materials ready for the geopolymerisation process, an alkaline solution is applied to them, which produces a geopolymer link. Prior to mixing and casting, an alkaline solution must be produced (20–24 h). The ratio of sodium hydroxide to sodium silicate solution was exact. Fisher Scientific chemicals Pvt. Ltd. supplied samples of sodium hydroxide flakes, while CDH Pvt. Ltd. supplied sodium silicate. The mix design sample of sodium hydroxide flakes is shown in Figure 3(a), whereas the sodium silicate sample is illustrated in Figure 3(b).

Picture of raw GPC materials: (a) Sodium Hydroxide, (b) Sodium Silicate, (c) Superplasticiser, (d) Stone Dust and (e) Coarse Aggregates.
The aggregate acts as the skeleton of the concrete, comprising up to 85% of its overall volume. Coarse and fine aggregates are the most common kinds of aggregates used in the concrete mix. The design mix contained two sizes of coarse aggregates: 10 and 20 mm. As fine aggregates in the mix design, crushed stone or stone dust were used. Prior to incorporating the aggregate into the mix design, its quality was evaluated in accordance with Indian standards, which included a check of its grading, fineness modulus, size, water absorption, specific gravity, silt content, soundness, crushing, impact, abrasion value, flakiness and elongation index. Figure 3(d) provides an illustration of the use of stone dust in the blended design. The sand quality was identified in the laboratory test for concrete. The coarse and fine aggregate gradation curves are shown in Figure 4, which demonstrates that both aggregates are properly graded.

Aggregates gradation curve.
All concrete compositions included local raw materials and resources. The fraction of aggregates in the sample was used to determine the particle sizes, and the fineness modulus of the coarse aggregate was computed. Figure 3(e) illustrates samples of coarse aggregate. Sieve examination reveals that the fineness modulus of the coarse aggregate is 7.29, as indicated by the sample. In the hybrid design, the SNF-based superplasticizer SP Conplast 430 was used. The superplasticizer enhances the workability of concrete mix by reducing the amount of water while simultaneously improving its strength. Figure 3(c) depicts the superplasticizer used during the testing.
Mixing, casting and curing
Both GPC and OPC concrete were mixed for 2–5 min in the pan mixture before being poured into 150 mm × 150 mm × 150 mm cube moulds. The GPC alkaline solution was made before 20 h of mixing, while OPC concrete components are used directly without any preparation. Both samples were cast in similar moulds, however, the conventional concrete specimens were cured in a water tank, while the GPC specimens were cured in an oven for 24 h at 600°C. Table 2 displays the total amount of GPC and OPC concrete used to create specimens for testing.
Test setups
Initial samples consisted of cube-shaped concrete mix design specimens and tests for compressive strength, density or mass, as well as UPVT for future reference. The specimens of reinforced concrete were placed in the muffle furnace to expose them to increased temperatures, and the impact of elevated temperatures on the specimens’ compressive strength, mass loss and UPV was evaluated. The GPC matrix was also subjected to microstructural investigation, which included XRD and TGA testing.
Both cubes of concrete were subjected to severe temperatures between 100°C and 800°C. The cube samples were heated for 2 h in the muffle furnace at a predetermined temperature, with the temperature rising from room temperature to a certain raised temperature at a rate of 10°C/minand cooling randomly to the ambient temperature of the surrounding environment. Figure 5(a) shows the variation of temperature exposure on concrete samples, whereas Figure 5(b) depicts the muffle furnace used in this examination at raised temperatures. After being exposed to high temperatures and allowed to cool, the specimens were determined for strength weight loss.

(a) Picture of the heating process and (b) picture of muffle furnace.
The XRD and thermogravimetric examinations provided the microstructural analysis of the GPC samples. The XRD test revealed the intensity of mineral oxides in the GPC sample. 75 The TGA study revealed that the samples had their thermal stability up to 850°C. The sample could be weighed sequentially at different temperature stages while the temperature increases by 10°C/min. 76
Results and discussion
In the cube moulds, samples of both GPC and normal concrete were cast. Before the compressive strength test, density and UPVT were measured 28 days after the casting of the specimen and before its compression. Figure 6(a) illustrates the relationship between compressive strength and concrete age for both concrete samples. The compressive strength of the GPC and standard concrete specimens at 28 days is 35 and 36.3 MPa, respectively. In 28-day tests, the density and UPVs of the GPC specimen are 2476 kg/m3 and 4492 m/s, while the corresponding values for conventional concrete are 2490 kg/m3, and 4520 m/s. The fluctuations of the UPV of both concrete specimens are illustrated in Figure 6(b), which demonstrates that the UPV of OPC concrete is larger than that of GPC concrete at all ages except the 3-day test.

(a) Graph of compressive strength and (b) graph of UPV variation of both concrete.
Effect of elevated temperature
Muffle furnace was used for concrete sample temperature exposure, which allowed for total control over the temperature’s stability as well as the pace at which the temperature increased during time. GPC and OPC concrete samples were put into the muffle furnace for a period of 2 h at a precise controlled elevated temperature that ranged from 100°C to 800°C, with a rate of temperature rise of 10°C/min. After being subjected to high temperatures, the specimens were investigated in terms of the amount of mass lost, the UPV and the compressive strength.
Mass loss
The OPC concrete specimens fail at a temperature of 600°C, while the GPC specimens fail at a temperature of roughly 800°C. Both concrete mix specimens weight reduces as the exposure temperature rises. After being subjected to increased temperatures from 100°C to 800°C by interval of 100°C, the density variation of both concrete concrete mix samples is depicted in Figure 7(a). Both concrete samples mass loss varies as per exposed temperature ranging from 100°C to 800°C is depicted in Figure 7(b). In contrast to OPC concrete samples, which fail at 600°C, this figure shows that both concrete mix mass loss which is rise with the exposed temperature. The OPC concrete specimens can withstand elevated temperatures up to 800°C. After being heated to 800°C, GPC specimens lose around 12% of their initial weight, while an OPC concrete sample will fail at 600°C and will demonstrate a mass loss of 7% after exposure to 500°C. It has been determined that GPC specimens are less likely to degrade when exposed to high temperatures.

(a) Graph of density variation, (b) graph of mass loss variation, (c) graph of UPV variation, (d) graph of compressive strength variation and (e) graph of residual compressive strength variation with the temperature.
The high-temperature hits cause a large amount of damage to the geopolymer’s solid matrix, and the increasing temperatures fasten the development of cracks and loss their strength, both of which eventually result in the formation of voids in the matrix. When the temperature increases, a process known as dehydration starts. During this process, moisture flows on the surface of the specimens and then exits. This results in interior destruction due to the microstructure of samples as well as a loss of weight in the geopolymer matrix. During the early stages of heating, the geopolymer sample experiences a rapid loss in weight owing to the presence of free water and structured water.
Ultrasonic pulse velocity test (UPVT)
The UPVT is a method for determining the quality of materials that does not involve any damaging processes. It does this by using ultrasonic pulse waves. Figure 7(c) is a graph that shows the variation of UPV of both concrete mix samples with exposed temperature. This graph demonstrates that the GPC specimens UPV first rises up to a temperature of 200°C, whereas the UPV of OPC concrete samples initially increases up to a temperature of 100°C when subjected to the same temperature. Following this point, the UPV of both concrete specimens will continue to decrease with each succeeding increase in the exposure temperature. The UPVs of the GPC specimens are noticeably lower than those of the normal concrete specimens during the first exposure to 100°C, although they attain high values. The examples of OPC concrete failed at 600°C, but the GPC samples were failed at a temperature of 800°C.
Both the sample’s porous structure and the amount of water that evaporates from the matrix rise as the exposed temperature increased. As a consequence of the loss of mass, there are now more voids. As a direct consequence of their being more vacancies, the ultrasonic pulse velocity would be decreased. In addition, the production of microfractures was hastened by an increase in temperature, which resulted in a decrease in the density of the composites. The time it takes for ultrasonic velocity waves to propagate has been lengthened, which has led to decreased UPV levels. The melting point of GPC fibre matrix and the formation of tiny channels both occurred above a temperature of 300°C, which contributed to the discovery of lower UPV values.
Compressive strength
The specimens were exposed to 100°C, 200°C, 300°C, 400°C, 500°C, 600°C, 700°C and 800°C, and the compressive strength of OPC concrete and GPC were determined after exposure. Figure 7(d) illustrates the variability in compressive strength that occurred in each of the concrete specimens after being subjected to higher temperatures. At a temperature of 100°C, the compressive strength of OPC concrete samples are higher than the GPC samples, but after reaching that temperature, it begins to drop. The GPC samples were strengthened up to 200°C temperature exosure, but beyond that point, they begin to disintegrate continuously. The fluctuation in the residual strength of both concrete mix samples that were exposed to higher temperatures is shown graphically in Figure 7(e)’s graph. The GPC specimens and the normal concrete specimens both failed when exposed to temperatures of 600°C and 800°C, respectively. After being subjected to a temperature of 700°C, the GPC specimens maintained their initial compressive strength of 60%, while the OPC concrete samples were maintained their compressive strength of 52% after being subjected to a temperature of 500°C. In light of this, GPC samples are superior than regular concrete specimens in terms of their resistance to high temperatures.
Due to water evaporation and dehydration of the geopolymer matrix, melting of the bonding between the matrices, and thermal exposure in response to free water evaporation, the strength of the geopolymer matrix was drastically reduced between 600°C and 900°C. The strength of mortar and matrix are higher than the GPC made with lightweight particles (LWAGC). The porous structure of LWA concrete mix matrix would initiate to weaken the strength of the samples, it was expected that the strength of LWA concrete would be substantially lower than geopolymer paste and mortar. This was the case because LWA has a lower strength. Due to high temperature exposure, the geopolymer mortar sample saw a greater decrease in its flexural strength than in its compressive strength. At elevated temperatures, the flexural strength was more vulnerable to the formation of microstructural defects, such as the propagation of fractures and the formation of porous structures.77–82 Losses in compressive strength are varied from 31% to 85% in fibreless geopolymer specimens, but losses in polypropylene fibrous geopolymer specimens from 32% to 86%. This rate has risen considerably in comparison to samples lacking fibres. Losses in flexural strength in fibreless geopolymer samples were between 49% and 84%, but the rate of flexural strength losses in polypropylene fibrous samples was lower, ranging from 43.91% to 84.60%. Both flexural strength and toughness may be significantly improved by including fibres into cement or geopolymer mortar. It has been established that the addition of polymer fibres to a geopolymer composite may significantly increase both the strength and toughness of the composite.83–86 Various polymer fibres are common kinds of materials that are used to reinforce the geopolymer matrix.
Visual inspection
Concrete cubes that were heated in a muffle furnace for 2 h at a higher temperature were subjected to a visual evaluation to determine the outcome of the experiment. The cube GPC specimens are shown in Figure 8 after being subjected to elevated temperatures ranging from 100°C to 800°C. This demonstrates that the GPC specimens fail at temperatures higher than 800°C.87–91 Figure 9 shows the geopolymer matrix powder after being subjected to exposed elevated temperatures. This illustration demonstrates that the geopolymer matrix becomes darker after being subjected to higher exposure temperatures. As a result of the evaporation of hygroscopic water contained in the GPC matrix, cracks appear when the exposure temperature is raised over a certain point.

Picture of high temperature exposed cubes: (a) 100°C, (b) 200°C, (c) 300°C, (d) 400°C, (e) 500°C, (f) 600°C, (g) 700°C and (h) 800°C.

Powder geopolymer matrix picture after elevated temperature exposure from 100°C to 800°C.
Microstructural analysis
The XRD and TGA-DTG analyses were tested on the GPC sample after elevated temperatures for microstructural analysis.
XRD analysis
The XRD analysis checks the intensity of mineral oxides in the sample as per ASTM C1365–18. It shows the crystalline behaviour of the mineral particles present in the sample. The XRD tests were conducted after elevated exposure of the GPC samples from 100°C to 800°C. Figure 10(a) shows the XRD graphs of the GPC specimens, which show that the quartz and cristobalite peaks are reduced with the increment of elevated temperature exposure. The quartz and cristobalite are silica content, but changes in their shapes, where quartz is hexagonal and cristobalite is tetragonal in shape. The other components show a negligible presence in the crystalline peaks. Most silica contents are present in the GPC paste matrix, which shows the higher thermal stability of the GPC samples to elevated temperatures. The XRD graph shows the mostly amorphous nature of the geopolymer paste. After the XRD analysis, it could be concluded that the GPC matrix is highly stable to the elevated. It would change the mineral oxide’s shape or structure only but not the chemical bonds. The geopolymer bonds are highly stable up to 800°C.92–97

(a) XRD graph after elevated temperature, (b) thermogravimetric analysis graph of the GPC and (c) DTG graph of the GPC.
Because of all of these reasons, the number of pores in synthetic geopolymers was significantly reduced. The acceleration of pore volume reduction and water loss in the geopolymer as a result of evaporation and dihydroxylation that occurs during a thermal assault can lead to the formation of structural faults or the expansion of existing faults. These processes can also contribute to the loss of strength that occurs after a thermal assault. Additionally, the production of new crystal phases as a consequence of uncontrolled diffusion is the reason of the observed loss in sample strength. These new crystal phases produced the observed loss in sample strength. In spite of this, as shown by XRD, the fundamental structure of traditional metakaolin-based geopolymers was preserved, and the geopolymer materials revealed reduced microstructural degeneration at increasing temperatures, which resulted in less strength loss.
Thermogravimetric analysis
The TGA test is used to find the stability of samples to elevated temperatures. It works based on the weight of the sample continuously with an increment of the temperature at the rate of 10°C/min. Figure 10(b) shows the TGA (thermogravimetric analysis) graph of the GPC samples exposed to elevated temperatures. The GPC samples were exposed to elevated temperatures from 100°C to 800°C at intervals of 100°C for 1 h. The 100°C exposed GPC samples show less thermal stability than all other elevated temperature exposed specimens. The thermal stability of the GPC specimens increases with the elevated temperature. The GPC specimens exposed to the elevated didn’t show linear behaviour; they varied randomly. The 100°C exposed specimens show a mass loss of around 10%–11%, whereas, after 600°C, exposed specimens show a negligible mass loss of around 1%–2%. After the experimental analysis, it could be concluded that the GPC matrix is highly stable up to 800°C because it retains more than 90% mass up to 800°C.
The weight loss of GPC samples in the TGA test due to the evaporation of water absorbed water in the matrix from 25°C to 225°C. 98 This could be due to the nano clay filling the space and resulting in denser matrices. The physical free water would evaporate between 225°C and 525°C, the rate of evaporation or water loss would be slow for all specimens. It is possible that the de-hydroxylation of the silicon hydroxyl group is to blame for the constant weight loss of the silicon oxygen group as well as the water that has evaporated. The inadequate weight reduction that occurred between 500°C and 700°C was caused by the excessive amount of coal and fly ash that was burned.99–101 This may be seen in DTG curves over 600°C, when a little bump indicates a slight change in weight loss.102,103
The DTG analysis shows the regularity or linearity of the stability of the material against the temperature elevation. It clearly shows the negative or positive loss of the sample’s mass. Figure 10(c) shows the DTG graph of the GPC samples that were exposed to various elevated temperatures. All GPC samples after the elevated temperature exposure show a similar pattern. The graph shows that the initiative goes positive and after going negative side randomly, describes its gain initially and loss mass randomly after gaining. The mass loss rate increases up to around 160°C–180°C, and the mass-loss rate decreases continuously in all types of specimens.
Validation of experimental values with the proposed model
A model was developed to calculate the compressive strength variation with exposure to fire or elevated temperatures for the OPC concrete specimens. 104 Equation (1) shows the effect of fire temperature exposure on concrete specimens in terms of strength.


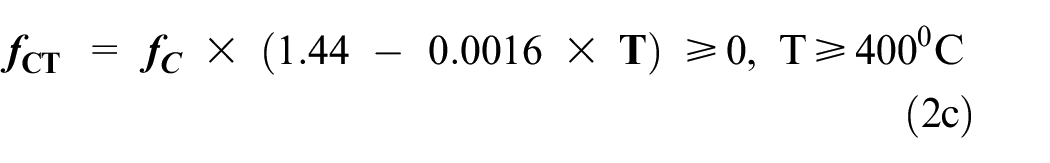
Eurocode recommended equation (2) for demonstrating the effect of fire on reinforced concrete members. 105 Equations (2a)–(2c) describes the correlation between compressive strength and elevated temperature variation.


Equation (3) was developed for reinforced concrete elements exposed to elevated temperatures, 106 and it was also considered by Zha (2003) 107 to create a nonlinear finite element programme to calculate the resistivity of the concrete element against elevated temperatures.

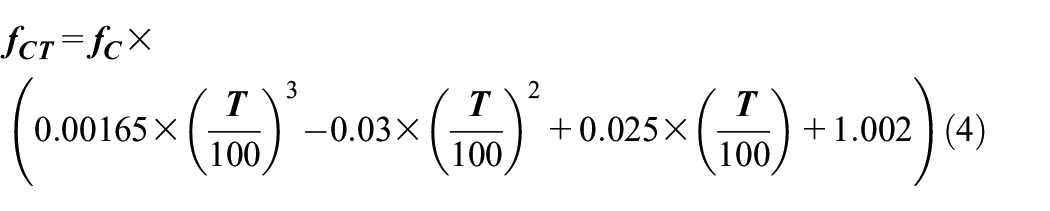
A correlation was developed in terms of equation (4) between stress-strain constitutive equations at higher temperatures. 108
where
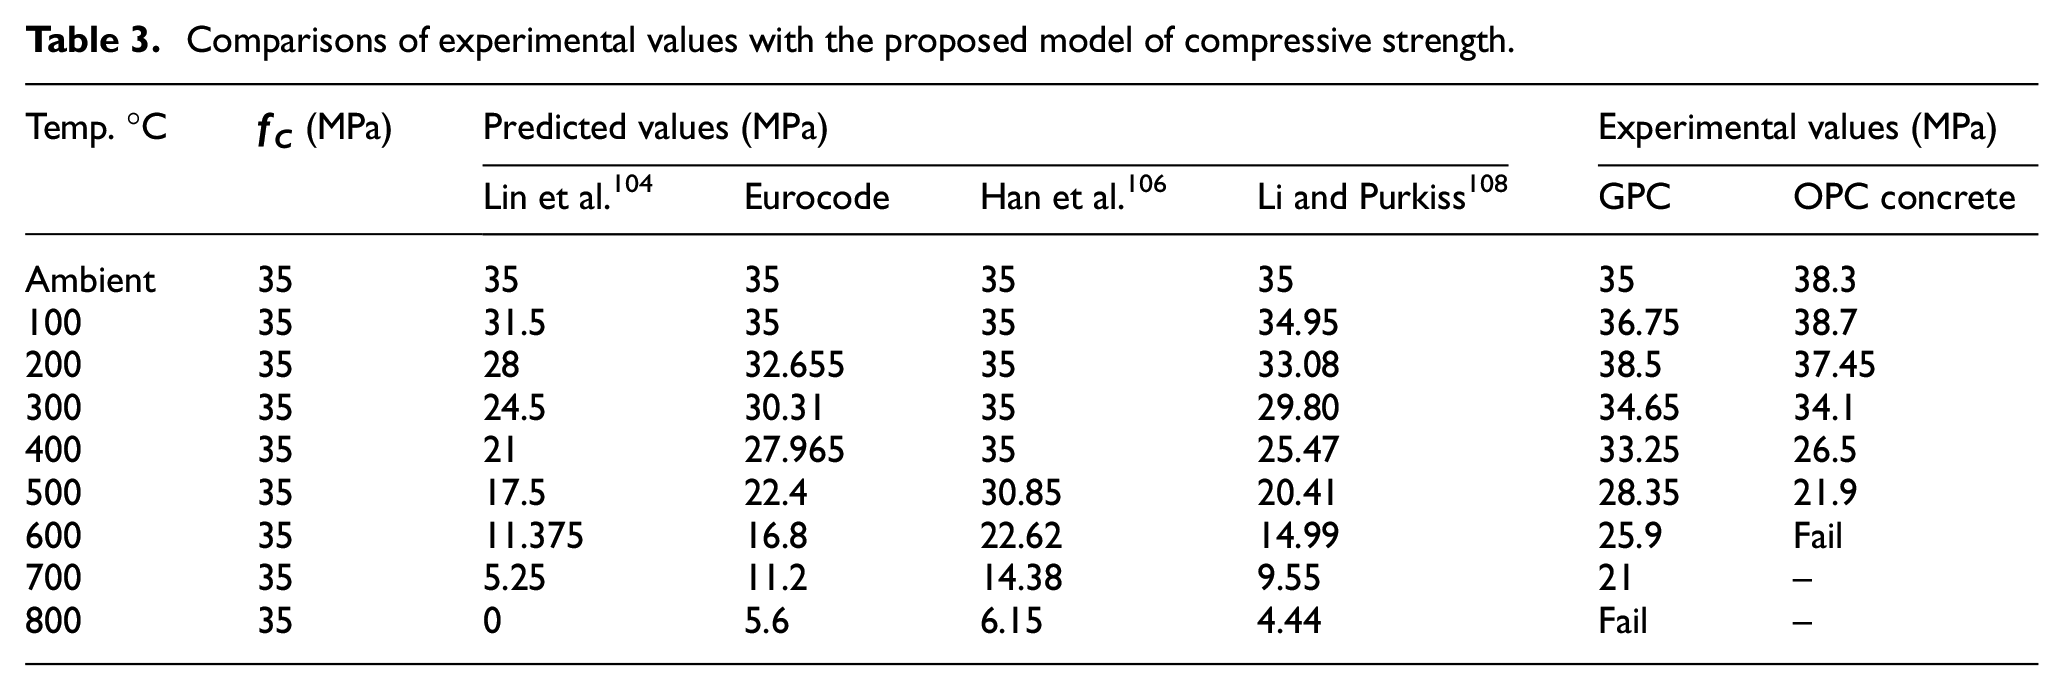
Table 3 shows the comparison between equations (1)–(4) and the experimental results. It describes the effects of elevated temperatures on both types of concrete tested in the laboratory and discusses the equations given by various codes or authors. This table describes the strength values as per the author’s and euro code equations and validates them with the value of the experimental results. Conventional concrete sample degradation is somehow similar to the author’s model equation, but the GPC results didn’t match the given models.
Comparisons of experimental values with the proposed model of compressive strength.
Conclusion
In the experimental investigation in the laboratory, the GPC and OPC concrete samples were exhibited at elevated temperatures to analyse the mass loss and strength loss of the specimens. In microstructural analysis, check the XRD, TGA and DTG of the exposed GPC specimens. Based on the experimental investigation, the following conclusion is reached:
The fact that the weight loss of both concrete samples increased after being subjected to a variety of elevated temperatures ranging from 100°C to 800°C reveals that the mass loss of both concrete samples increases as the temperatures climbs. The OPC concrete specimens collapse at a temperature of 600°C, whereas the GPC specimens collapse after being exposed to a temperature of 800°C in a muffle furnace for a period of 2 h. In the case of GPC specimens, the mass loss before failure was around 12% of the total, but in the case of standard concrete samples, the mass loss before failure was approximately 7%. It may be deduced from this that the GPC samples are less prone to deformation at higher temperatures. After being subjected to a temperature of 700°C, the GPC samples were maintained 60% of their strength, whereas the OPC concrete specimens kept 52% of their compressive strength after being subjected to a temperature of 500°C. As a direct consequence of this, GPC specimens demonstrate a higher level of tolerance to high temperatures.
The peaks of quartz and cristobalite are reduced with the increment of elevated temperature exposure. The quartz and cristobalite are silica content, but changes in their shapes, where quartz is hexagonal and cristobalite is tetragonal in shape. The other components show a negligible presence in the crystalline peaks. Most silica contents are present in the GPC paste matrix, which shows the higher thermal stability of the GPC samples to elevated temperatures. The 100°C exposed GPC samples show less thermal stability than all other elevated temperature exposed specimens. The thermal stability of the GPC specimens increases with the elevated temperature. Geopolymer bonds did not need water in the end product of the reaction or geopolymerisation to develop hardening. The GPC specimens are higher stable to thermal attack than the ordinary concrete due to the presence of maximum micropores in the geopolymer matrix, whereas the OPC matrix has mesopores at a large amount.
Footnotes
Handling Editor: Chenhui Liang
Author contribution
All authors have participated in (a) conception and design, or analysis and interpretation of the data; (b) drafting the article or revising it critically for valuable intellectual content; and (c) approval of the final version.
Declaration of conflicting interests
The author(s) declared no potential conflicts of interest with respect to the research, authorship, and/or publication of this article.
Funding
The author(s) disclosed receipt of the following financial support for the research, authorship, and/or publication of this article: This work is supported by the Civil Engineering Department, GLA University, Mathura, Uttar Pradesh, India.
Compliance with ethical standard
This manuscript has not been submitted to, nor is under review at, another journal or other publishing venue.
Consent to participate
As a corresponding author or on behalf of all authors of the research paper, I consent to participate.
Consent to publication
All author of the research paper consent to the publication.
Data availability
Data would be available on request.