
Abstract
Under the action of the seismic waves, reinforced concrete shear walls (RC shear walls) often exhibit hysteresis characteristics such as strength and stiffness degradation, and pinching effects due to factors such as slippage, cumulative damage of concrete, and non-uniform corrosion of steel bars or reinforcements. The hysteresis curve is asymmetric. In this paper, a nonlinear restoring force mechanical model, based on the Bouc-Wen-Baber-Noori (BWBN) model, that can describe the hysteresis characteristics of the RC shear wall is obtained by introducing the asymmetry factor. Particular attention is the solution of equation that the hysteretic energy ε at different loading stages in this model is regarded as parameters to be identified. The ordinary differential equations for parameter identification are derived into four segments. The improved particle swarm organization (IPSO) algorithm is used for parameters identification, which superiority is verified by comparison to the genetic algorithm. The accuracy of this model is verified by using RC shear wall finite element simulation data.
Keywords
Introduction
RC shear walls have obvious asymmetric hysteresis characteristics due to variable axial force loading, reinforcement, non-uniform corrosion of steel bars, and other factors. 1 Affected by factors such as the slip between steel and concrete, concrete damage, RC shear walls always exhibit obvious hysteresis characteristics such as degradation in strength and stiffness, and pinching effects under the action of seismic waves. 2 Therefore, the establishment of an inelastic restoring force mechanical model that can effectively consider the typical hysteretic characteristics should be the basis for the seismic dynamic response analysis of RC shear walls.
The restoring force model of RC shear wall mainly includes the ideal elastoplastic model, the bilinear model, the clough model, and the Bouc-Wen-Baber-Noori (BWBN) model. 3 Among these models, the BWBN model is widely used because it belongs to the smooth curve model, which can well describe the hysteretic characteristics such as strength and stiffness degradation, and pinching effect. 4 Bouc5,6 proposed a smooth hysteretic model for the analysis of the inelastic dynamic response of a single degree of freedom system. Wen 7 improved the Bouc model by equivalent linearization technology, and proposed a smooth curve model, called the Bouc-Wen model for structural random vibration analysis. Subsequently, Baber and Wen 8 and Baber and Noori 9 defined the stiffness and strength degradation parameters through the cumulative hysteretic energy criterion, which improved the Bouc-Wen model and applied it to the analysis of the inelastic dynamic response of a single degree of freedom system. In addition, the pinch-up effect function was further introduced, resulting in a smooth curve model that can comprehensively consider the hysteresis characteristics of strength and stiffness degradation, and pinch-up effect. In the differential relationship between relative lateral displacement and hysteresis displacement, Kwok et al. 10 corrected the velocity term by introducing adjustment coefficients, and proposed an asymmetric Bouc-Wen model suitable for hysteresis damper. Similarly, Zhu and Wang 11 corrected the differential relationship between relative lateral displacement and hysteretic displacement by introducing correction terms related to adjustment coefficients, displacement magnitude, and speed direction, and thus proposed an asymmetric Bouc-Wen model, which is suitable for describing the hysteresis characteristics of piezoelectric ceramics. Wang and Wen 12 corrected the differential relationship between the relative lateral displacement and the hysteretic displacement by introducing correction terms related to the adjustment coefficient, the direction of the hysteretic displacement and the direction of velocity, and proposed an asymmetrical Bouc-Wen model suitable for steel structures. Song and Der Kiureghian 13 corrected the differential relationship between relative lateral displacement and hysteretic displacement by introducing six adjustment coefficients related to the direction of displacement, hysteretic displacement and speed, and proposed an asymmetric Bouc-Wen model which could depict the hysteretic characteristic of flexible connector for substations. Pain et al. 14 proposed a calibration scheme for a generalized Bouc-Wen model to capture the asymmetric behavior of soil at the high cyclic shear strain. The degradation parameters and pore–water pressure are expressed as a function of dissipated hysteretic energy. Besides, this model is also applied to structures that usually occur under significant cyclic excitation (e.g. earthquake, wind, or sea wave).15–17 For example, Lukassen et al. 18 proposed a method to calculate deformation characteristics and hysteresis effects of tensile armored steel wire in marine flexible pipes under tensile and bending loads, and studied the effects of cyclic bending loads on laying angles and friction coefficients of different tensile armored layers. The results show that the steel wire will gradually move to the compression side of the bending surface under the combined action of tension and cyclic bending. Although the above model can consider the influence of asymmetric characteristics to a certain extent, it cannot involve the influence of accumulated damage on the degradation effect. There is a need for a restoring force model of RC shear walls under the action of seismic waves that can effectively consider the strength and stiffness degradation, pinching effect, and asymmetric hysteresis characteristics.
Regarding the parameter identification of the model, because of the high nonlinearity involved in the model, parameter identification of hysteretic model represented by Bouc-Wen model is a difficult task. Up to now, the deterministic identification techniques used for nonlinear applications include least squares estimation (LSE),19–21 extended Kalman filter (EKF), 21 Bayes algorithm, 22 etc. Compared with the above deterministic algorithm, the stochastic algorithm usually converges to the global minimum more easily. By defining the fitness function of the hysteresis model, Zhang and Xia 23 and Zhao et al. 24 proposed an improved particle swarm optimization algorithm for parameter identification of nonlinear dynamic hysteresis model, which improved the global search ability and avoided the precocious convergence of traditional particle swarm optimization algorithms. The Leishman-Beddoe dynamic stall model of rotor blade and the elastic displacement field model of elastomer damper are applied. Pain et al. 14 expressed degradation parameters and pore water pressure as functions of dissipated energy, and used particle swarm optimization algorithm to identify parameters of the asymmetric Bouc-Wen model of sandstone. The adjusted model can successfully describe the stiffness degradation, strength degradation, excess pore water pressure, and asymmetric behavior of saturated sandstone and siltstone under high cyclic shear strain. Manikantan et al. 25 proposed a non-random algorithm for identifying parameters of Bouc-Wen model, namely homotopy algorithm, in order to solve the shortcomings of random methods such as simulated annealing and genetic algorithm, which have high computational cost and are not easy to converge to the global minimum. Numerical results verified the advantages of homotopy method in terms of computation amount and convergence efficiency.
In this paper, an inelastic restoring force model was established based on the BWBN model, which is effective is considering strength and stiffness degradation, pinching effects, and asymmetric hysteresis characteristics. This was done by introducing shape control parameters describing the asymmetric hysteresis properties in the first-order ordinary differential equations of hysteretic displacement and lateral displacement. The improved particle swarm optimization (IPSO) and genetic algorithm (GA) were used to identify the parameters of the model and compare the performance of the algorithms. Concurrently, the finite element simulation data of the pseudo-static loading of the RC shear wall is used to verify the accuracy of the inelastic restoring force model introduced this paper.
Asymmetric BWBN model of RC shear wall
Affected by factors such as concrete damage, cracking, and steel slippage, RC shear walls usually exhibit obvious hysteretic characteristics such as strength degradation, stiffness degradation, and pinching effects under strong earthquakes.1,2 Based on the BWBN model, 26 the inelastic restoring force of the RC column can be described as:

where R(x, z) is the inelastic restoring force; k0 is the initial linear elastic stiffness; α is the ratio of stiffness after yielding to stiffness before yielding; x is the lateral displacement, and; z is the hysteretic displacement.
Due to variable axial force loading, asymmetric cross-section or reinforcement, and uneven corrosion of steel bars, the hysteresis curve of the RC shear wall shows obvious asymmetry. The aforementioned restoring force-displacement hysteresis curve is symmetrical about the origin. Therefore, it is difficult to describe the asymmetric hysteresis characteristics of RC shear walls. In view of this, a shape control parameter, τ, describing the asymmetric characteristics is introduced into the traditional BWBN model, and the relationship of derivative of time between the relative lateral displacement, x, and the hysteretic displacement, z, is:


where, β, γ, and n are the shape parameters of the hysteresis curve; η and ν are the stiffness and strength degradation parameters respectively; δη and δν are the stiffness and strength degradation rate respectively; sign(

By dividing both sides of equation (2) by

Parameter identification of the asymmetric BWBN model
Objective function
To identify the parameters of the asymmetric BWBN restoring force model, the goal is to find a set of model parameter vectors
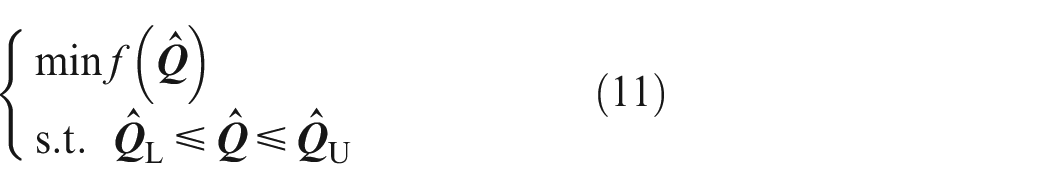
where,
where, N is the number of loading steps; R(ti) is the finite element simulation data of the RC shear wall at step ti; R(ti|

When

When

When

When

To facilitate the solution, the hysteretic energy consumption of each stage is set as the parameter to be identified, namely εi (i = 1, 2, 3, 4). Therefore, the original asymmetric BWBN model is transformed into a system of ordinary differential equations without an integral. The fitness function can be solved numerically using the fourth-order Runge-Kutta method.
The asymmetric BWBN model has 18 model parameters, including five shape parameters (k0, α, β, γ, τ, and n), two degradation parameters (δη and δν), six pinching effect parameters (ζs, p, q, ψ, δψ, and λ), and four hysteretic energy dissipation parameters, εi (i = 1, 2, 3, 4). Although these model parameters have clear physical meanings, they lack quantitative calculation formulas except for hysteretic energy consumption. 27 Therefore, it is necessary to identify the parameters of the asymmetric BWBN model based on the pseudo-static reciprocating load that comes from finite element simulation of the RC shear wall.
Improved particle swarm optimization algorithm
Particle Swarm Optimization (PSO) is a new evolutionary algorithm. The algorithm starts from a random solution and changes the historical movement state information of itself and the group through mutual cooperation and information sharing between particles, so as to achieve the purpose of gradually increasing the chance of discovery of better solutions during the solution process. PSO retains the same global search strategy and parallel processing of population as the genetic algorithm, but adopts a velocity position model that is simple to operate, which avoids crossover and mutation operations. The particles follow the optimal particles in the solution space to search the global optimal solution. This algorithm has the characteristics of easy implementation, high precision, and rapid convergence, which has been widely used in application fields such as function optimization, system identification, and fuzzy control.23,28–31
During the flight of the particle, the velocity vi determines the direction and position of the particle. The speed of the particle is continuously updated by the two optimal values of the local optimal solution: Pi found by the particle itself, and the global optimal solution Pg found by the entire population. The updated formula of particle velocity and position is as follows:


where, vi is the velocity of the particle; ω is the inertia weighting factor; Pi is the optimal value of the individual; Pg is the optimal value of the group; xi is the current particle position; rand is a random function, between (0, 1), and; c1and c2 are learning factors.
The global convergence of the algorithm is affected by the flight speed of a single particle. The function ω·vi(t) can be understood as the previous velocity or inertia of the particle. The function c1·rand1(pi(t)-xi(t)) can be explained as the cognitive behavior of particles, representing the information sharing and mutual cooperation between particles. Throughout the solution process, the inertia weight ω, acceleration factors c1 and c2, and the maximum velocity vmax jointly maintain the balance of the particle’s global and local search capabilities.
Due to the large number of parameters to be identified, the solution space is complicated. In order to improve calculation efficiency, the standard particle swarm algorithm is improved by the method of linearly decreasing the inertia weight factor (IPSO). The linearly decreasing weight method can be expressed as 23 :

where, wmax is the maximum inertia weight; wmin is the minimum inertia weight; run is the current iteration number; and runmax is the total number of algorithm iterations.
A larger w has better global convergence ability, and a smaller w has stronger local convergence ability. Therefore, as the number of iterations increases, the inertia weight w should continue to decrease, so that the particle swarm algorithm has a strong global search ability in the early stage, and a strong local convergence ability in the late stage.
The steps of the algorithm are as follows:
Step 1: Initialize the population size n, the maximum number of iterations tmax, the maximum velocity vmax, the inertia weight ω, the initial particle position x, the velocity v, and other parameters. Set the initial position as the optimal position Pi experienced by each particle in the current situation, and the global optimal position of the current particle swarm as the initial Pg.
Step 2: Calculate the fitness value of each particle. Store and compare the usage value corresponding to the optimal position of each particle. Select the position of the particle with the best fitness in the entire population as the optimal position Pg of the current population.
Step 3: After the calculation of the inertia weight factor is completed in a linearly decreasing mode, the position and speed of the particles in the current population are updated according to the updated formula of the particle speed and position.
Step 4: Calculate the fitness of each particle after the position is updated and compare the fitness of the updated particle with the fitness of all the best positions that are previously updated. If the updated fitness is better, update the current particle position as the optimal position Pi of the particle.
Step 5: The fitness of each particle after the update is compared with the fitness corresponding to the best position Pg experienced by all particles. If the fitness of the current particle position is better, the value of Pg is updated.
Step 6: Judge whether the termination condition is met. If the termination condition has been met, the iterative calculation is stopped and the optimal solution is output. If the termination conditions are not met, return to Step 3 to continue the iterative calculation.
The IPSO algorithm process is shown in the Figure 1.

Improved PSO algorithm.
Finite element simulation
Many scholars obtain experimental data through pseudo-static reciprocating loading tests of RC columns or RC shear walls.32,33 However, the cost of testing is relatively high. Based on testing and numerical calculation techniques, a numerical calculation model for RC shear walls can be established,34–36 as shown in Figure 2. The wall size is 1400 mm × 160 mm × 2800 mm, with 200 mm × 160 mm × 2800 mm post-cast concealed columns on both sides of the wall. The compressive strength of the concrete cube is 43.1 MPa, the density is 2500 kg/m3, the modulus of elasticity is 3.15 × 10⁴ MPa, and the Poisson’s ratio is 0.2. The concealed column is provided by 4 HRB335 longitudinal steel bars, with a diameter of 16 mm, and HPB300 stirrups, with a diameter of 8 mm and a spacing of 150 mm. The HPB300 steel bars were installed with a spacing of 200 mm and a diameter of 8 mm in the horizontal and vertical directions of the wall, respectively. The density of the steel bar is 7.85g/cm3, with a modulus of elasticity of 2 × 10⁵ MPa, and a Poisson’s ratio of 0.2. The plastic mechanical properties of the steel bars used in this study are presented in Table 1.

Reinforced concrete shear wall.
The plastic mechanical properties of the steel bars used in this study.

The load axial compression of concrete ratio is 0.15. Horizontal load is applied reciprocally, using force-displacement mixed-control loading. The first five levels (50, 100, 150, 200, 300 kN) are load-controlled and each level is cyclically loaded once. This is followed by displacement-controlled loading, with magnitudes of 8, 16, 24, 32, 40, 50, and 60 mm, of which each 16, 32, and 40 mm load cycle is cycled twice, for a total of 11 cycles. The force-controlled loading is equivalently converted into displacement-controlled loading, for a total of 16 loading cycles, as shown in the Figure 3.
Loading method.
Due to the non-linear contact between the steel bar and the concrete, the C3D8R solid element is used for the shear wall and the T3D2 truss element is used for the steel bar. The plastic damage model is adopted to the concrete. The relationship between compression and tensile yield stress and strain is shown in Figure 4. The mechanical properties of the steel bars adopt an ideal elastoplastic model.

Plastic damage model of concrete.
When the loading displacement is too large, the concrete and steel bars in the shear wall will slip. If the contact relationship is set, the calculation amount will be difficult to converge. Therefore, the ABAQUS subroutine should be used to set up the clough rebar model which depicts the hysteresis characteristic of RC walls and so on to weaken its unloading stiffness and achieve the effect of sliding equivalent. Using the static implicit algorithm, the hysteretic curve of the RC shear wall is calculated and shown in the Figure 5.

Hysteresis curve of RC shear wall.
Verification and discussion
Algorithm optimization
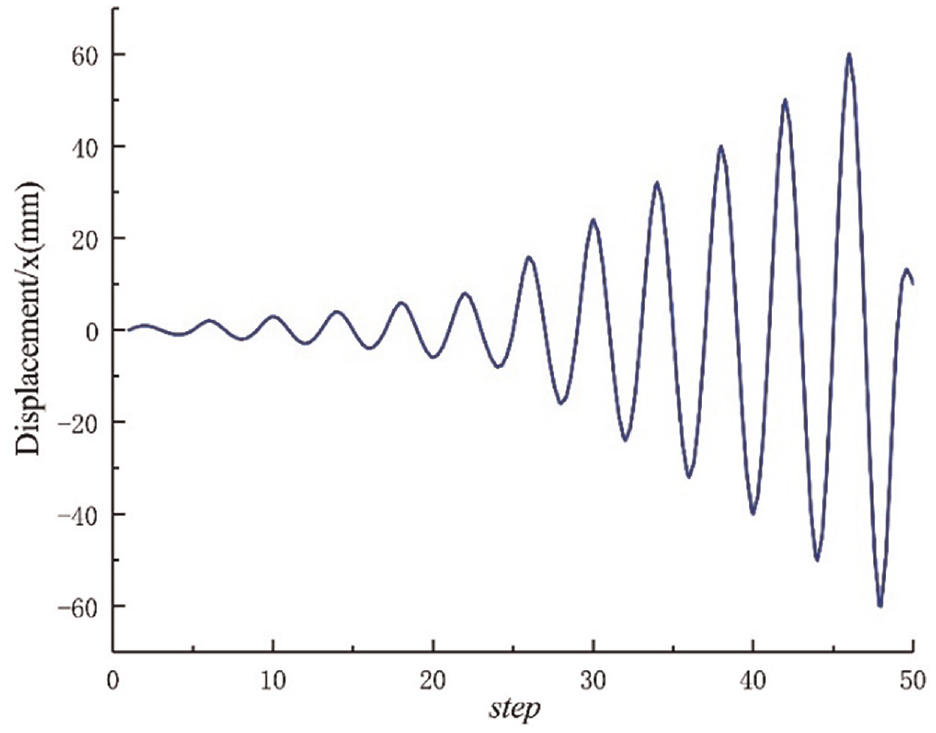
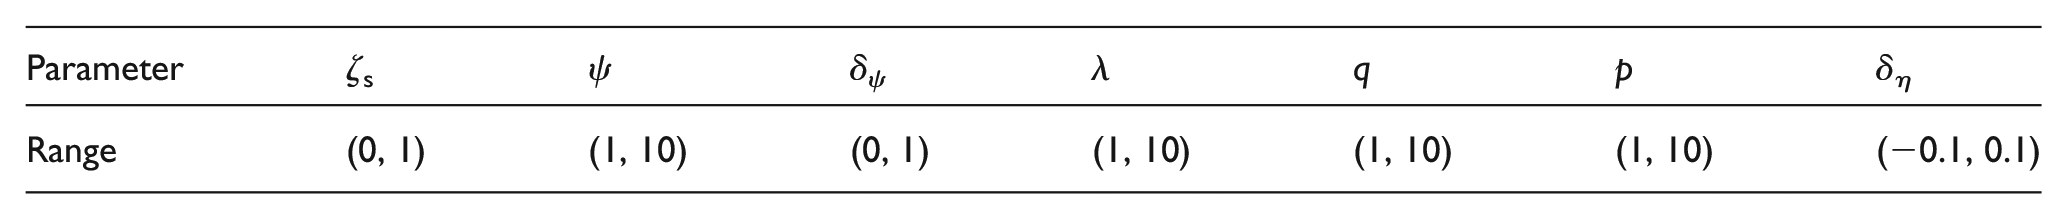
In order to verify the superiority of the improved PSO algorithm, the genetic algorithm37,38 was used for comparison. The data of the first and last loading cycles in the finite element simulation were selected for calculation. The population numbers of GA and IPSO algorithm were both set to 180. According to previous experience of several trial calculations, the parameter range setting is shown in Table 2.
Range of parameters to be identified.
The fitness function values after iterative convergence are presented in Table 3. It can be seen from the table that whether it is the first load cycle or the last load cycle. The fitness function value of IPSO algorithm is smaller than that of GA, meaning the IPSO algorithm obtains higher accuracy.
Fitness function values.

Figure 6 shows the change rule of the fitness function value and the number of iterations for the first (a) and last (b) loading cycles. It can be seen from Figure 6(a) and (b) that the fitness function value of IPSO algorithm is much larger than the fitness value of GA at a high probability at the beginning. This is because IPSO algorithm starts from a random solution, and GA requires an initial solution. As a result, when convergence is reached, the number of iterations of IPSO algorithm is greater than that of GA. However, the IPSO algorithm does not require crossover and mutation operations, so the total iteration time of IPSO algorithm (289 s) is less than that of GA (572 s).
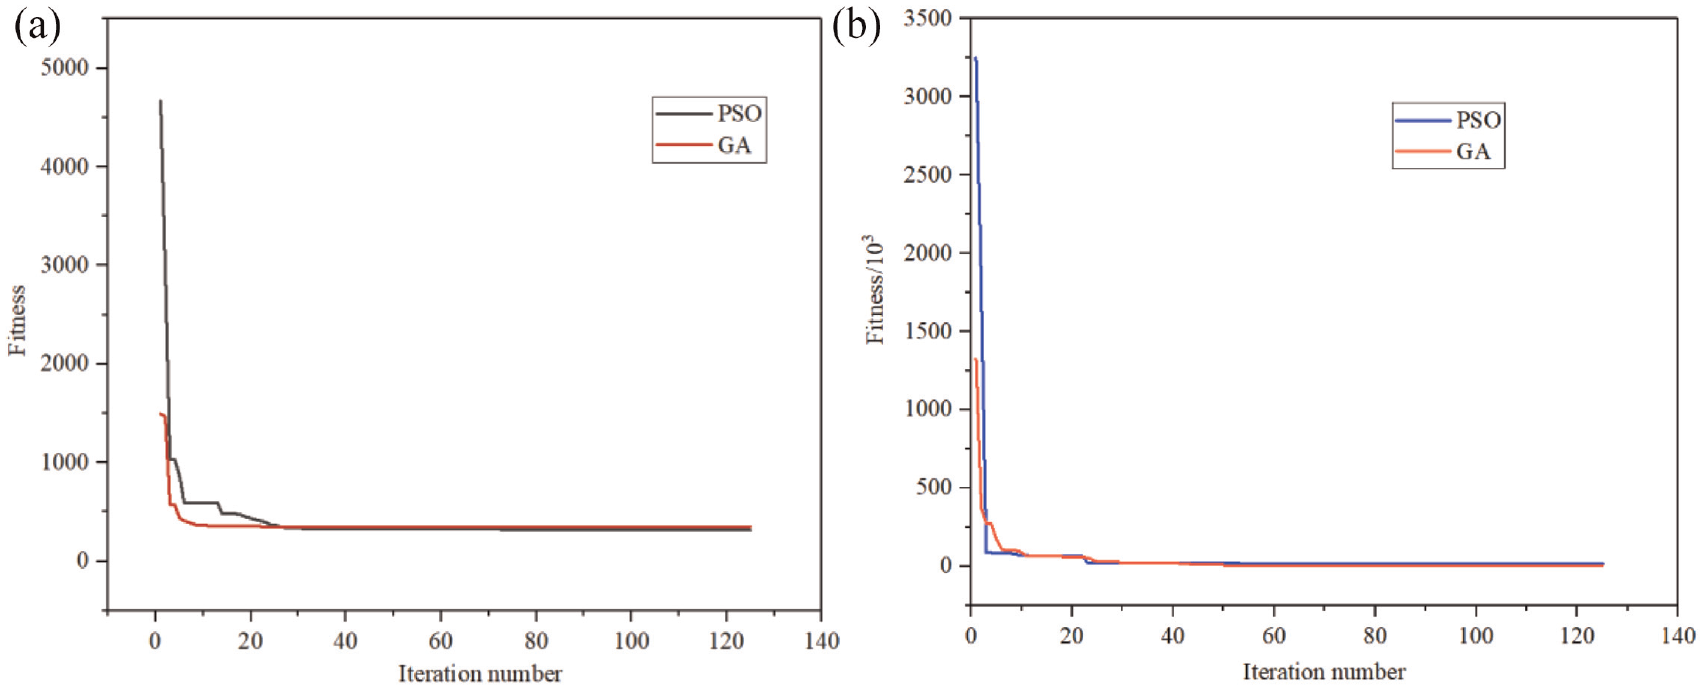
Convergence process of the fitness value of PSO and GA.
Table 4 and Figure 7 show the convergence value of each identified parameter and the iteration process under the last loading cycle with IPSO algorithm, respectively. It should be noted that k0, ε1, ε2, β, γ, and δψ are all at the boundary of the corresponding parameter range, indicating that there is a certain error when the parameter boundary is initially given. Therefore, the optimal parameter range can be determined through multiple trial calculations to further improve the calculation accuracy.
Parameter values at convergence.


Convergence process of each parameter value of PSO.
Model accuracy verification
Based on the finite element simulation data, the accuracy of the asymmetric restoring force model in this paper was verified. As shown in Figure 8, the comparison of hysteresis loops between simulation and asymmetric restoring force model in different loading circulations. It can be seen from Figure 8(a) and (b) that the restoring force model described in this article coincides better with the finite element simulation data. In particular, in the unloading stage, the hysteresis curve based on the PSO algorithm almost coincides with the hysteresis curve of the finite element simulation, indicating that PSO algorithm can more effectively identify the parameters describing the pinch effect and curve asymmetry.

Comparison of hysteresis loops between simulation and asymmetric restoring force model in different loading circulations.
Conclusions
(1) Under the action of the seismic waves, reinforced concrete shear walls (RC shear walls) often exhibit hysteresis characteristics such as strength and stiffness degradation, and pinching effects due to factors such as slippage, cumulative damage of concrete, and non-uniform corrosion of steel bars or reinforcements. Based on the Bouc-Wen-Baber-Noori (BWBN) model, by introducing the asymmetry factor, the asymmetric restoring force model is described in this article to depict the hysteresis characteristics of RC walls. In particular, we propose a different solution, that is, the hysteretic energy ε in this model is regarded as a parameter to be identified, which simplifies the solution of differential equations and solving the equation by splitting it into four sections.
(2) The method of decreasing inertia weight is used to improve the PSO algorithm (IPSO) which is used for the parameter identification of the asymmetric restoring force model. By comparing with the finite element simulation data, the model can describe the hysteresis characteristics of the RC shear wall under lateral load. At the same time, the GA is compared to verify the superiority of the IPSO algorithm in terms of calculation accuracy and speed. However, the parameters obtained by IPSO algorithm are more accurate in describing the hysteretic characteristics of RC shear walls.
Footnotes
Handling Editor: Chenhui Liang
Declaration of conflicting interests
The author(s) declared no potential conflicts of interest with respect to the research, authorship, and/or publication of this article.
Funding
The author(s) disclosed receipt of the following financial support for the research, authorship, and/or publication of this article: The authors thank for the project support of “(Sichuan university-Luzhou) Innovation Mode, Key Technologies and Application Demonstration of High-performance Intelligent Electro-hydraulic Products.”