
Abstract
This paper proposes a new approach to model and analyze erect posture, based on a spherical inverted pendulum which is used to mimic the body posture. The pendulum oscillates in two directions,
Keywords
Introduction
In humans, quiet standing is a complex function dominated by the central nervous system in which descending signals from visual, vestibular, and somatosensory systems are used to ensure equilibrium. This function is an involuntary physiological adjustment mechanism in which a deficit in the upcoming signals may cause a serious injury. Moreover, some neuromuscular disorders such as Parkinson’s and cerebral palsy in children can impact balance.
Models of balance control can thus contribute in the assessment of the equilibrium condition, joint prostheses design, and clinical kinesiology research.1,2 These models employ the trajectory of the body center of pressure (CoP) to keep the body center of mass (CoM) in the base of support. The CoP oscillates in a sagittal plane, anterior/posterior (A/P), and frontal plane, medial/lateral (M/L). According to,1,3,4 A/P oscillation is mostly controlled via a torque exerted in the subtalar joint, which is generated by the plantar/dorsiflexor muscle arrangement, while M/L oscillation is produced due to the load/unload mechanism of the hip.5–7
CoP oscillations can be recorded via foot pressure mapping and return a stabilometric diagram which is the sway path of the CoP. This diagram is useful when diagnosing balance disorders.8–10 However, due to the rather chaotic shape of the diagram, it requires further processing to extract diagnosis features for use in the clinical assessment of the quiet stance.
In this work, we investigated a biomechanical model for estimating ankle joint torques using stabilometric data. The model is based on a spherical inverted pendulum where the motion of CoP is assumed to take place in two spherical coordinates,
Our model differs from previous models, which use a simple inverted pendulum to identify the trajectory of the CoP as a single degree of freedom (DOF), and moves in sagittal or frontal planes. We assumed that the lateral motion occurs in the ankle joint, and is related to A/P motion in which the torque in direction
To the best of our knowledge, our model is the first to combine A/P and L/M movements as a control model of the erect posture. We believe it will assist researchers in developing simplified control algorithms for quiet standing.
In the literature on modeling human postural sway, a single DOF inverted pendulum (IP) has frequently been proposed to evaluate quiet standing posture6,7,11,12 and has been used as a control model for human postural regulation.13–15 Other works, such as, 11 used motions in sagittal and coronal planes and fed them in the proposed control scheme for postural stability evaluation. Modeling of the quiet postural motion in the frontal plane was considered in, 3 where the authors propose, in a quiet-stance postural sway, to control the M/L motion by the inverted/everted subtalar joint. This assumption is in line with our proposed model. However, in, 7 frontal plane motion was modeled as three links, in which two of these links were parallel, while the third link demonstrated the body. The parallel links were connected with hinges and supported on the floor. A similar model was introduced in, 16 in which the proposed models were used to analyze human balance on a rolling board. Unlike our proposal, these models did not consider the relation between the motions occurring in sagittal and frontal planes, but dealt with each motion separately.
Static posturography is the study of body sway in an upright posture. This is usually carried out by placing the subject of a force-plate device that can sense tiny oscillations of the CoP of the body in both A/P and L/M directions.17–19 The device measures two time series of oscillations which can be post-processed to evaluate the status of the body sway. Oscillations of CoP can be combined in a statokinesigram graph, which is the trajectory of the CoP. The force pressure platform is an alternative device for obtaining this trajectory since it depends on the plantar pressure distributions of both feet and then estimates the precise location of body CoP.20–22 We used a plantar pressure mapping platform to acquire the body CoP in both A/P and M/L directions.
Estimating postural ankle torque entails a quantitative approach, which is vital in the assessment of the quiet stance in humans.23,24 This torque needs to be modulated frequently in order to preserve stability in response to internal and external perturbations. 25 According to,25,26 the ankle torque consists of two components: intrinsic torque and active torque. The intrinsic torque is caused by joint mechanical resistance to its movements, while the second torque is produced due to changes in muscle activation.
Recent approaches to estimate the joint torque fall into two groups. The first is based on motion capture systems and pressure, or force platforms to measure the complete dynamics of the human body. It then uses the acquired data in kinematic chain models to estimate the intrinsic body forces and movements. The second approach employs joint kinematics and ground reaction forces. This latter approach abandons the inertial properties of the body segments in favor of symbolizing the subject as a single mass point.24,27 In our work, in order to simplify and reduce the computation, we estimated the ankle joint torques following the second approach.
The rest of the paper is organized as follows. Section 2 presents the mathematical description of the proposed model. In addition, the instrument used, the subjects recruited, and the protocols tested are illustrated. Sections 3 and 4 present the results and discussion. Finally, the conclusions are drawn in Section 5.
Methodology
Our approach to modeling erect stance is based on using an inverted spherical pendulum to mimic human posture. It involves mass movements on a spherical surface. This spherical motion is described by spherical coordinates

where
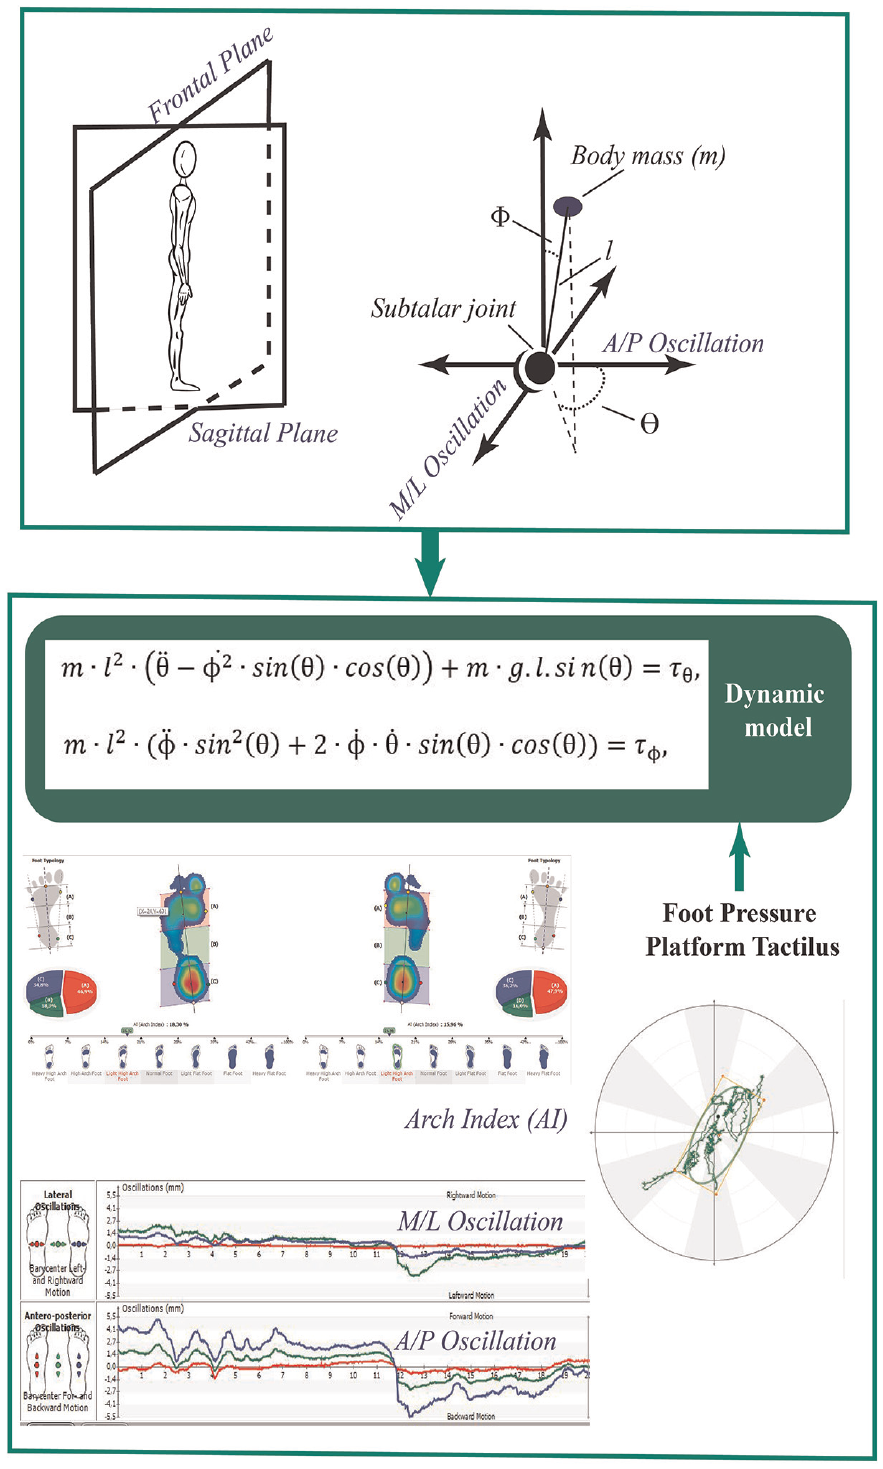
Framework diagram of the proposed approach. The subject upright posture is first modeled. The mathematical model requires information to estimate torque components. The foot pressure mapping system is used to acquire oscillations information and then fed into the model.
The mathematical dynamic model of the spherical pendulums was derived in terms of


where

where
The dynamic equations for our model are:


where
To estimate the components of the ankle torque, kinematics data are fed into equations (5) and (6).
In the case of a simple inverted pendulum, and assuming that motion occurs in the sagittal plane or frontal plane separately, the dynamic equation is simplified as:

The angular displacements


Instrumentation
Our approach requires stabilometric data to estimate ankle torque. A Tactilus high performance footplate, (USA), was used to acquire the data that were sampled at 100 Hz. Two time series for A/P and M/L oscillations were collected. These series were then used to compute the spherical angular displacement according to equations (8) and (9). The angular velocity and acceleration in both
Participants and protocol
A quantitative approach, based on foot deformities, was used to assess the feasibility of the proposed model. Nineteen adults were recruited and Table 1 shows the demographic and anthropometric information of the subjects. The participants were categorized into three groups, according to the value of the foot arch index (AI): normal, flat and high arched foot. The value of the arch index was obtained by dividing the area of midfoot contact with the ground to the total area of foot contact with the ground. An AI of between 20 and 30%, was considered as normal. An AI less than 20%, was considered as a high arched foot. An AI higher than 30%, was considered as a flat foot.29–31 The AI values were acquired using the Tactilus platform.
Demographic and anthropometric data of the subjects.
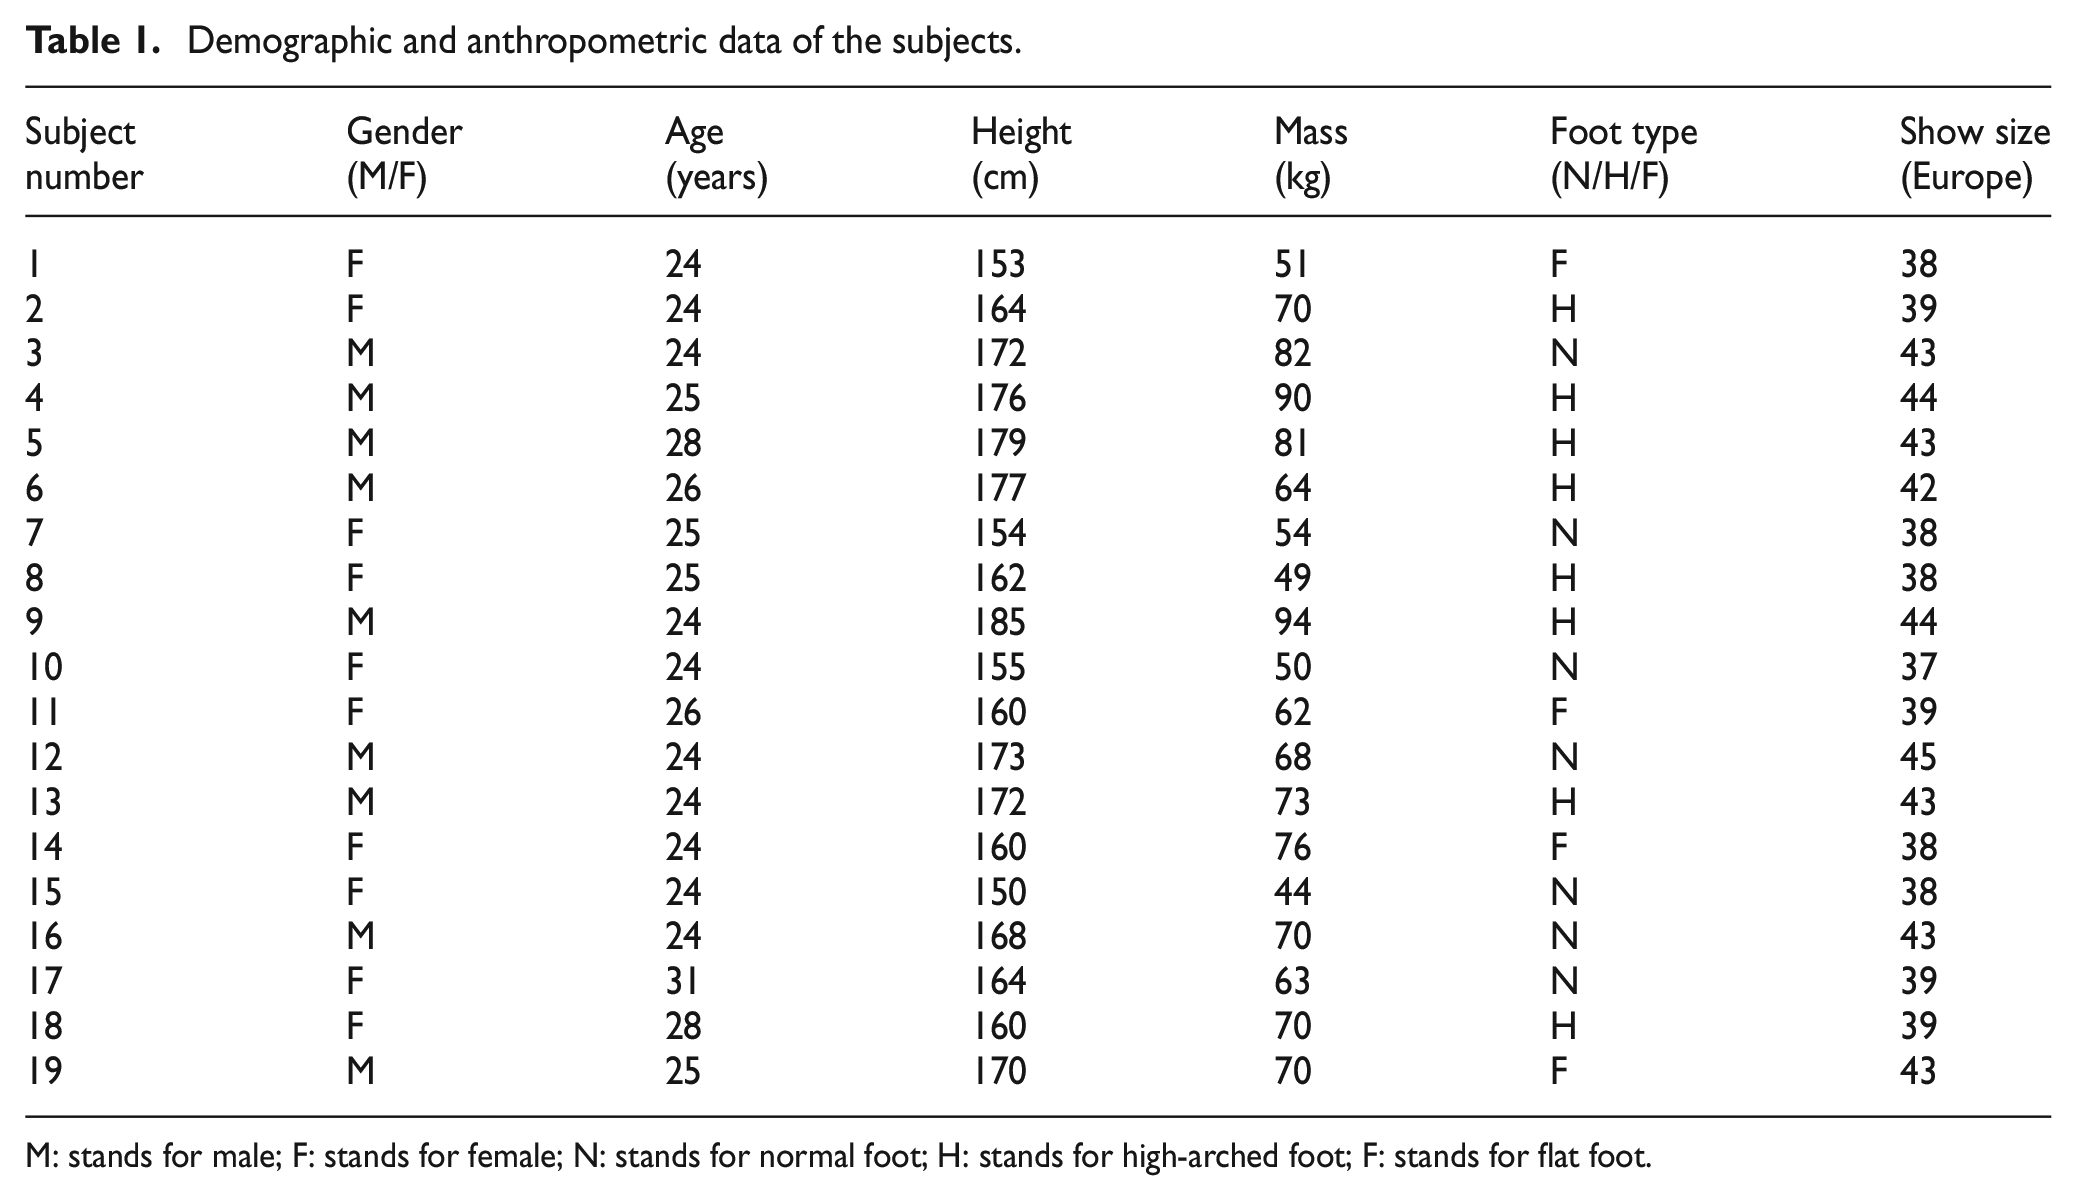
M: stands for male; F: stands for female; N: stands for normal foot; H: stands for high-arched foot; F: stands for flat foot.
These groups helped verify the model’s ability to assess foot abnormalities using the components of the joint torques. All participants were informed about the experimental protocol and signed a consent form in accordance with the Helsinki Agreement. The subjects were asked to step up to the foot pressure platform and to stand still for 20 s while the point data acquisition was initiated. The subjects were requested to keep their eyes open and to gaze on a fixed object. The platform then recorded the A/P and M/L oscillations.
Results
The proposed approach was quantitively implemented to estimate the components of the joint torque for the three groups of subjects: flat, normal, and high arch foot. Time series of the stabilometric data, A/P and M/L, were collected for the 19 subjects according to the proposed protocol. The data acquired were then processed to numerically compute the first and second derivatives of the time series.
Using the dynamic model, and equations (5) and (6), the torque components exerted in the ankle joint were estimated. Figure 2 shows the estimated torques in both

The estimated subtalar joint torque profiles for subject (1). (a) θ– component of the torque. (b) ϕ– component of the torque.
Figure 2 highlights that the torque values in direction
Figure 3 shows boxplots for the torque profiles in direction

Distribution of torque in θ direction. (a) Normal foot cases. AI in the range (20–30%) (b) Flat foot cases. AI > 30% (c) High-arched foot cases. AI < 20%.
The mean values of component

Distribution of torque in ϕ direction. (a) Normal foot cases. AI in the range (20–30%) (b) Flat foot cases. AI > 30% (c) High-arched foot cases. AI < 20%.
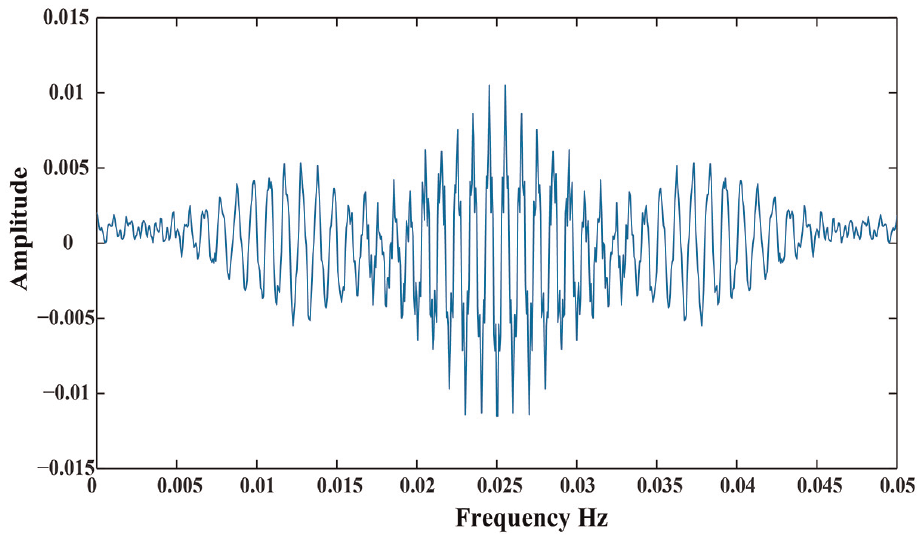
Frequency spectrum of torque component in ϕ direction using FFT for subject (3). Maximum frequency is 0.02452 Hz.
Maximum frequency (Hz) using FFT for

Figure 6 shows the differences between the normal, flat, and high-arched foot for all subjects. The figure shows that the mean value of torque in direction
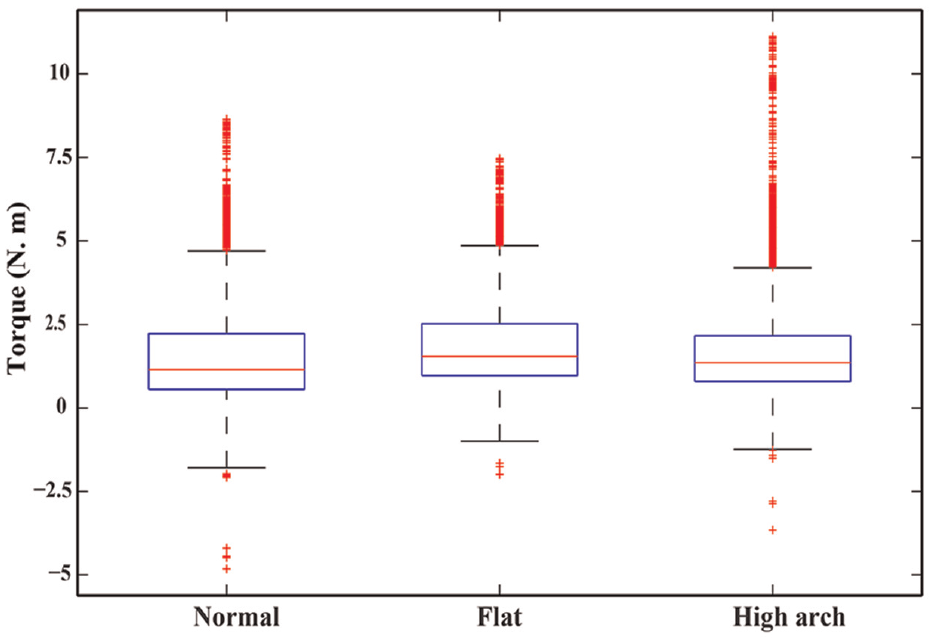
Total distribution of torque component in θ direction for all cases in each group.
Figure 7 shows the maximum frequencies of the torque components in direction

Maximum frequencies distribution. (a) Normal and high arched-foot cases. (b) Normal and flat foot cases.
Discussion
In this work we have presented what we believe is the first ever model for human posture based on a spherical inverted pendulum. Our model reveals that a sway motion occurs in two directions,
The dynamic equations of the model were derived, and two torques components were introduced in
We found that component
In order to investigate the visibility of the proposed model by comparing it with the classical inverted single degree model, 19 subjects participated in the assessment procedure and were grouped into three categories according to the arch index. The foot pressure platform provides different levels of the arch index in order to accurately identify the type of foot deformity. Since a clear segregation between the three adopted groups is required, we used the following ranges of the arch index: 0.21–0.28 for a normal foot, 0.07–0.14 for cavus, and 35–0.42 for planus cases.
We found that the values of
By comparing our model with single degree IP presented in previous works, we estimated the torque using IP model using equation (7). We then compared the torque profile obtained with the torque profiles in our model in both directions. In most cases, a paired t-test showed a significant change, (p < 0.05), between the torque profile generated based on the IP model and the proposed model. This confirms the uniqueness of our approach for modeling human posture. Two cases showed insignificant changes – subjects 3 and 5 – which can be attributed to the age, location of CoM, and type of foot deformities.
The trajectory of the CoP was used to estimate the torque’s components in which noisy profiles were obtained. In general, the results reveal that the torque components in the
Using FFT to analyze the frequency spectrum of the torque components in
Our model has some limitations. Estimating the CoM by assuming the body as a single segment is possibly not the optimal solution. 34 In fact, we plan to extend the current work to identify the CoM using an optical motion capture system where multi-body segments should improve the accuracy of the computation. Since the ankle joint is a synovial joint, a viscoelastic model should be added to the current model. This would help in understanding the change in intrinsic stiffness of the joint and its relation to the sway.
The potential relationship between the foot arch index and its influence on sagittal and frontal balance is not fully understood; however, we can hypothesize some possible causes based on existing literature. One possible reason for the alteration of sagittal and frontal balance with changes in the foot arch index could be the effect of foot arch adjustment on the moment arm of key muscles involved in balance control, such as the gastrocnemius and tibialis anterior. The gastrocnemius, as a major plantarflexor, contributes to sagittal plane control, while the tibialis anterior, as a dorsiflexor, plays a role in frontal plane control. Variations in the foot arch index could potentially impact the control of sagittal and frontal balance by affecting the moment arms of these muscles.
While direct evidence linking the foot arch index to sagittal and frontal balance is limited, some studies have explored the relationship between foot arch characteristics and balance control. For instance, 35 demonstrated that the anatomical structure of the foot is essential in assessing balance conditions, particularly in the elderly population. It was observed that elderly individuals exhibit lower hallux mobility and increased forefoot width compared to younger individuals, where the foot tends to be flatter and more pronated. This finding suggests a potential inverse relationship between the foot arch index and balance.
Further research is required to investigate the underlying mechanisms linking the foot arch index to sagittal and frontal balance control. Future studies could employ advanced biomechanical analysis techniques, such as motion capture and electromyography, to explore muscle activation patterns and joint kinematics associated with different foot arch profiles.
Further investigations are needed to reveal the true significance of this torque component. In fact, we plan to extend the group of participants to include those with balance disorders. This would then give better insights into how to exploit
We intend to validate the obtained torques by conducting force plate measurements. This validation process will furnish empirical evidence supporting the accuracy and precision of our model’s predictions. Furthermore, we have set our sights on expanding our investigation by assembling an extensive dataset of force plate measurements encompassing a diverse range of postures. This expanded dataset will facilitate the refinement and optimization of our model, bolstering its effectiveness in applications related to human balance.
The proposed model has a limitation concerning the intrinsic forces responsible for maintaining frontal balance, which are primarily related to the hip joint. In order to address this limitation and provide a more comprehensive representation of the biomechanical factors influencing frontal balance, we recommend further improving the current model by incorporating the hip joint as a second spherical joint. This updated model would consist of two spherical joints in series and be linked with a lumped mass representing the center of body mass. By introducing an intrinsic torque exerted at the hip joint, the modified model would capture the contributions of both the ankle and hip joints to frontal balance. This expanded model would feature four degrees of freedom, accommodating two degrees of freedom for each joint. To effectively analyze and estimate the torque values of both the ankle and hip joints, additional measurements using motion capture systems and either force plate or foot pressure mapping systems would be required. This proposed modification and its subsequent analysis are necessary for future work, and the enhanced model would offer a more comprehensive understanding of the interaction between ankle and hip joint torques in frontal balance control
Conclusions
We have presented a new approach for modeling quiet standing posture. The approach is based on modeling the posture as a spherical inverted pendulum with two DOF. The model was used to estimate torque components in
Our findings revealed that the profile of the torque component in the
Using a quantitative approach to process torque components is essential since their profiles tend to be chaotic, especially in the
Further studies, using the viscoelastic model of the subtalar and ankle joints, are needed. We are currently investigating how to integrate the viscoelastic model of the subtalar and ankle joints into our model, and we are setting up testing protocols with the assistance of surface-electromyography.
Footnotes
Handling Editor: Chenhui Liang
Declaration of conflicting interests
The author declared no potential conflicts of interest with respect to the research, authorship, and/or publication of this article.
Funding
The author received no financial support for the research, authorship, and/or publication of this article.