
Abstract
The current study is based on an examination of the effect of Newtonian blood flow on the value of the wall shearing stress of an intracranial aneurysm using computational fluid dynamics. Blood is frequently thought to behave like a Newtonian fluid in cerebral arteries. It is fully described how a saccular aneurysm affects a model of blood-silver (Ag) nanofluid flow via an artery. Blood is regarded as a based fluid because of its rheology. The blood flow is Newtonian, laminar, incompressible, viscous, and unsteady, blood enters with a velocity of 0.08 ms−1 and the arterial wall should be flexible. The novelty of the research is to examine the impact of nanoparticles (Ag) on saccular aneurysm. To find the solution, a time-dependent direct solver was employed. To get the answer, the finite element discretization method (FDM) is applied. Coupled partial differential equations are used to mathematically describe the rheology of blood. In the current analysis, the solutions for velocity, temperature, and pressure distribution are found. Figures are used to illustrate and quickly discuss the effects of physical parameters on the characteristics of arterial blood flow for silver nanoparticles. These findings will be extremely beneficial in the treatment of arteries with aneurysms.
Introduction
The vascular system (both veins and arteries) is divided into three layers: the intima (the innermost layer closest to blood flow), the media (the middle layer), and the adventitia (the outermost layer). The walls of arteries, which carry nutrients and oxygen to bodily tissues, are typically more muscular and thicker than vein walls. 1 An aneurysm is a swelling that occurs when one or more layers of the arterial wall become weak.2–4 The term “intracranial aneurysm” (meaning “inside the skull,” also known as “brain aneurysms” or “cerebral aneurysms”) refers to these enlargements of the arterial wall that develop in the brain. Intracranial aneurysms that are small and unruptured hardly ever-present symptoms or issues. However, more blood may build up over time in these “pockets” of the weak vessel wall, causing the aneurysm to grow and the artery layers to further weaken. Arterial aneurysms have a long history that can be traced to the Greeks, ancient Egypt, and Byzantine. The sickness was first mentioned in modern medicine by Harvey in 1628 and Vesal in 1557 . They identified an intravital tumor with pulsation, and an autopsy confirmed the aneurysm. Lancisi’s and Scarpa’s works, published at the end of the 18th and beginning of the 19th centuries, provided additional pillars. In 1785, John Hunter invented the second effective treatment, ligation of the artery close to the aneurysm. Two well-known patients, Thomas Mann and Albert Einstein, both of whom passed away in 1955 from ruptured aneurysms, serve as illustrative examples of the medical and therapeutic issues in the middle of the 20th century. 5 If left untreated, the aneurysm may burst, causing internal bleeding in the brain. Serious health issues like bleeding can happen from this bleeding, like hydrocephalus (fluid buildup in the brain), brain damage, coma, stroke, and death. In less rare instances, huge unruptured cerebral aneurysms can impact nearby nerves and tissues, causing symptoms like weakness, trouble speaking, drooping of the face, and abnormalities in eyesight. 6
Aneurysms are classified according to their shape, size, cause, and location. 7 For instance, a minor aneurysm has a diameter of less than 7 mm, but a large aneurysm has a diameter higher than 25 mm. The most frequent aneurysms are saccular aneurysms, commonly referred to as berry aneurysms because of their berry-like form. Although saccular aneurysms can develop anywhere in the brain, they are most usually found in the major blood vessels at the base of the head (also called the Circle of Willis) and are commonly found near the bifurcations or locations where vessels branch out (Figure 1). Approximately 85% of aneurysms have been discovered in Willis’ anterior circulation circle. 8 Chitanvis et al. created a non-linear structural quasi-static model to study the dynamic behavior of saccular aneurysms in response to the pulsatile flow of blood. 9 The physical situation and modeled saccular aneurysm are shown in Figure 2(a) and (b).

Common places where cerebral saccular aneurysms grow.
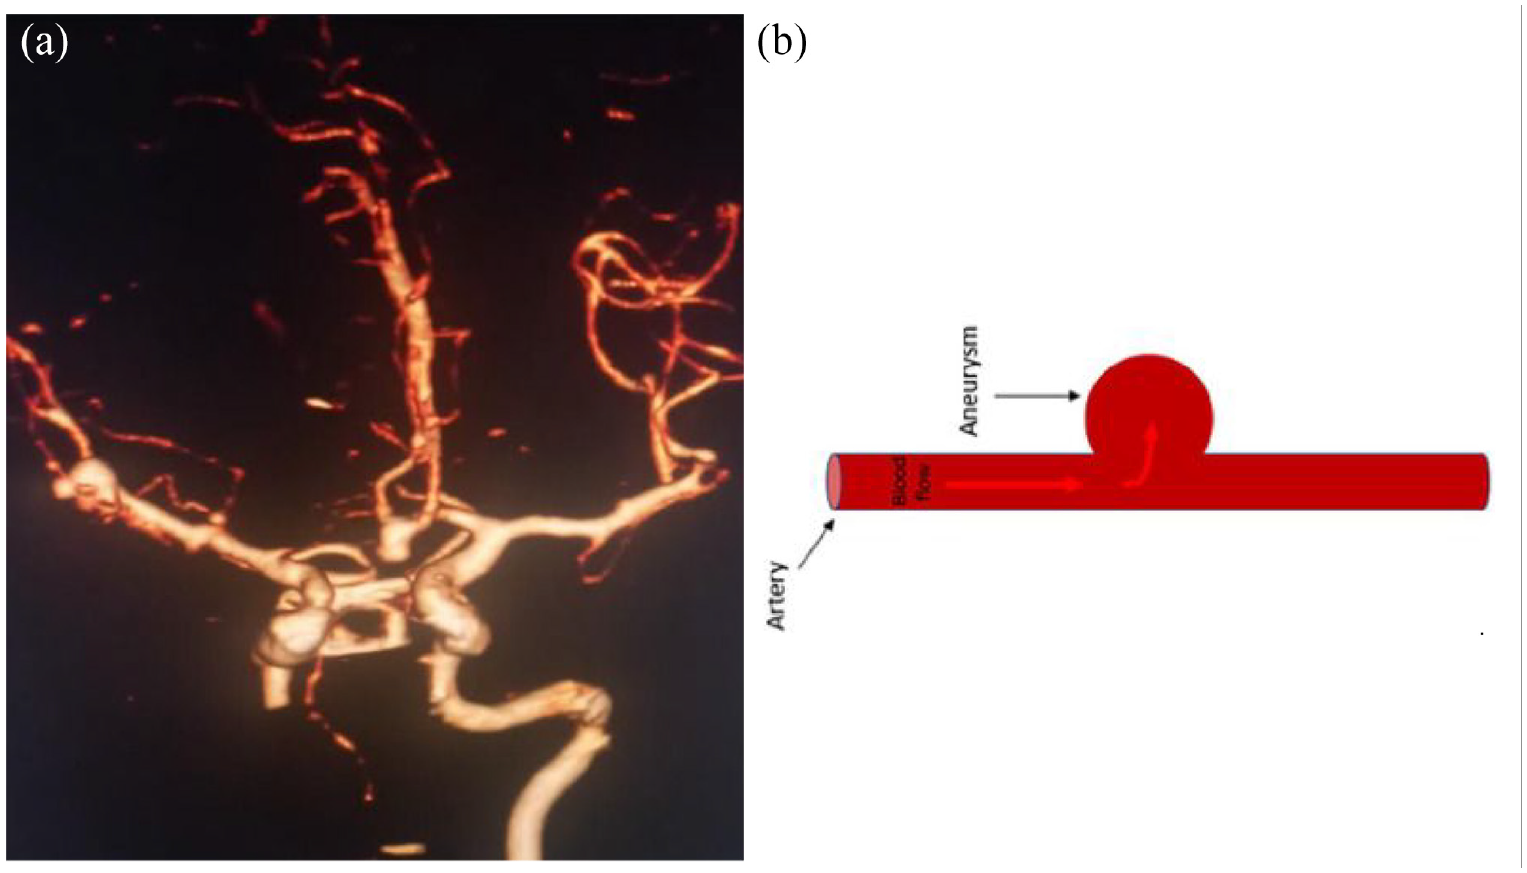
(a) Multiple saccular aneurysm. (b) Saccular aneurysm.
Nanofluid is a kind of fluid that contains nanoparticles, or particles having sizes smaller than 100 nm. Nanofluid is a fundamental fluid for heat transmission in which nanoparticles are suspended. In nanofluid, nanoparticles are typically made of metals, oxides, carbides, or carbon nanotubes. 10 In 1995, Choi and Eastman coined the term “nanofluid” for the very first time. 11 He stated that it is possible to increase the efficiency of thermal conductivity and convection by employing nanofluids. Buongiorno 12 created a mathematical model for dealing with nanofluids and looked into a number of their transport mechanisms and uses. There is a ton of literature available that examines nanofluids and their applications.13–15 Elelamy et al. 16 investigated the flow of blood in a nanofluid with temperature variations and the impacts of leakage inside an aortic valve. The minimum and maximum values for velocity, temperature, and pressure were discovered by A. Hussain et al. 17 while researching the effects of heat transfer for unsteady and laminar fluid flow through various elliptic cylinders. Elnaqeeb et al., 18 studied the blood flow and hemodynamic properties of gold metallic nanoparticles in a stenosed, confined conduit with a range of nanofluid viscosities. Silver (Ag) nanoparticles are used in a variety of fields, including catalysis, microbiology, tomography, photothermic therapy, antioxidants, and many types of cancer. Nano sensors detect skincare products, environmental elements, bioactive molecules, medical products, and packaging materials. A few scientists19–23 have focused on the study of arterial diseases using various methods. Khan et al. 24 used a radioactive porous curved surface with provisional slip to examine how a magnetic field affected the Sisko fluid motion using metallic nanoparticles. Tripathi et al. 25 computationally analyzed the hybrid nanoparticles in inclined aneurysmal artery. Zaman et al. 26 explored the influence of nanoparticles on unsteady flow of blood through aneurysmal artery. A. K. Roy et al. 27 investigated the mathematical model of blood flow with bulk reaction.
From the literature, it is noted that there is no study performed for unsteady blood flow with nanoparticles through the saccular aneurysmal artery. The primary goal of this study is to examine how blood flows through saccular aneurysm. Because blood exhibits a Newtonian nature in big arteries, cavities, and veins. We assumed that blood is a Newtonian fluid. A mathematical formulation is investigated to show how the use of nanoparticles can improve blood flow via arteries. In our issue, nanoparticles are incorporated into the base fluid blood. we provide in-depth simulation studies of three-D time-dependent flows in arteries affected by saccular aneurysms. The equation of mass, momentum, and energy was solved using the software, and the results were estimated for the pressure, velocity, and temperature of the flow of blood inside the affected area.
Mathematical formulation and governing equation
Mathematical formulation
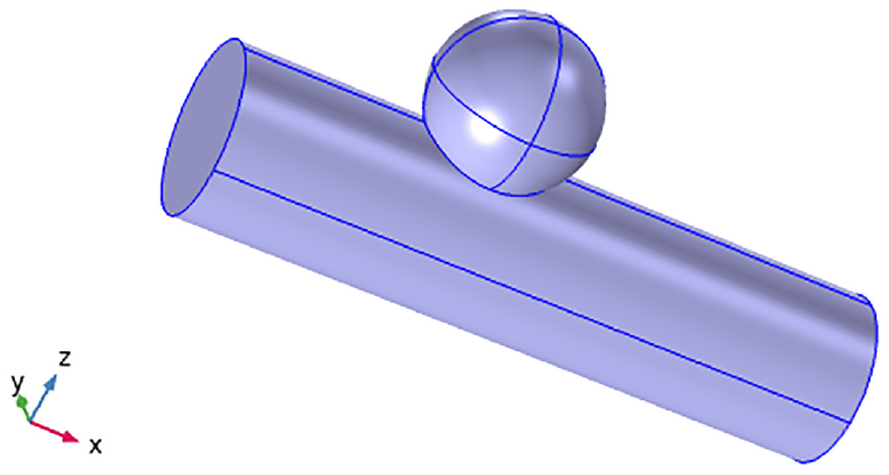
Let us have a look at blood flow along a cylinder, where the physical model with flow geometry is displayed in Figure 3. In this study, blood was thought to flow through an aneurysmal artery as an unsteady, Newtonian, and incompressible fluid. A coordinate system was chosen so that the direction of blood flow was parallel to the r-axis and perpendicular to the direction of flow. It means the velocity field will be
The geometry of blood flow in the saccular aneurysm.
The three-dimensional artery measured 0.2 m in width and 0.8 m in height, respectively. We observe a cylinder with an aneurysm on it from a distance.
Governing equations
The saccular aneurysm-afflicted artery’s laminar, unsteady, and incompressible silver–gold nanoparticles are buried in the blood. Let z be the axis of an artery in (r,

where


The relationships listed below make up equation (3).
where
Without body forces, the preceding simplified equations again for velocity distribution
Continuity equation

Momentum equations


where the nanofluid’s density, viscosity, and pressure are indicated by


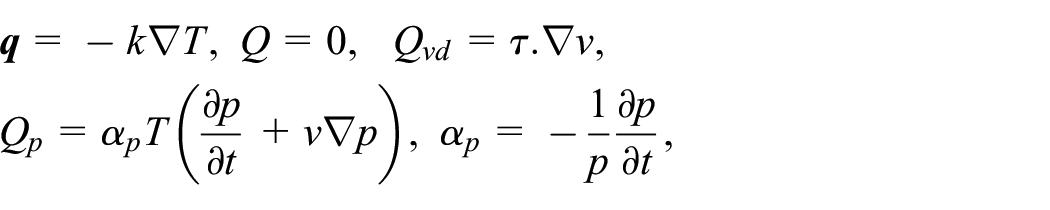
Energy equation

The specific heat capacity of the nanoparticles is
Physical characteristics of nanofluid
Blood is a continuous, aqueous, complex, fluid made up of a suspension of cells or other particles called plasma. The cells are made up of many types of blood cells, including platelets, leukocytes, and red blood cells (erythrocytes). Water makes up 90% of the plasma in the suspending medium, followed by plasma protein (7%), and both organic and inorganic components (3%). Red blood cells make up 97% of the blood’s total cell content, and the rheological properties of blood are greatly influenced by their size, shape, flexibility, and deformation. Hematocrit calculates the volume proportion of the red blood cells in plasma.
28
The specific heat capacity of the nanoparticles is

Boundary conditions
There was thermal insulation, inlet, outlet, and wall present in the boundary conditions.
Thermal insulation at boundary
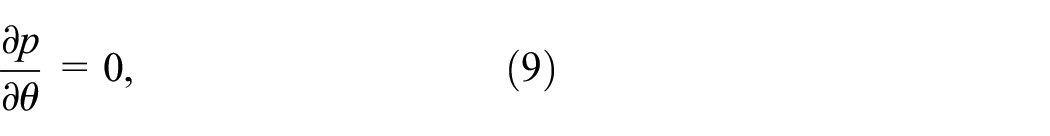
The geometry’s boundaries are all thermally insulated. The equation is as follows:

Conditions along the inlet boundary
The blood flow speed or rate was designed to simulate the artery’s inlet. Blood volume could be regulated by the rate of inlet and the region of the cross-section of the flow. The inlet boundary’s state was as follows 32 :

where
Conditions along the outlet boundary
To further the accuracy of the simulation, we included pressures from the blood circulation model right at the outflow in the outlet. 32 The exit, which was located across from the inlet, was where the blood left the body:


Here, the internal artery’s normal pressure or backflow suppression is assumed to be 13,000 Pa.
Wall boundary condition
The blood is so viscous that it cannot travel through the walls and sticks to it instead. Here, the no-slip situation is taken into account. As a result, the equation on the wall read as follows:

The blood and nano particles properties shown in Table 1.
Properties of the base fluid’s and the nanoparticle thermophysical properties.

Computation of meshes
Mesh is a critical component in CFD. The mesh’s development is determined by the solution’s degree of accuracy as well as the rate of convergence. Fine-size mesh produces more accurate results and performs better than standard element-size mesh. Figure 4 shows typical element size meshes; it was found that the arterial aneurysm first manifested has a finer size mesh.

Geometry of fine-size mesh.
Table 2 shows mesh properties.
With the use of the laminar flow model, the section studied mesh statics and mesh size property.

Results and discussions
Discussion of aneurysm design results is covered in this section. Analyzing blood flow in the arteries mathematically is a crucial and challenging issue. The most common illnesses of the arterial system are the accumulation of fatty substances in arteries and the enlargement of arteries, which are often known as arterial aneurysms. When nanoparticles are added, a mathematical model is investigated to determine the temperature, pressure, and velocity of blood moving through arteries with the aneurysm. The presence of nanoparticles changed the physical characteristics of blood, including its dynamic viscosity, heat capacity, density, and thermal conductivity, changing the simulation’s outcomes.
Velocity, temperature, and pressure profile at 0.4 s
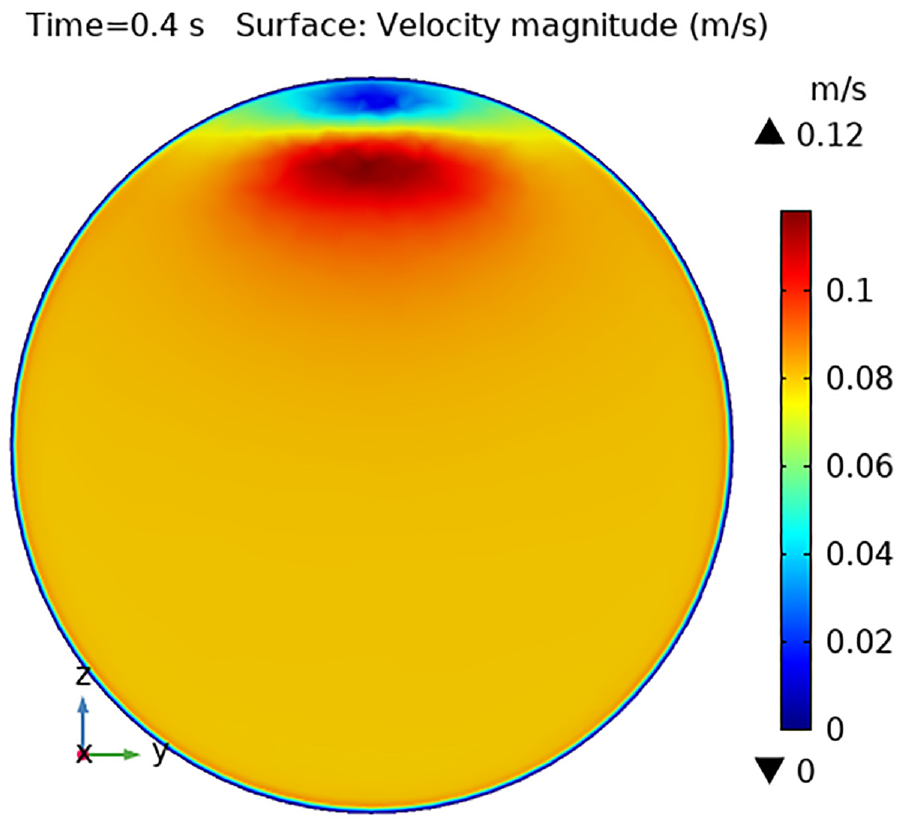
Surface velocity magnitude at 0.4 s
The surface velocity profile is shown in Figures 5–8 at various location scales in the x-axis 0.23, 0.3, 0.37, and 0.4 m, respectively. Figure 5 shows the velocity distribution at position x = 0.23 m for time 0.4 s. The flow velocity increases when fluid enters the aneurysm and returns to normal as fluid fills the aneurysm. The velocity within the artery wall ranges from 0.08 to 0.1, and the maximum velocity is 0.12 m/s, as displayed in Figure 5. In Figure 6, we can see that the maximum velocity is shifted inside the artery wall which is 0.08 m/s and gradually decreased upward and is the minimum with an aneurysm. Figure 6 demonstrates how the highest velocity, 0.08 m/s, is moved inside the arterial wall and gradually drops upward to become the minimum inside an aneurysm. The position when the aneurysm is almost over and has the maximum velocity at both corners is 0.4 m, as shown in Figure 7. Figure 8 depicts the blood flow field at position x = 0.4 m without any artery aneurysms. The pressure is lowest inside the upper wall of the cylinder for a relatively brief period before rising.

Velocity profile for

Velocity profile at position

Velocity profile at position
Velocity profile at position
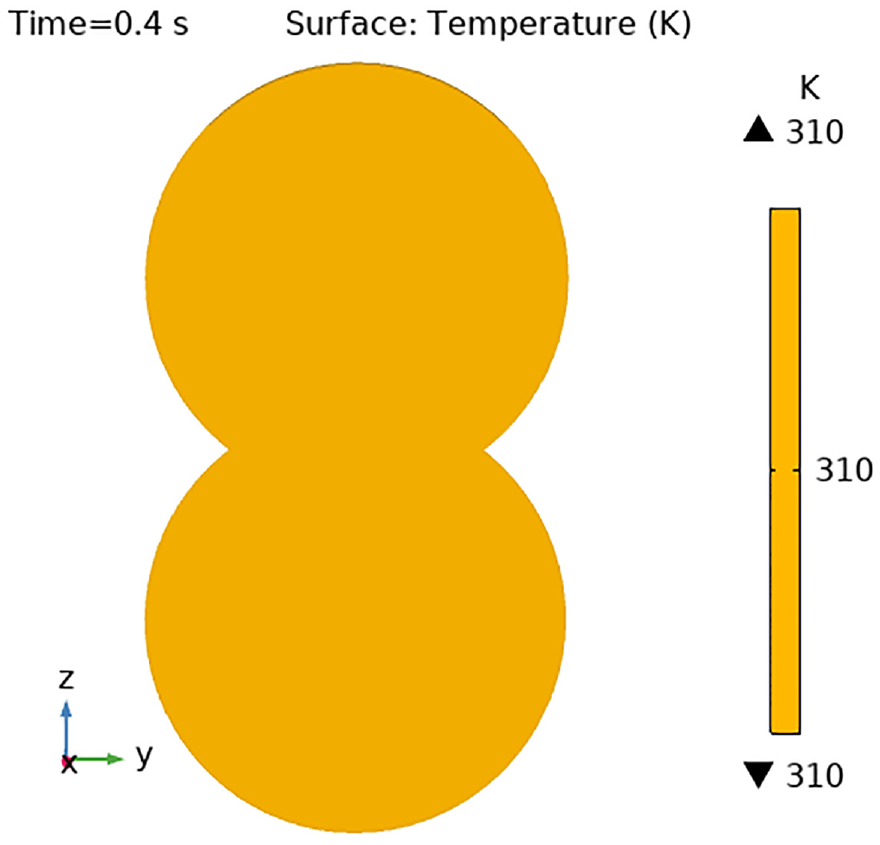
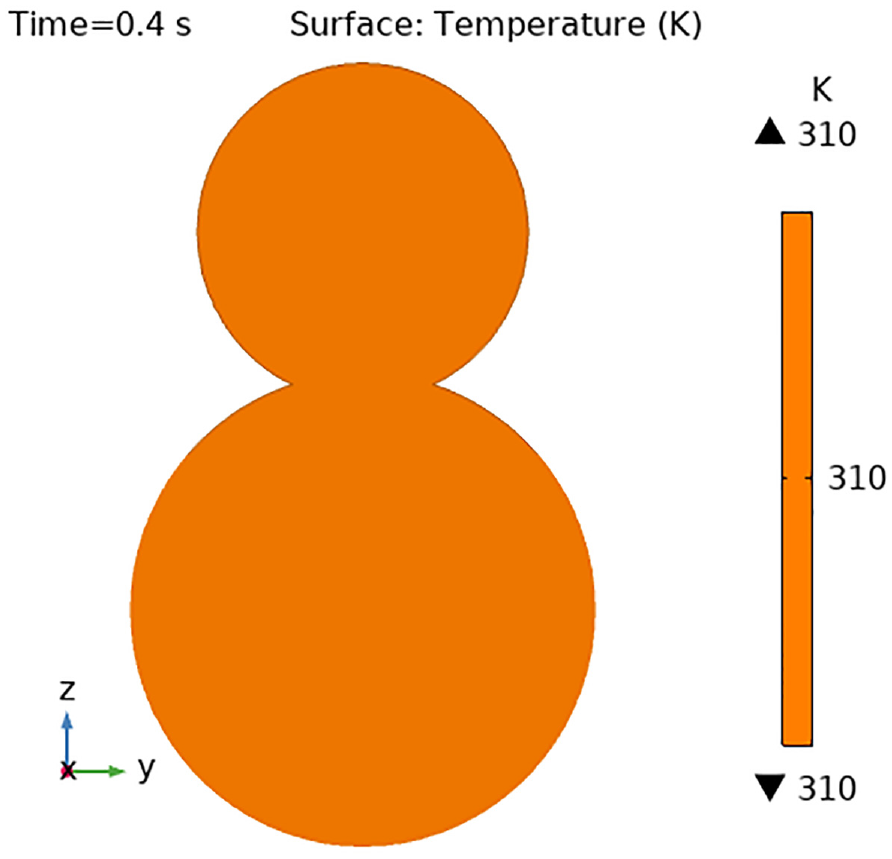
Temperature distribution at time 0.4 s
Figures 9–12 depict the temperature distribution for heat transfer at time 0.4 s with different x-axis positions. The artery aneurysm’s temperature is steady which is 310 k. The findings demonstrate that its heat transfer ratio was significantly improved by the use of nanoparticles.

Temperature description for
Temperature description for

Temperature description for

Temperature description at
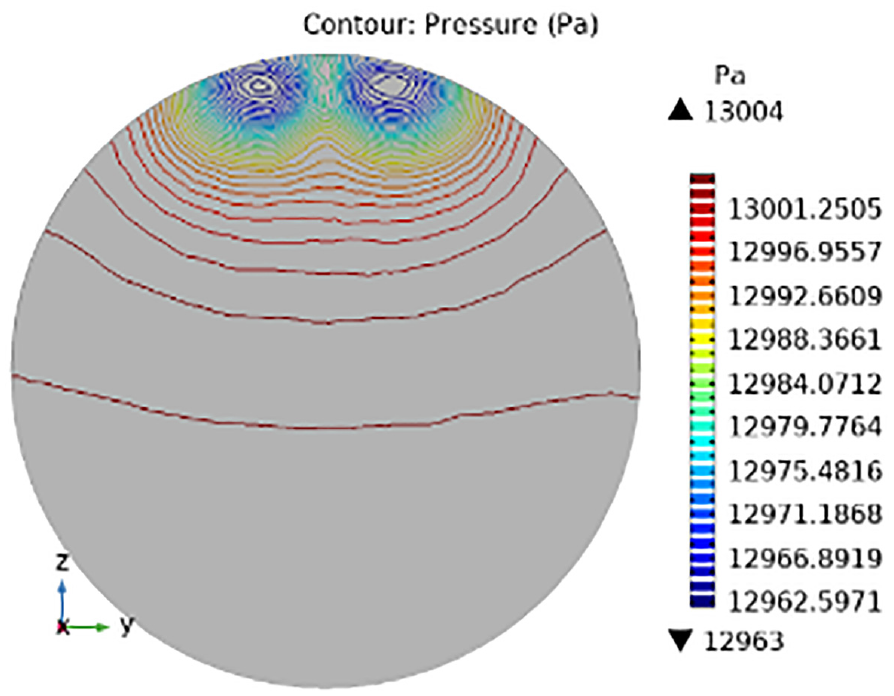
Pressure distribution at time 0.4 s
The highest and lowest pressure values were noticed at different positions (0.23, 0.3, 0.37, and 0.4), and the pressure profiles are shown in Figures 13–16. Figure 13 depicts the blood pressure inside the artery at x = 0.23 m. The starting point of the aneurysm has a minimum pressure of 12,965 Pa. The aneurysm wall’s interior was subjected to the highest pressure, which was 13,028 Pa. Figure 14 displays that as we proceed lower, the pressure steadily drops until it reaches its lowest point (13,014 Pa) at the bottom. The pressure is greatest (13,036 Pa) within the aneurysm wall. Figure 15 shows that an aneurysm is nearly finished in the 0.37 m location. The pressure tends to be lowest at 12,936 Pa at the corners, where the aneurysm’s fluid begins to drain out, but it is at its highest at 13,036 Pa inside the aneurysm. The figure illustrates that the highest and lowest pressure values are 13,004 and 12,963 Pa, respectively, with the artery wall having no aneurysm.

Pressure description for

Pressure description for

Pressure description for

Pressure description for
Velocity, temperature, and pressure profile at 1.4 s
Surface velocity magnitude at 1.4 s
The region where the aneurysm just starts, the border of the artery walls and inside the aneurysm wall both have the lowest velocity magnitude, which is 0.01. for x = 0.23 greatest velocity is 0.08 as in figure 17. The center of the arterial aneurysm is depicted in Figure 18, which has the lowest velocity in the aneurysm and increases from upward to downward. Figure 19 shows that when fluid leaves the aneurysm and enters the artery, the greatest pressure is at corner points, which is 0.09 m/s. Figure 20 displays a very small region inside the cylindrical wall have minimum velocity (0.01) and maximum (0.1) all over the region.

Velocity profile for

Velocity profile at position

Velocity profile at position

Velocity profile at position
Temperature distribution at time 1.4 s
The temperature distribution for heat transmission at time 0.4 s is shown in Figures 21–24 at various positions along the x-axis. Moving ahead causes the temperature to remain constant, regardless of time or location. Figures 21–24 show the maximum and minimum temperatures as 310 k.
Temperature description for

Temperature description for

Temperature profile for

Temperature description at
Pressure distribution at time 1.4 s
Figures 25–28 depict the pressure distribution along the artery. Figure 25 shows that the highest pressure 13,017 Pa is experienced when an aneurysm starts. As the fluid aneurysm, the pressure is moved from maximum to minimum upward within the aneurysm. Figure 26 depicts both corners of the aneurysm having less inward pressure, which is 12,996 Pa, with the inner part of the aneurysm having the highest pressure, which is 13,019 Pa. Figure 27 shows that the minimum pressure is transferred from the corner of the aneurysm into the artery is 12,963 Pa. Figure 28 depicts a very small region of low pressure on the upper side of the artery wall, and the rest part has maximum pressure. The pressure’s minimum and maximum values are

Pressure description for

Pressure description for

Pressure description for
Pressure description for
Explanation of a line graph
The behavior of blood flow within the fatty sections of the artery is depicted by the line graphs.
Velocity profile
The velocity profile in the artery with the aneurysm is depicted in Figure 29 about position and time. The outcomes for velocity were improved by the use of nanoparticles. In the beginning, blood flows normally in the artery because of the absence of the aneurysm. As an aneurysm began at position x = 0.3 m, the maximum velocity is 0.08 m

Line graph showing the velocity of blood in the artery.
Temperature profile
The temperature profile within the artery according to time and location is shown in Figure 30. The temperature is lowest at the inlet and gradually rises as the blood travels through a certain distance. The legend indicates that temperature also varies with time. Although the temperature varies with time, the highest and lowest temperatures are 310.0008 k and 309.9926 k.

Line graph showing the temperature profile of blood in the artery.
Pressure profile
Figure 31 displays the pressure profile’s line graph. The artery’s inlet wall has the highest pressure, which gradually decreases as it approaches the aneurysm. Pressure is lowest as the blood flows towards the outlet. The pressure is also influenced by time, and the legends display how the pressure changes through time. The pressure is drop when time rises. The highest pressure is 13,020 Pa and the lowest pressure value is 13,002 Pa in Figure 31.

Line graph showing the pressure profile of blood in the artery.
Conclusion
The authors of this study took into account how blood moves through an artery with a saccular aneurysm to address the aneurysm’s problems. We looked into the effects of introducing nanoparticles into an artery with illness and how the blood would flow through it. This study’s primary goal was to summarize the CFD outcomes for the velocity, temperature, and pressure across the artery’s affected region. According to the findings, adding silver nanoparticles reduced overheating and improved the performance of the velocity profile. The following is a detailed summary of the investigation’s highlights.
The diameter of the artery impacts blood speed, temperature, and pressure.
The aneurysm’s blood flow is normal, rising slowly and peaking where the aneurysm first begins.
The pressure inside the artery wall is lowest when an aneurysm starts, and it is highest inside the aneurysm wall.
The aneurysm’s corner, where blood enters it, has the minimum pressure. The aneurysm walls, where fluid is left, have the highest pressure; at the artery’s corners, where the aneurysm is finished, there is the lowest pressure.
As time passed, the temperature decreased.
After comprehending the behavior of velocity, pressure, and temperature, it may be helpful to treat the many forms of cardiovascular or brain illnesses.
In the future, the hybrid nanoparticles can be added to get the more accurate result. It is beneficial to made devices or medicine to control the blood circulation.
Footnotes
Appendix
Handling Editor: Chenhui Liang
Declaration of conflicting interests
The author(s) declared no potential conflicts of interest with respect to the research, authorship, and/or publication of this article.
Funding
The author(s) received no financial support for the research, authorship, and/or publication of this article.