
Abstract
Pendulum mill is a widely used grinding equipment in powder processing industry. Less in-depth studies have been carried out especially for grinding efficiency and wear. Through theoretical analysis, the main influencing parameters were screened, among which spindle speed and spade degree mainly affect the grinding efficiency, but wind velocity mainly causes the main duct wear. The Fluent-DEM co-simulation method is used for the study of the complex physical field of mill operation. The simulation shows that grinding efficiency increases with spindle speed, but the increase from 110 to 120 rev/min is not significant, so the choice of spindle speed should consider both grinding efficiency and energy consumption. The spade degree determines the spade position, the closer the spade is to the grinding roller, the higher the grinding efficiency. Wind velocity has little effect on grinding efficiency, but it does affect the likelihood of particles entering the main duct and causing wear. Multi-objective optimization determines a spindle speed of 110 rev/min and a spade angle of −12° at a wind velocity of 46 m/s to achieve maximum grinding efficiency and minimum wear. This study provides a digital analysis basis for optimizing the operating parameters of the pendulum mill.
Introduction
Pendulum mill is one of the most common grinding equipment in powder processing industry, mainly used for grinding non-metallic minerals such as calcite, marble, and chalk. Compared with vertical roller mill (VRM) or ball mill, due to its simple structure, easy maintenance, low price, stable performance, simple process, and convenient operation, many industries with low powder fineness requirements still prefer this pendulum mill. 1
The large size of mining equipment results in complex operating conditions and many influencing factors. The effectiveness of methods using only theoretical analysis and experimental verification for optimizing equipment operating parameters is poor, and more research is carried out using CAE simulation analysis methods. Two of the most common simulation methods used for mining machines are: Computational Fluid Dynamics (CFD) and the Discrete Element Method (DEM). CFD is used for wind field simulations and has been widely reported, while DEM is used to describe the grinding process and particle motion patterns, with related studies appearing in the last decade. Using DEM, Xie et al. 2 found that in a Semi-Autogenous Grinding (SAG) mill, increasing the ore fill level would increase energy consumption and reduce the energy efficiency and wear of the liner and grinding media. Cleary et al.’s team3–5 studied jaw, cone, gyratory, impact, and double roll crushers, as well as other mining machinery, having analyzed factors that affect their wear and work efficiency. Esteves et al. 6 used DEM wear simulation to evaluate screw liner wear in a VRM. Three different mill rotational velocities were evaluated, according to different scale-up procedures. Liu et al. 7 simulated the VRM crushing process without air involvement by DEM, combined with bonded-particle model. It was found that trends in the particle size distribution of product and changes in throughput and crushing rate could be identified with alterations in material properties and the operating conditions. To reveal the interaction of complex physical fields in mill operation, the co-simulation method is more efficient. Nagata et al. 8 investigated the effect of bead mill rotor shape on the dispersion state using experimental tests and DEM coupled with CFD simulations. Huang et al. 9 used CFD-DPM co-simulation to study the multiphysical field coupling mechanism in a large VRM, and simulated the quality of the finished product, and the simulation results matched the actual operating results.
The pendulum mill is in widespread use in China, but there has been relatively little theoretical research and optimization, and there are still many urgent problems. Therefore, this paper is based on the co-simulation of ANSYS-Fluent and Rocky-DEM to simulate the actual mill operating environment, thus analyzing and optimizing some key factors for pendulum mill. Using spindle speed, spade degree, and wind velocity as influencing factors, response surface experiments were designed to optimize the design and analyze the influence on mill efficiency and main duct wear. This study provides a digital design basis for optimizing the structure and operating parameters of the pendulum mill.
Working process and principles of pendulum mill
The pendulum mill is a powder production equipment that combines ring-roller grinding with air classifying and air conveying. Its core structure consists of a main machine and a classifier, and the main machine is the subject of this paper, the structure of which is shown in Figure 1. Based on the structural composition, the working process is described as follows: The grinding of coarse particles is achieved by the relative grinding motion of the grinding rollers and rings, and the first classification of fine particles generated by the grinding is achieved by the wind transport in the main duct. In coarse particle grinding, some raw materials first fall from the particle inlet into the primary grinding area, and spades rotate around the spindle to lift the particles into the grinding area between the rollers and the ring, where they are caught by the rollers for grinding. At the same time, the wind enters the mill from the air inlet, goes to the main duct, passes through the blade area and forms a spiral upward wind field in the vertical direction, where this wind blows fine particles that meet the size requirements moving upwards. Finally, the finished powder is further screened by a classifier located above the main machine. In conjunction with actual mill operation and research experience, the effects of spindle speed, bucket installation angle, and air inlet wind speed on mill efficiency and wear are analyzed. The relevant theory is explained below.

Schematic diagram of the main machine of pendulum mill. 1 – Shall; 2 – Particles inlet; 3 – Return-air duct; 4 – Air inlet; 5 – Base; 6 – Support frame; 7 – Rollers; 8 – Grinding ring; 9 – Spades; 10 – Blades; 11 –Spindle shaft.
Spindle speed analysis
Changing the spindle speed has a significant effect. Its effect can be divided into two main aspects: firstly, the spindle speed mainly affects the throwing height of the particles and thus the particle grinding efficiency; secondly, it also affects the grinding force of the pendulum mill.
Regarding the influence of spindle speed, Wang 10 proposed the calculation formula (1)–(4), which explains the movement process of spherical particles during the throwing process, as shown in Figure 2.


where
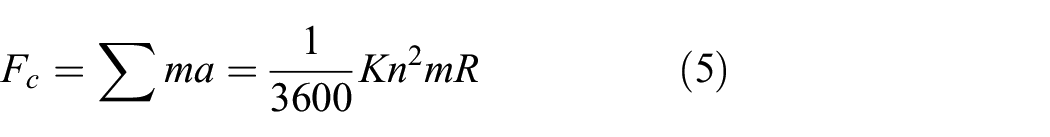
When a particle is thrown, it enters the grinding area at the point where the roller and ring are about to make contact. Under the effect of centrifugal force, the rollers of the pendulum mill grind the particles together with the ring. As shown in Figure 3, Hu 11 proposed a theoretical calculation for the mechanical model, as shown in formulas (5) and (6):

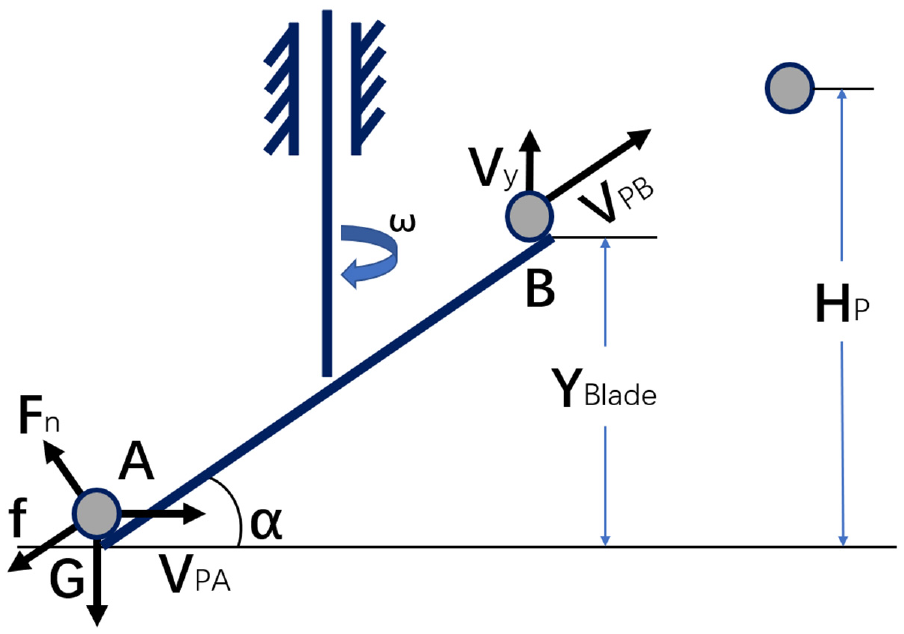
Movement of particles thrown by spade.

Mechanical analysis diagram.
where
According to formula (6), as the spindle speed increases, the grinding force increases, thus improving the grinding efficiency. However, Hu 11 mentioned that there is an upper limit of spindle speed when both feed rate and material type are fixed, because the production capacity of the mill will tend to be stable, and further increasing the spindle speed will not significantly increase the output.
Spade degree analysis
The angle between the spade and the roller can also affect the grinding efficiency. If the spindle speed is different, the particles will be thrown at different heights by the spades, so the time for the particles to enter the grinding area will be different. As shown in Figure 4, included angle between spade and roller is 53° (

Diagram of inclusion angle between spade group and roller.
The inclusion angle between the spade and the roller can be obtained by calculation, and the engagement angle
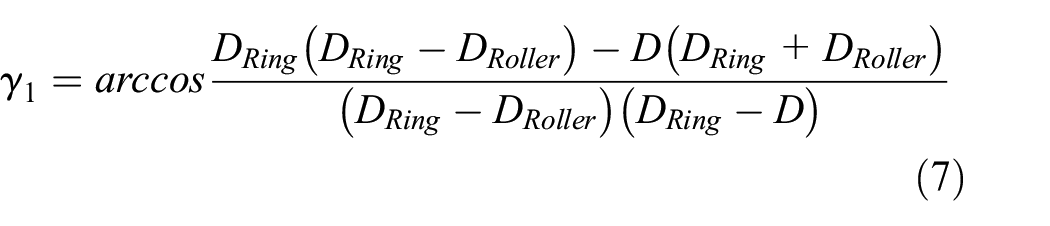
where:
In a windless state, angle


where
The angle

where
Wind velocity analysis
In order to simulating the real internal environment of mill in production, wind field is added in simulation and its influence is observed. In production, motion trajectory of particles will be affected by force from the wind. After particles leave spade, they are subjected to gravity
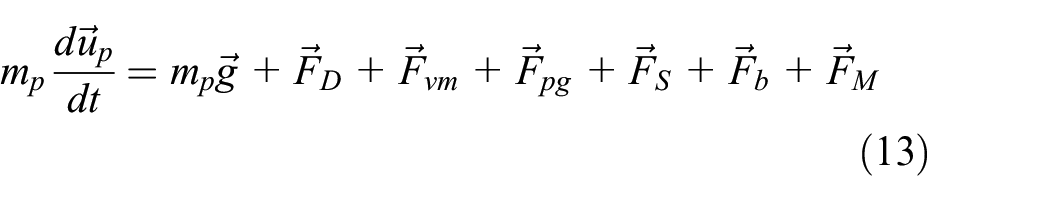
where
Among particles forces,


where:
Inertial force and resistance of particles in the wind field can be characterized by Stokes number. 13 Stokes number is shown in formula (16).

where
It can be seen from the above formulae that smaller particles are easier to follow the wind field. Combined with the wear of the mill blade area, the higher the wind velocity, and fewer particles will have the chance to enter the main duct through the blade area. However, for those particles that have inadvertently entered the main duct, a higher wind velocity will give the particles a higher kinetic energy, which can lead to greater wear on the main duct. It is therefore necessary to study the effect of the wind on the particles.
Single factor simulation analysis
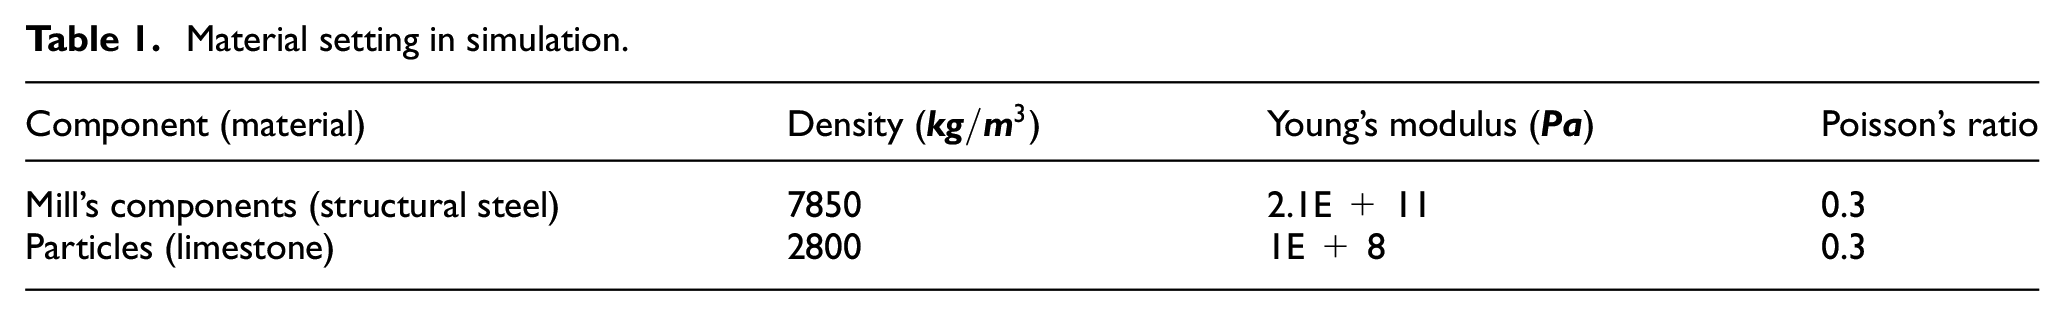
A single factor simulation analysis is carried out in terms of spindle speed and spade degree. Material properties of mill components and particles in the simulation are shown in Table 1. Figure 5 shows the limestone material in production. In the simulation, the particle shape is ore-like particles with a sieve size of 28 mm, as shown in Figure 6.
Material setting in simulation.

The limestone material in production.

The particle in Rocky DEM.
In Rocky DEM, The Ab-T10 breakage probability is based on a model proposed by Vogel and Peukert,
14
with subsequent modification proposed by Shi and Kojovic.
15
At the same time, there is the concept of the specific impact energy (

where
In Rocky DEM, components wear follows Archard wear law, which relates volume loss with work done by friction force on structure, being calculated as follows 17 :

where
In Rocky DEM, the grinding efficiency of particles can be evaluated by the normal collision energy spectrum. The tangential collision energy spectrum between particles and boundary is used to evaluate the structural wear of relevant components.
Single factor simulation of spindle speed
According to the actual production condition, the wind velocity in the air inlet is 42 m/s, the spade degree is −12°, and the feed amount is 12 t/h, which is adopted in the simulation setting, and the spindle speed change is changed as 90, 100, 110, and 120 rev/min according to the production experience. After 10 s of simulation, both the collision frequency between the particles and the ring are extracted as a function of time, as shown in Figure 7, which shows a significant increase as the spindle speed increases. More particles are involved in the grinding process as the spindle speed increases. Lower spindle speed (90, 100 rev/min) will get maximum values (about 4 s position), then decrease, but higher spindle speed (110, 120 rev/min), collision frequency has an upward increase during the whole time, which can reflect an effective capture and grinding of particles.

Collision frequency between particles and ring.
In the Ab-T10 particle fracture model, if the particle receives sufficient impact energy as a single individual, it is instantly broken into fragments. Therefore, the collision energy spectrum between the particle and the ring is derived as shown in Figure 8. Figure 8(a) shows the collision rate between particles and the ring. As the spindle speed increases, the collision rate increases. When the energy is equal to 0.398 J, all spindle speeds have the highest collision rate, but when higher energy levels (2.512, 15.849, and 100 J) are reached, the collision rates remain the same. The reason for this is that as the spindle speed increases, more particles can enter the grinding area through the throwing of the spades, and consequently the grinding force increases, which improves the overall grinding efficiency. With higher energy, particles are more easily broken and therefore the collision rate of a high energy level increases, resulting in higher grinding efficiency. The theory proposed by Bbosa et al. 18 shows that low energy level collision accumulation can also damage particles, so low energy level collision is also useful for particle size reduction. Figure 8(b) shows the energy dissipation rate, as the spindle speed increases, the energy dissipation rate of each energy level also increases, where these peaks appear when the energy is 1.58e-3 J. It is speculated that these ineffective collisions may occur because as the spindle speed increases, not only are more particles entering the grinding area, but more particles are colliding directly with other areas of the ring and these particles cannot be captured by the rollers, thus creating more ineffective collisions.

Collision energy spectrum with different spindle speed: (a) normal collision rate and (b) dissipation collision rate.
Figure 9 shows the particle size distribution curve at different spindle speeds after 10 s of simulation. It can be seen that as the spindle speed increases, the proportion of fine particles increases while the proportion of coarse and rough particles decreases. Figure 10 shows the time variation curve of the average particle size under different spindle speeds. It can be seen that the average particle size shows a decreasing trend with time as the spindle speed increases, which results in more particles being captured by the roller, thus improving grinding efficiency. When the speed is increased from 90 to 110 rev/min, the grinding efficiency is obviously improved, while when the speed is increased from 110 to 120 rev/min, the increase in grinding efficiency is not obvious.

Particle size distribution under various spindle speed.

Average particle size change with time under various spindle speed.
Due to the cost of simulation time, the minimum broken size is set at 8 mm. If particles smaller than this value are produced after breakage, they will not be statistically relevant in subsequent simulations, the mass loss of particles is considered as finished particle mass. The finished particle productivity obtained after 10 s of simulation is shown in Table 2, where the productivity increases as the spindle speed increases. There is an increase of 5.65% from 90 to 100 rev/min and 5.43% from 100 to 110 rev/min. However, from 110 to 120 rev/min this increase is significantly reduced to 1.62%. The trend of change is consistent with the particle size distribution and average particle size as previously shown in Figures 9 and 10. Since increasing the spindle speed results in more energy consumption if the increase ratio is not significant, both productivity and energy consumption should be considered when determining the spindle speed, leading to the conclusion that 110 rev/min is the more economical choice. At the same time, we have listed the actual yield (the particle size of the finished powder is 100 mesh) in Table 2. There is an increase in yield of 1.18 t (10.02%) from 90 to 100 rev/min, and 1.14 t (8.80%) from 100 to 110 rev/min. And from 110 to 120 rev/min this increase is significantly reduced to 0.23 t (1.63%). The trend in actual production is consistent with the simulation results.
Finished product mass and yield at different spindle speed.

Changing the spindle speed will not only affect the particle grinding efficiency, but also affect the wear of the main duct. In actual production, it is found that after the pendulum mill works for a long time, the main duct will be severely worn at the top. The simulation results also verify this phenomenon, as shown in Figure 11. The left side is a photo of the wear in the blade area in a real mill, showing an obvious uneven wear at the top (marked with a red circle); the right side shows a simulation wear, also with a severely worn top of the blade. Wear at this point in production will result in uneven wind delivery, which will seriously affect the classifying effect and the quality of the finished powder.
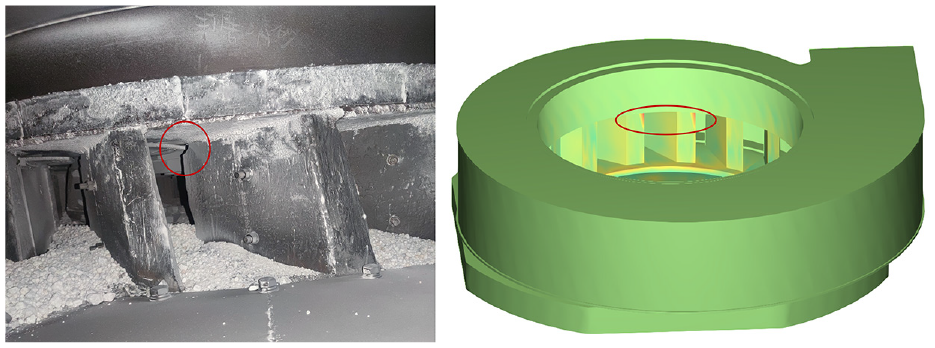
Comparison between actual wear and simulated wear.
According to Archard’s wear theory, 16 the cumulative energy spectrum of tangential collisions between particles and the main duct under different spindle speeds is derived as shown in Figure 12. It can be seen that as the spindle speed increases, the cumulative energy of tangential collisions between particles and the main duct tends to decrease. There is little difference between 90 and 100 rev/min for high energy collisions (0.398 J and above). However, as the spindle speed increases at a low energy level, the cumulative power of the tangential collision between particles and the main duct decreases. It can be seen that the wear of the particles on the main duct is significantly reduced as the spindle speed increases.

Cumulative power spectrum of tangential collision between particles and main duct with different spindle speeds.
Table 3 shows that the wear loss is reduced as the spindle speed increases. It can be concluded that the number of particles entering the grinding area increases as the spindle speed increases, reducing the number of particles entering the main duct and thus reducing wear.
Wear of main duct at different spindle speeds.

Single factor simulation of spade degree
In the single factor simulation of the spade degree setting, the wind velocity in the air inlet is 42 m/s, the spindle speed is 105 rev/min, the feed rate is 12 t/h, and the spade degree as a variable setting is −12°, 0°, and 12°. The normal collision energy spectra between the particles and the ring are extracted and shown together in Figure 13. Except for 0.0001 J, when the spade degree is decreased, the collision rate increases, but when a high energy level (0.398 J and above) is reached, the collision rate decreases significantly. As can be seen in Figure 13(a), when the spade degree increases, the collision frequency of the high energy level (0.398 J and above) decreases, and the dissipated energy of the low energy level increases (Figure 13(b)). As the spade degree decreases, the collision frequency of the high energy level increases significantly, but the dissipated energy of the high energy level increases slightly.

Collision energy spectrum with different spade degrees: (a) normal collision rate and (b) dissipation collision rate.
From the particle size distribution curve in Figure 14, it can be seen that as the spade degree increases, the residual number of raw particles increases and fewer particles can be effectively grinded. Figure 15 shows the change curve of average particle size under different spade degree in a 10 s simulation process. The average particle size shows an upward trend after simulation with increasing spade degree, the difference between 12° and 0° is small, but the difference between 0° and −12° is large. It can be concluded that increasing the spade degree is not conducive to particles being captured by the roller, thus reducing the grinding efficiency.

Particle size distribution under various spade degree.

Average particle size change with time under various spade degree.
The productivity of the finished particles obtained after 10 s of simulation and the yield are shown in Table 4, where it is possible to see that the productivity decreases from 35.25% to 9.75% with the increase of the spade degree. The actual yield increases by 1.82 t (20.36%) from 12° to 0° and by 2.76 t (25.65%) from 0° to −12°. Also the closer the spade is to the roller, the higher the yield of finished particles. The trend of the actual yield confirms the simulation results.
Finished product mass and yield with different spade degrees.

To further investigate the influence of the spade degree on the wear of the main duct, the energy spectrum of the tangential collision is shown in Figure 16. It can be seen that at high energy levels of collision (0.398 J and above), the difference between the three groups is not obvious. However, at low energy levels, the difference between the tangential collisions of the three groups is considerable. The cumulative power is lowest at the −12° spade degree and highest at 0°. From the cumulative power spectrum, it can be seen that as the spade degree increases, the wear on the main duct first increases and then decreases slightly. It can be concluded that the maximum wear of the main duct occurs when the spade degree is around 0°. Combined with Figures 12 and 16, under complicated wind conditions, tangential particle collisions on the main duct are mainly caused by high-frequency small particle collisions and low-speed friction of large particles.
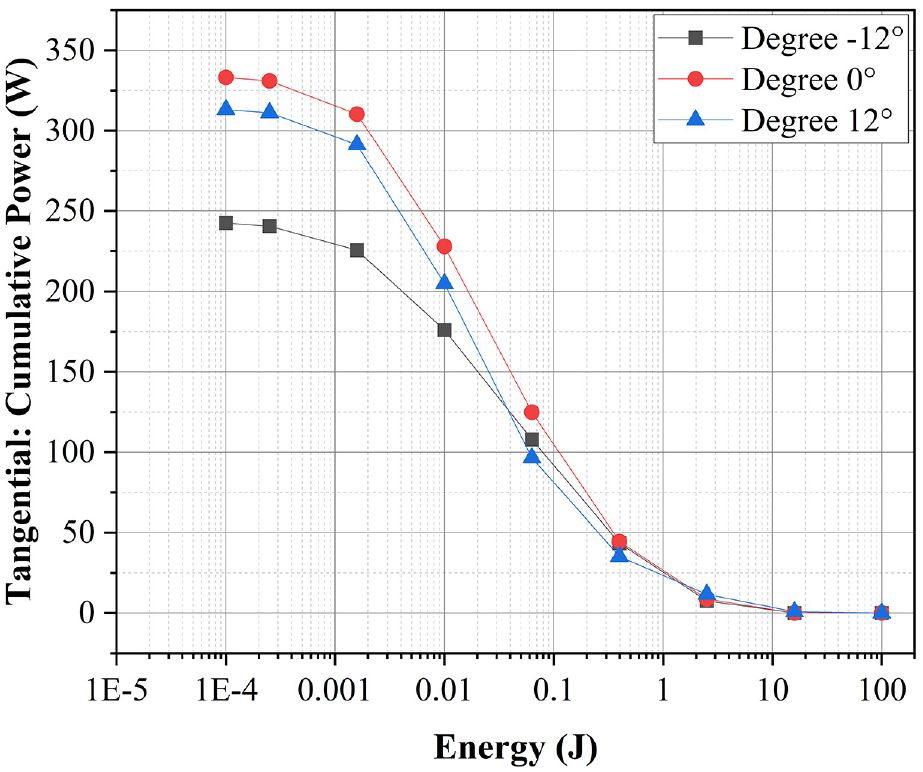
Cumulative power spectrum of tangential collision between particles and main duct with different spade degrees.
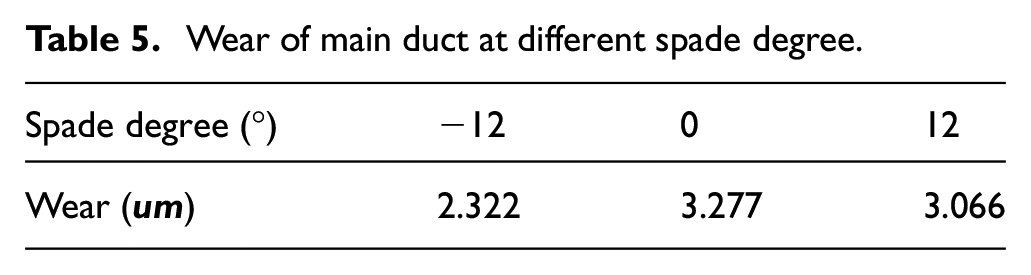
After a 10 s simulation, the wear of the main duct is shown in Table 5, which shows that the wear loss of 0° is the highest, reaching 3.277 μm, while the lowest is only 2.322 μm with a spade degree of −12°. The main reason for the difference in wear is that at different spade degrees the particles are captured by the grinding area with different efficiency. When the spade is close to the roller (−12°), the particles enter the grinding area in an easier way, so the number of particles entering the main duct is smaller. When the spade is far away from the roller, the particles are difficult to be caught, the probability of entering the main duct increases, so the overall yield decreases and the wear of the main duct increases.
Wear of main duct at different spade degree.
Wind field effect for particles motion
The wind field provided by the mill blower, which not only plays a key role in particle collection, but also plays an important role in particle motion, especially the probability of particles entering the main duct. The wind velocity of air inlet is used as an investigation factor in the design of the response surface test. The internal wind field velocity cloud diagram of the blade area is shown in Figure 17(a) to (c), with wind velocities of 38, 42, and 46 m/s in the air inlet, respectively. Average values of wind velocity are calculated as 17.75, 18.82, and 20.62 m/s of blades of main duct, respectively, and the blue blocks represent low-velocity vortex areas, vortexes impede smooth passage of wind fields.

Velocity cloud diagram of internal wind field in blade area at: (a) 38 m/s, (b) 42 m/s, and (c) 46 m/s.
According to the co-simulation of Fluent and Rocky DEM, the particle distribution of the main duct is shown in Figure 18 (including the particle distribution and the wind velocity cloud in the blade area). Most of the particles (shown as red) enter the blades from a low wind velocity position, and a large amount of particles accumulate in the blue vortex area, causing the following cumulative wear.

Particles distribution in blades of main duct.
Response surface analysis and optimization
According to the above analysis, spindle speed (A), spade degree (B), and air inlet wind velocity (C) are set as three parameters for response surface analysis. The co-simulation of Fluent and Rocky DEM was adopted, and productivity (M) and wear (N) of the main duct were taken as target parameters, and the results are shown in Table 6.
Response surface simulation results.

With the above simulations, mathematical models between M/N and researching factors are obtained, and significance data is shown in Table 7. Response surface equation is shown in formulas (19) and (20).


Parameter correlation analysis.
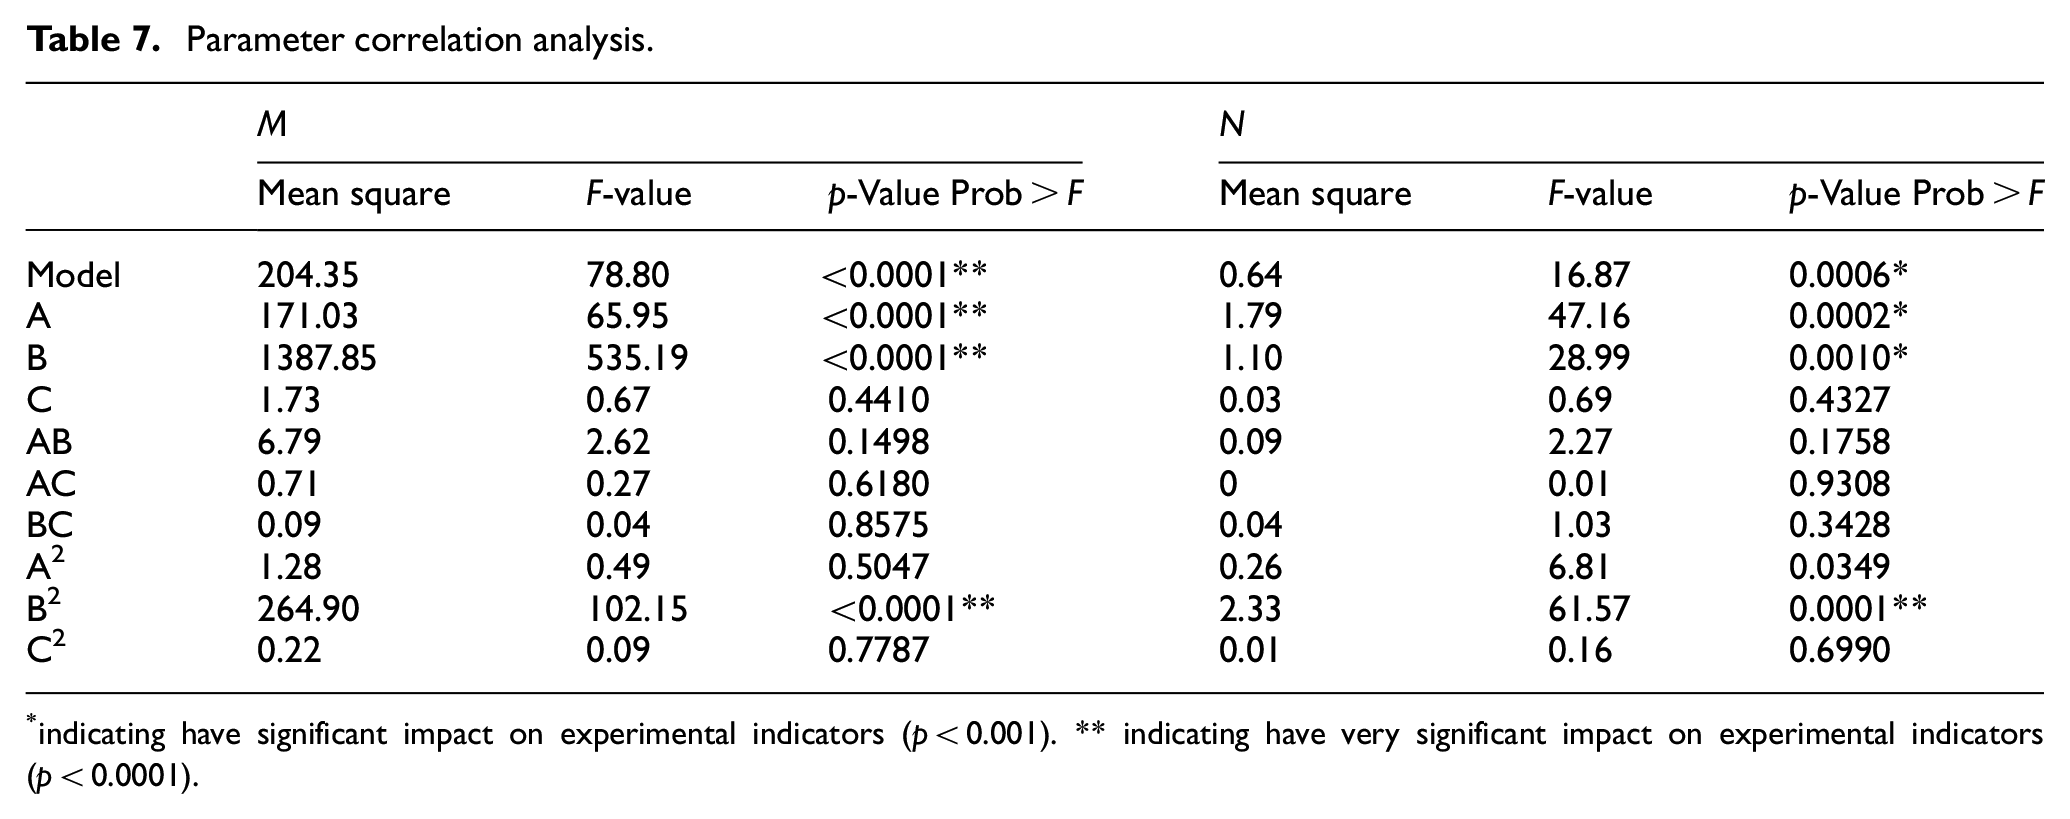
indicating have significant impact on experimental indicators (p < 0.001). ** indicating have very significant impact on experimental indicators (p < 0.0001).
The response surface is obtained in Origin 2019b, which is shown in Figures 19 and 20. As shown in Figure 19, the degree of influence on M from large to small is spade degree, spindle speed, and wind velocity in air inlet. As the spade degree decreases, the spindle speed increases and the wind velocity in the air inlet decreases, and M shows an upward trend. In Figure 20, it is clear that the degree of influence on the amount of N is in the order of spindle speed, spade degree, and wind velocity. During the process of increasing the spade degree, N first increases and then decreases; with the reduction of the spindle speed, N shows an upward trend; with the increase of the wind velocity, N first increases and then decreases. It can be seen that the wind velocity in the air inlet has a relatively small effect on two target values.

Response surface of productivity (M): (a) interaction A&B, (b) interaction A&C, and (c) interaction B&C.

Response surface of wear (N): (a) interaction A&B, (b) interaction A&C, and (c) interaction B&C.
Multi-objective optimization analysis is carried out with the goal of reaching the highest M and the lowest N, as shown in formula (21).
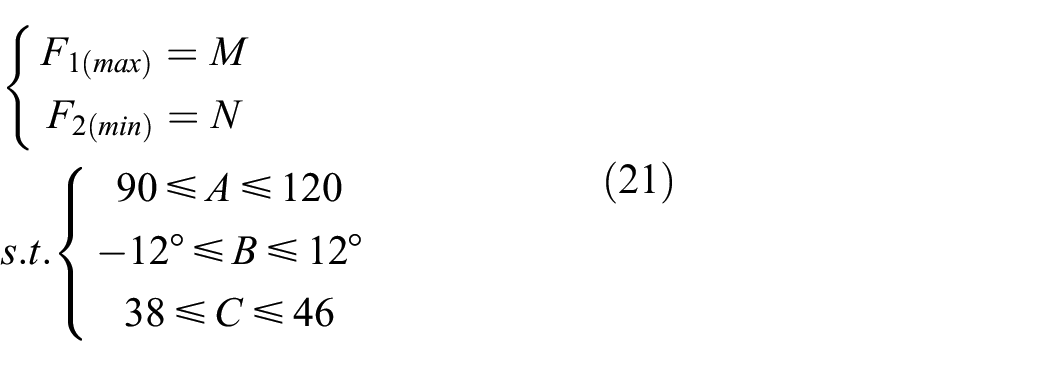
According to the above response surface formulas, the optimum scheme is a spindle speed of 110 rev/min, a spade degree of −12°, and a wind velocity of 46 m/s. Based on the optimum parameters before co-simulation verification, the result is listed in Table 8, the error between simulation and response surface result of M and N is less than 8.3%. The reliability of the response surface is high and can play a leading role.
Comparison of optimization results and simulation results.

Furthermore, compared with original parameters (spindle speed of 110 rev/min, spade degree of 0°, and wind velocity in air inlet of 42 m/s), M of optimized parameters is increased to 44.82%, while N is reduced to 1.519 μm.
According to the optimization results, the mill was adjusted for trial production and the raw material selected as limestone. The particle size analysis before and after optimization was carried out using a BT-9300T laser particle size analyzer. The particle size content curve is obtained as shown in Figure 21. It is clear that the optimized mill grinds a smaller and finer powder size. The actual yield also increased from 10.76 to 14.33 t/h, an increase of 33.18%. So the research is more useful for setting the working parameters.

The particle size content curve and cumulative content table before and after optimization.
Conclusions
The paper uses a combination of theoretical analysis and CFD and DEM co-simulation to investigate the three main factors (spindle speed, spade degree, and wind velocity) that influence grinding efficiency and main duct wear. The influence of each parameter is determined by means of single-factor simulation experiments; the multi-objective optimization of the parameters is carried out by means of response surface simulation experimental design to guide the production practice.
The research was initially based on a theoretical-analytical approach. The spindle speed affects the grinding force of the pendulum mill and the throwing height of the particles, thus affecting the grinding efficiency; the spade degree determines the trajectory of the particles in conjunction with the spindle speed, thus affecting the grinding efficiency; the wind introduced from the air inlet acts as an air conveyor and is used in conjunction with the classifier to collect the finished particles of acceptable mesh size. Wind velocity has a small effect on grinding efficiency but a large effect on main duct wear, which determines the number of particles entering the main duct and the amount of kinetic energy available to the entering particles. Both the greater the number of particles entering the system and the greater the kinetic energy of the particles, the greater the wear will be.
Secondly, by means of CFD-DEM co-simulation, the specific laws of the above factors can be further determined in order to simulate the actual operating conditions of the mill, and more intuitive and digital analysis results can be obtained. The grinding efficiency can be analyzed by extracting the results of collision frequency and normal collision energy from the simulation in Rocky-DEM software; the main duct wear can be analyzed by extracting the wear volume data and cumulative power spectrum of tangential collision between particles and the main duct.
For limestone particles, the grinding efficiency increases as the spindle speed increases within the speed range of 90–120 rev/min. When the spindle speed increases from 110 to 120 rev/min, the grinding efficiency increases less. And wear decreases as the spindle speed increases, within the speed range of 110–120 rev/min, the amount of wear decreases significantly as the speed increases. Changing the spade degree can have a significant effect on both grinding efficiency and wear according to the simulation analysis. As the degree decreases, the grinding efficiency increases significantly; the wear amount of the main duct increases from −12° to 0°, and decreases from 0° to 12°; the wear amount of the main duct is lowest at −12°. The results of the wind velocity influence law are consistent with the theoretical analysis. In the wind velocity range of 38–46 m/s, there is only a small variation in the grinding efficiency; the wear amount shows a small increasing trend at first and then decreases, which is highest at a wind velocity of 42 m/s. As the role of the air field is primarily to complete the transport of the finished particles to the classifier, its correct selection must take into account the fineness of the finished product, energy consumption, and wear. This work will be further developed in subsequent research of the whole mill.
Finally, according to the optimization results of the response surface test, the maximum grinding efficiency and minimum wear can be achieved when we set the spindle speed, spade degree, and wind velocity to 110 rev/min, −12°, and 46 m/s respectively. We verified the growth trend of the actual yield for limestone grinding, the actual yield increased from 10.76 to 14.33 t/h, an increase of 33.18%. The CFD-DEM co-simulation is of great importance for the optimization of structural and operational parameters of mining machines such as pendulum mills.
Footnotes
Handling Editor: Chenhui Liang
Author contributions
Wei Lu: Conceptualization, Methodology, Investigation. Zhipeng Yao: Conceptualization, Methodology, Software, Writing – original draft, Writing – review & editing. Jia Yao: Writing – review & editing, Investigation, Conceptualization. Shenglong Meng: Software, Conceptualization. Xuemei Li: Supervision. Gangwei Shi: Software, Conceptualization.
Declaration of conflicting interests
The author(s) declared no potential conflicts of interest with respect to the research, authorship, and/or publication of this article.
Funding
The author(s) disclosed receipt of the following financial support for the research, authorship, and/or publication of this article: This research is financially supported by Guangxi Science and Technology Major Special Project (Project No.: Guike AA230223017) of China; Guangxi Key Laboratory of manufacturing system and advanced manufacturing technology (director Fund) project (Project No.: 22-35-4-s007) of China; Guangxi postgraduate joint training base project in 2021 (GSD (2021) No. 6) of China.