
Abstract
Solid state joining techniques are increasingly used in joining different types of materials, in this work TP347HFG austenitic stainless steel will be welded with HiPerFer ferritic stainless-steel alloy due to their similarity in their properties to some extent after making heat treatment to ferritic alloy in addition to difference in their cost which save for economic reasons. In this work, a three-dimensional finite element model was developed. The thermal analysis and profiles between process parameters were predicted by using an ANSYS software tool. Design of experiments by Anova was used to examinate the simulation results and to evaluate contribution ratio of each parameter on responses, while grey relational analysis was used to specify the optimum trial. It was observed that trial 11 give best results (A4B2C1D1) which got higher grey relational grade. It was concluded that the friction pressure and friction time have more impact on interface temperature, whereas forging pressure and friction time affect the equivalent Von-Mises stress directly. The speed and forging pressure have a more influence on total deformation. It was also concluded that the temperature was fade out by diverging toward the end of specimen and the amount of decrease in temperature is less in ferritic side. The amount of flash extruded from both steels are approximately similar due to similarity in properties as heat treatment of ferritic alloy had been achieved. The investigation results show that trial 8 achieved highest Von-Mises stress (300 MPa) while trial 7 induced lower stress (255 MPa), maximum deformation was found equivalent to 0.012 mm with trial 16 whereas, it was found (0.008 mm) with trial 11 which were both less than the allowable deformation in end application. Tensile strength of weld joint was found equivalent to 80% of softer base metal. The hardness of optimum trial was equivalent to 156 HB.
Introduction
Continuous drive friction welding is a solid-state welding technique which is used to join similar and dissimilar materials. 1 This joining technique is characterized by short cycle time, low heat input, and narrow heat affected zones. The friction welding is proven technology to weld dissimilar metals. Dissimilar welding of ferritic and austenitic stainless steel in general can be considered one of the important methods to gain better and satisfactory quality of weldment. 2 Presently, the welding of dissimilar materials has extensively improved for industrial applications, 3 steam power plants is one of these applications that dissimilar friction welding is necessary to be used 4 due to differs of conditions in boiler tubes, there are high temperature tubes and low temperature tubes in boiler of steam power plant, so using of two types of materials can save more economically due to unstable Nickel prices overall the world. Such combination of dissimilar materials is commonly found at high-temperature applications such as energy conversion systems. For example, central power stations include boiler sections made from ferritic stainless steels operating at low temperature. The section is usually connected with another section made from austenitic stainless steel which operates at higher temperature. Therefore, the transition occurs through a dissimilar weld between these two materials. Another typical example of such joints is commonly found in TiCl4 reduction retorts where ASS due to good creep strength and oxidation resistance at higher temperatures is dissimilarly welded with FSS to avoid the leaching of nickel by molten magnesium. 5 TP 347 HFG is one of the stabilized stainless steels which contain Niobium Nb, have strong affinity with carbon than Cr and thus results in NbC. The formation of NbC could help in avoiding chromium impoverishment due to the chromium carbide precipitation and in fact, the sensitization could be controlled. 6
A niobium – containing, creep resistant austenitic TP347 HFG steel with applied fine – grained microstructure has been widely used in the power generating industry and in the chemistry industry. It is used as piping and super-heater tubes in steam power plants and boiling water reactors, because of its good mechanical properties and corrosion resistance. 7 Weldability of steels, including austenitic creep-resisting steels, is an important criterion of their application in power engineering, in the construction of new power units and repair of the serviced ones. 8
Heat resistant steels for thermal power plants have been developed in order to reduce CO2 emissions, resulting in ferritic and austenitic steels could be used at higher temperatures. During friction welding process, the temperature of workpieces raises very rapidly at interface to values nearing the melting range of the materials. Welding occurs under the applied pressure when heated zone reached the plastic deformation. The combined addition of Nb and W to ferritic alloy, provides increased solid solution and precipitation strengthening by (Fe,Cr,Si)2(Nb,W)-Laves phase particles of ferritic, 17 wt.% Cr stainless high performance ferritic (HiperFer) steel. The ferritic alloy used in this article is proposed as a candidate steel for future structural application up to approximately 680°C in power engineering and the process industry 9 due to providing high steam oxidation, wet corrosion, and thermal fatigue resistant. 10
Friction stir welding process with a little deviation of welding tool nearby the ferritic sample, was used to join AISI 430 ferritic with AISI 304L austenitic stainless steels, a defect-free joint was obtained at ferritic sample side under a tool rotational speed of 560 rpm and welding speed of 50 mm/min, the yield strength of the joint was also found comparable with that of the austenitic sample against decreasing in elongation percent resulted from deformation resistance. 5 In another investigation 11 when high temperature application is required to be used, it was found that the tensile properties of dissimilar welding between reduced activation ferritic – martensitic steel and 316 L austenitic steels at 550°C were as follows: The yield strength of the joint is around 250 MPa, and the ultimate tensile strength of the joint surpasses 450 MPa which is approximately equal to that of 316 L base metal, in addition to exhibiting good ductility reach to 17% in 550°C tensile tests, this surely improve the successful of dissimilar weld joint by using solid state welding methods in such application. The position of specimens in friction stir welding has also an effect on strength and elongation. 12 Placing austenitic stainless steel on advancing side is more suitable for friction stir welded dissimilar austenite-ferrite stainless steels, the ultimate tensile strength and elongation were found larger than its values when placing the austenitic specimen in retreating side. The results show that the ultimate tensile strength and elongation of weld joint were equivalent to 92% of ferritic base metal and 20.4% respectively. Another investigation used friction stir welding technique to weld AISI 304L austenitic stainless steel with AISI 410S ferritic stainless steel, which showed convergence of simulation temperatures to that of experimental results. Positioning of materials in an unsuitable order led to heterogenous of mixing zone viscosity which in turn cause rise to voids and mixing materials letdowns, and the problems in mixing can be predicted via Volume of Fluid method (VOF) using the ANSYS-fluent simulator. 13 Friction welding conditions also has an effect on mechanical properties of the weld joint, in 14 a study has been achieved on effect of rotational speed and forging time on tensile strength and hardness of AISI 310 steel, they concluded that highest tensile strength of the friction welding was obtained at 1800 rpm and 45 s, which equivalent to 90% of base metal strength, in addition to the higher hardness will be obtained. It is obtained in another study 15 that the increase in joint strength of UNS S31803 tubes with increasing upset load and heating time is observed. The maximum joint strength equivalent to 80% of base metal strength was achieved at upset load of 1200 kg and heating time of 20 s which are the most effective parameters in welding such material. Friction welding process was also used in welding super duplex stainless steel UNS32750, 16 and it was reached to the facts that friction load had significant control on the welded specimen’s tensile strength and hardness, whereas the forge load has minimal influence on the weld mechanical property, and by depending of grey relational analysis GRA results, the optimized parameter combination in order to achieve better tensile strength and hardness is 800 kg friction load, 5 s friction time, 1000 kg upset load and 7 s upset time. The optimized parameter in Kumar and Palani 17 was found out for welding of SS304 tubes (19 mm outside diameter and 2 mm thickness) with heating pressure 143 MPa, upset pressure 143 MPa, heating time 22 s and upset time 4 s and it was observed that tensile strength of the joints increased with the increase in upset pressure and heating pressure, larger joint strength than that of base metal was achieved and hardness of 210 HV for above parameters. Three friction times (6.5, 8.5, and 10 s) with two directions for a study 18 were used in direct drive friction welding of AISI 316; the first direction was achieved by forge phase elimination and the second was performed under forge phase application. As a conclusion, flash formation was decreased about 30% without forge compared to forge application. At shorter friction time for the two directions, ultimate tensile strength (UTS) and ductility were revealed closer to AISI 316 base metal. In another investigation 19 the developed model helps in identifying the best suitable process parameters for high tensile strength, improved impact toughness and hardness when welding AISI 430 ferritic steels by rotary friction welding process. An experiment was conducted by changing the four different parameters namely friction pressure, friction time, forging pressure, and rotational spindle speed. The results proved that good tensile properties and impact toughness can be obtained in high forging pressure. Joint efficiency of 98.23% is seen when joints are made with forging pressure 155 MPa and rotational speed 1200 rpm. Increase in forging pressure and reduction in rotational speed provide a high tensile strength.
The present article was carried out to study the effect of process parameters on weld strength, total deformation at interface, and thermal profile axially during the conventional rotary friction welding of the austenitic to ferritic alloy. The process of welding examined under different conditions of rotational speed, friction pressure, friction time, and forging pressure. The welding procedure was planned using Taguchi techniques; the frictional welding was modeled using 3D finite element analysis (FEA). 20 The simulation becomes an important tool in friction welding analysis because of short welding cycle.
The Novelty and application of this study include using dissimilar materials (TP347HFG austenitic stainless steel) and (HiPerFer ferritic stainless steel) in superheater and reheater boiler tubes of steam power plant. The study also led to depend direct drive friction welding process in welding boiler tubes. Fully ferritic steels had been used in steam power plant application which improved by choosing an appropriate Tungsten percentage and adequate heat treatment process, so ferritic mechanical properties will be approximately similar to austenitic steels. Finite element modeling by using Ansys software, statistics analysis by using Anova analysis to attain optimum parameters in the process, in addition to Taguchi analysis had been depended for design of experiments.
Materials and methods
Direct drive friction welding process was performed using a lathe machine type (TSL–1000 D, related to 1978) shown in Figure 1 in which several modification have been made to achieve the required task (hydraulic jack was replaced the tailstoke), suddenly stopped after shutting off, high pressure gage is used for measuring friction and forging pressures, the welding process was performed to join 35 mm outer diameter tube specimens, 7 mm thickness and 60 mm length of TP347 HFG and Hiperfer ferritic alloy. The chemical compositions of base materials are shown in Table 1, while Table 2 indicate the physical and mechanical properties of both materials. Facing operations were precede welding process to overcome surface impurities and roughness as shown in Figure 2. Figure 3 show the specimens during welding process.

Friction welding machine used in study.
Chemical composition of base material (wt. %).

Physical, mechanical, and thermal properties of base metals.


Facing operations before welding.

During heating stage of process.
Process parameters and levels used in rotary friction welding process RFW were according to Table 3. During the welding process digital thermometer (TA603C read till 1680°C) was used for measuring interface temperature in addition to thermocouples (type K) were also used for measuring temperatures along axis of rotation. The welding was carried out by placing TP347 ASS tube on rotating side while the ferritic tube was placed on stationary side. Figure 4 show the specimens before welding (a) and after welding process (b). Therefore, the specimens were cut longitudinally and prepared by conventional polishing methods for mechanical testing and required inspection.
Process parameters and levels.


Specimens subjected to friction welding process: (a) before welding and (b) after welding.
Mathematical modeling
The friction welding procedure follows the standard Coulomb’s friction law which relates shear stress at interaction and axial pressure 21 :

where, τf represents induced shear stress, μ is the friction coefficient, and P refers to axial pressure in MPa.
The heat generation Q through friction welding is specified by 22 :

Where γ is the sliding rate and η is the heat efficiency. In most of the cases heat generation in visco-plastic friction condition is considered.
The equation for thermal modeling of this problem is given by Fourier heat conduction phenomenon which is written as 23 :

where:
T: is temperature which is a function of x, y, z, and t.
k: thermal conductivity (W/m K)
ρ: is density (kg/m3)
Cp: specific heat capacity (J/kg K)
In case of welding two dissimilar materials and according to following boundary conditions: At X = L1 and X = −L2 there is no change in temperature at end of tubes (the end temperature equal to ambient temperature). At X = 0, q1 = µ P ω r + q2, and the temperature at interface will be the same for both tubes. Any constant’s values will be found for steady state, and by solving the above equation in z-direction, the amount of heat generation Q between contact surfaces will be estimated as:

Where:
ω: angular velocity (rad/s) = (2 π N/60) where N = rotational speed (rpm).
r: radius of tube (mm),
L: length of specimens (mm)
Finite element analysis
In this study, Ansys workbench (2021R1) software was used in transient thermal and structural analysis through friction welding of austenitic – ferritic stainless-steel tubes. 3D model of both alloys which has 35 mm in outer diameter and 7 mm wall thickness with 60 mm length were made using Ansys software as shown in Figure 5. The rotating part was austenitic steel while the ferritic steel was set on stationary side, and the friction heat is simultaneously conducted to the radius and the longitudinal directions. The calculation model had an axisymmetric body, and a hexahedrons isoparametric element with eight nodes was used since it was intended to perform simulation taking thermal and mechanical effects simultaneously into consideration, so this type of mesh is particularly important. This element has the capability to perform coupled thermo-structural analysis. The accuracy of finite element model always depends on meshing. Initially, the computations were done with coarser meshing. Though the solution was converged, the results obtained were not in the acceptable tolerance of experimental results. Later the mesh refinement was done until the solution was independent of mesh refinements and the solution could be within the range of acceptance. This mesh was considered to be the best one and it was selected for the simulations. The mesh size is 2.5 mm × 2.5 mm when the distance in the longitudinal direction was from interface line to 5 mm, and that was 5.0 mm × 5.0 mm from 5.0 to 60 mm length, medium smoothing is depend in quality, smooth transition inflation with transition ratio 0.272 and 20% growth rate. 6745 nodes with 1078 elements are used for both rotating and stationary parts. This welding technique is characterized by narrow heat affected zone hence a fine meshing was employed in a small region near the weld interface. A coarse meshing was used for the rest of the geometry to save the computation time. Figure 5 show the mesh size in contact regions and base metals and the dimensions of fine and coarse mesh.

Finite element modeling of friction welding.
The boundary conditions are chosen according to transient thermal analysis to be achieved as a first step keeping the ferritic hollow alloy stationary, while the austenitic steel was rotating (Figure 6). The coefficient of friction between contact surfaces assumed to be 0.4 applied at interface of both steels, convection heat transfer coefficient was applied on the surface of two tubes. The temperature distribution was evaluated. Thermal analysis was connected to structure analysis through which as the rotating specimen will get into stop, the stationary one will be exposed to axial forging pressure, which was allowed to move in axial direction. The structural analysis was carried out for the equivalent stress, total deformation. Design of experiments by using Taguchi techniques was carried out in analysis of friction welding process. The process parameters and their level are given in Table 3 which were chosen according to several trials made experimentally till reaching the higher strength. The tangential speeds in steels should not be less than 1.3 m/s in order to avoid increasing in torque and thus metal tearing and inconsistent upset, the speeds used in tubular specimens usually being larger than solid bars. The pressure should be highly enough to avoid oxidation of faying surfaces, the low pressure will also avoid occurring axial shortening while increasing in upset pressure will tend to improve joint quality. The friction time should not exceed its appropriate values in order to avoid negative effects on joint properties, the insufficient time will also lead to unbonded area at interface. Forging time is assumed constant (tu = 5 s). The orthogonal array (OA), L18 was chosen for the present work. Table 4 gives the specifying of factors in columns.
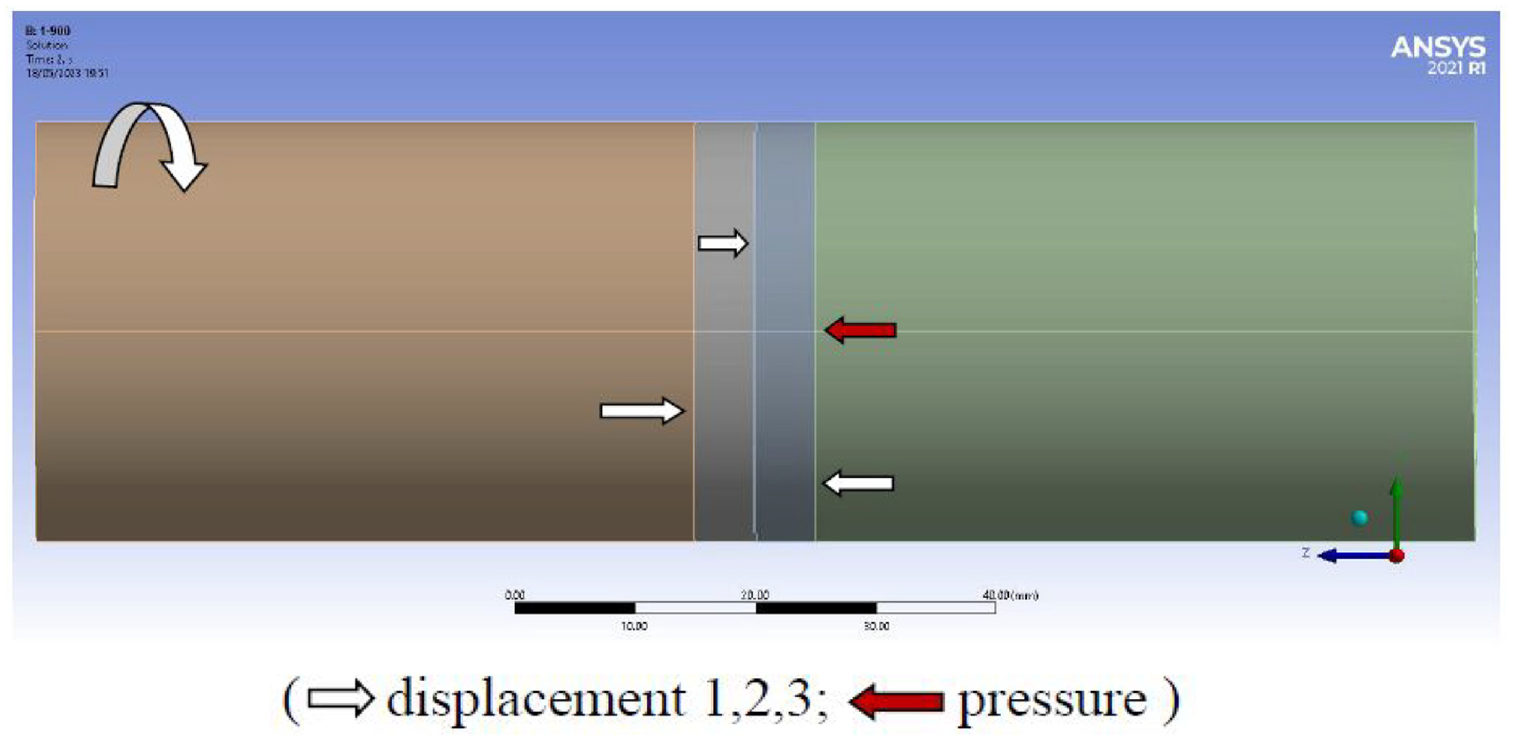
Boundary conditions.
Orthogonal array (L18) and control parameters.

Methods of analysis
In GRA, the experimental knowledge will be normalized, and by using the normalized data, relational coefficient is evaluated, then obtaining Grey relational grade by averaging the grey relational coefficients GRC values associated to nominated experimental results.
GRG may be classified into particularly; Smaller the better, Larger the better, or Nominal could be a better (NB) criterion. The preferred quality characteristics for Final Maximum interface temperature, equivalent Von-Mises stress, and total deformation are Smaller the better criterion, and then it’s expressed by using equation 24 :

Where i = 1, …m; k = 1, 2, 3, …n; m = no. of experimental data; n = no. of factors; yi(k) = original sequence; yi*(k) value after Grey relational generation; min yi(k) and max yi(k) are the minimum and maximum value of yi(k), respectively. The calculation for Grey relation coefficient was done using equation 24 :
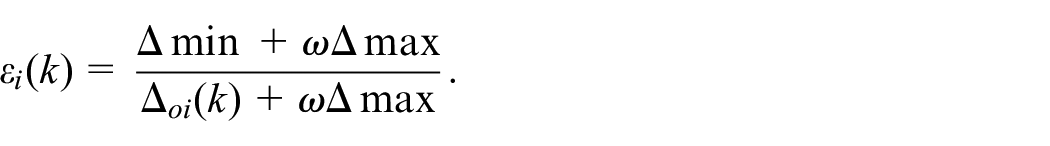
Where εi(k) is the grey relation coefficient; Δoi is deviation among yo*(k) and yi*(k); yo*(k) = ideal (reference) sequence; Δmax = highest value of Δoi(k), Δmin = least value of Δoi(k). The Grey relational grades (GRG) (Γ i ) are determined by taking average of the GR coefficient related to every observation as given in equation 24 :

Where, Q = total quantity of responses and n denotes the quantity of output responses.
The next step is determining the ideal factor and its level grouping. The higher grey relational grade indicates the better product quality; therefore, on the basis of grey relational grade, the factor effect can be estimated, followed by determining the optimal level for each controllable factor. According to the investigation, the higher grade is related to trial 11 in which its value is equal to 0.970223. Then ANOVA analysis will be performed to identify significant factors. The main purpose of the analysis of variance (ANOVA) is the application of a statistical method to identify the effect of individual factors. 25
Results and discussion
According to boundary conditions used in software analysis and the meshing condition was repeated 2–3 times in order to decrease the amount of error, thus reaching acceptable parameters of the process. Anova analysis was carried out so percentage of contribution of each parameter on each response was been evaluated.
Effect of factors on interface temperature
Table 5 provide us with summary of temperature at interface, it can be concluded that friction pressure and friction time had great influence on temperature variation due to its high levels of contribution percentage 77.73% and 10.56% for friction pressure (B) and friction time (D) respectively, followed by forging pressure and rotational speed which had less contribution on interface temperature of the process.
ANOVA analysis of maximum interface temperature.

The temperature generated in the tube welding was directly depended on frictional pressure and friction time as shown in Figure 7, high temperature resulted at interface due to high frictional pressure and time on tubes. Trial 3 provide the highest temperature (1275°C) in which the friction pressure and friction time were respectively (130 MPa and 15 s) while trial 1 lowest temperature was generated (585°C) in the tubes in which the friction pressure and friction time were respectively (30 MPa and 5 s).

Influence of friction pressure and friction time on interface temperature.
Figure 8(a) shows temperature distribution along rotational axis of both tubes during the welding process through which it can be seen that the ferritic side suffer of higher temperature than the austenitic side due to higher thermal conductivity at higher temperatures (which is equivalent to 26–32 W/m K for temperatures 600°C–900°C) comparing with austenitic side (which is equivalent to 22.6–24.6 W/m K for temperatures range 600°C–750°C), it can also observe the maximum values of temperature concentrated around the interface due to supplied pressure.

Temperature distribution along rotating axis: (a) for all trials and (b) at N = 900 rpm.
The larger pressure also ensures good contact between the surfaces which in turn lead to increasing the temperature due to enhancing amount of contact area. Figure 8(b) show the difference in maximum temperature at interface clearly and the temperatures values far away from interface toward both materials through which can see the amount of decreasing of temperature is higher in austenite side, may attributed to the fact that rotational specimen loss heat during rotation comparing with stationary specimen.
The amount and shape of flange can be revealed from photographs in Figure 9 which show the macrostructure of trials 1 and 3. The difference in flash thickness was indicated clearly in both side in addition to, radial extrusion of flash appears in both images. It can also observe that formation of flash depends on mechanical properties of the base metals at deformation temperature. Due to differences in yield strength of both materials with temperature, this led to difference in thickness and amount of flash formed in weld joint for both images (a) and (b) of Figure 9.

Friction welding joint photograph showing the flash condition on both sides: (a) trial 1 (induced lower interface temperature) and (b) trial 3 (induced higher interface temperature).
Effect of factors on equivalent Von-Mises stress
Table 6 specified analysis of the equivalent stresses. The welding factor which was highly acceptable according to Anova analysis is forging pressure (C) followed by frictional time (D). The other two parameters (speed and friction pressure) had minor contributions, respectively 0.71% and 0.43% to the variation in equivalent stresses.
Anova analysis of equivalent stresses.
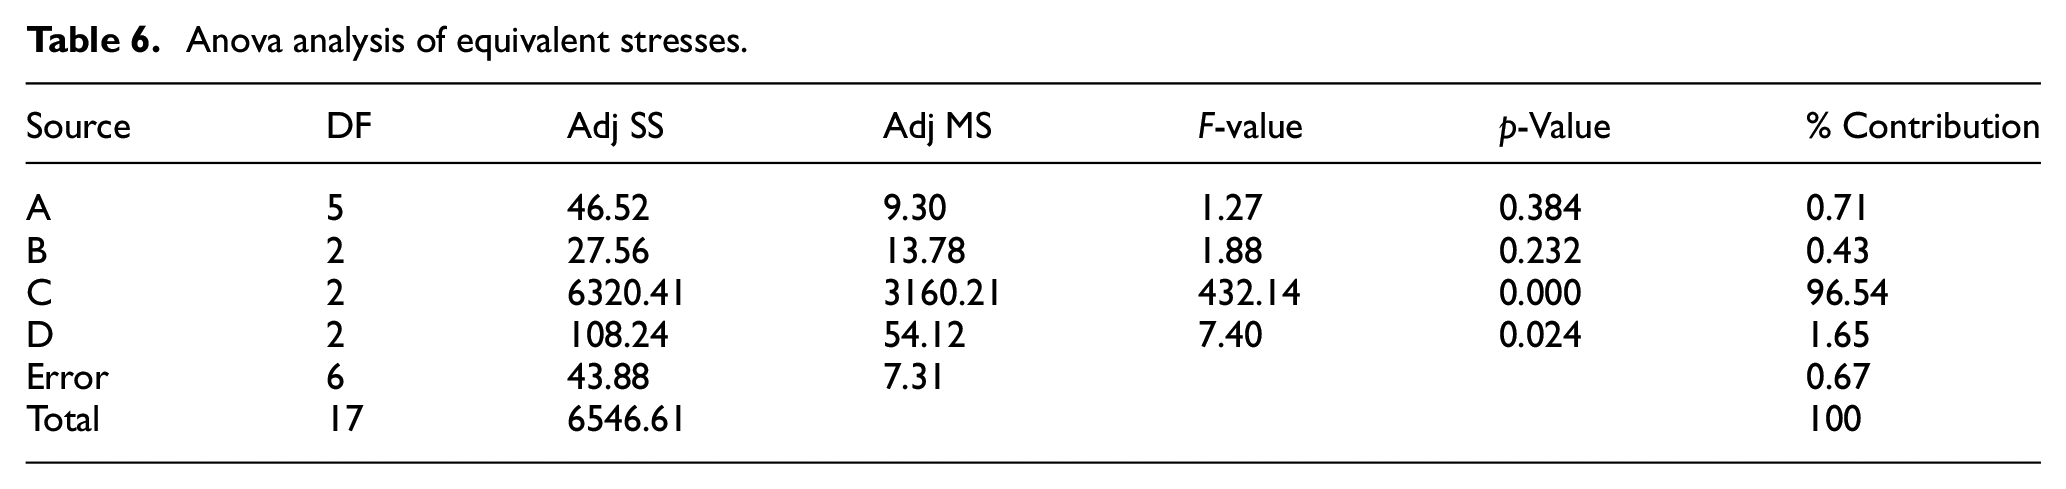
By increasing forging pressure and friction time, the equivalent Von-Mises stresses will be increased due to increasing in grain refined region in contact surfaces which was the result of recrystallization. The forging pressure applied on non-rotating tubes of ferritic alloy led to develop residual stresses on this side. The high amount of heat and pressure applied along the interface between austenitic and ferritic alloy, significant plastic deformation will be generated. Trial 8 had resulted the highest stress (300 MPa) while trial 7 induced lower stress (255 MPa) in the tubes, as shown in Figure 10. In heating stage when friction pressure supplied to the ferritic alloy a visco-plastic ferritic is formed and during forging stage there is a thermo-plastic deformation of ferritic in interface between faying surface, this in turns will tend to form of flash from both inside and outside surfaces of the tube. The joining occurs because of plastic and dissemination effects.

Influence of: (a) forging pressure at N = 900 rpm and (b) friction time at N = 1300 rpm on equivalent stresses.
In Figure 11 which represent longitudinal half sections of welded tubes for all trials, it can be seen at interface regions the amounts of Von-Mises stresses is tend to be lower than the stresses in distances far away from interface, this attributed to increasing temperatures at these regions which accompanies with decreasing of yield stress and in turn the Von-Mises stresses will decrease. It is observed from Figure 11 (trials 1, 2, and 3) that the amount of Von Mises stresses at interface was found 105.41, 124.77, and 133.14 MPa respectively and at a distance of 3 mm from interface toward the austenite specimen it is found 131.77, 142.59, and 166.42 MPa for the above three trials. The amount of flash at austenitic stainless-steel side is seen to be larger due to higher specific heat capacity comparing with ferritic alloy side, this can be seen in all trials in Figure 11 except trials 1 and 6 in which the amount of flash is approximately equal, this was due to low frictional time (5 s) and low rotational speed. When the speeds exceed 1100 rpm the flash turn to appear larger in austenitic specimen side. The temperature profile also shows different distribution in both sides due to different in mechanical and physical properties of both materials. Concerning the extruded flash formed at interface it is observed that inner and outer side of tube subjected to flash formation due to temperature flow from both sides, and the amount of flash formed in peripheral surface of tube is start to form at beginning then followed by extrusion from inside at the end of welding process, this can be observed in all trials which is related to larger torque generated during rotation at outer surfaces which in turn resulted in larger amount of flash generated at outer diameter than inner surface of interface, due to higher temperatures at peripheral surfaces of tube comparing with inners. Form the same figure it can also found an asymmetric longitudinal features due to variation in behavior of both dissimilar steels at high temperature. At heating stage of welding process, and along axial direction, it can observe an increasing of Von Mises stresses on both material sides and then the stresses will be going to decrease far away from interface region, in all trials of Figure 11 the increasing of these stresses will be limited to austenitic side then will turn to decrease till the end of specimen, while at ferritic side and far away from interface the Von Mises stresses will just be limited to decrease toward the end, this behavior attributed to lower thermal conductivity and high thermal expansion of austenitic alloy comparing with other alloy, so during the heating process the regions near the interface still not reach to a temperature which allow decreasing in yield stress and this lead to increase the values of Von Mises stresses at these regions. Because the temperature at peripheral surfaces is higher than inner interface surface, the amount of stress on inner interface surfaces is higher than that on peripheral, this can be observed in all cases. The difference in stresses between inner and outer surfaces looked to be larger in trials 1 and 11 of Figure 11 (equivalent to 42 MPa for trial 1 and 43 MPa for trial 11), due to lower values of forging pressure and friction time which allow the outer surfaces to be hotter than inner surfaces and the lower forging pressure not permit all interface heat to be converted to shortening in length and extrusion of metal from interface, while in trials 3 and 10 the difference seen to be lower because the forging pressure is the highest with larger value of friction time. A larger heating time will lead to equalize the temperature between inner and outer surfaces and this cause the Von Mises stresses to have less difference values between the surfaces, (which in trial 3 is equal to 14 MPa, and 9 MPa in trial 10). In forging phase, the maximum Von Mises stress decreases. The higher stresses related to higher yield stress at regions near the interface due to lower temperature comparing with interface temperatures values.

Equivalent stresses values under different trials.
The increasing of stress at the beginning of welding process is related to higher resistance of contact surfaces that are going to soft gradually after reaching steady state value which lead to decreasing the stress value, it can also observed that the amount of decrease in ferritic side is larger than the austenitic side due to higher sensitivity of its yield strength to temperature resulted from higher thermal conductivity of ferrite and rapid increasing of its specific heat at higher temperatures, while the less decrease in Von Mises stresses in austenite related to higher strain rate of austenite to the temperature, this is responsible for the first reduction of interfacial stress as plastic deformation will begin.
Macrostructure images in Figure 12 appear the flange shape in lower equivalent Von-Mises stress Figure 12(a) and higher stress in Figure 12(b), the lower pressures in trial 7 comparing with trial 8, lead to large expelling of inclusions radially against less wide longitudinally especially for austenitic side due to its low thermal conductivity, but the increasing of friction time in trial 8 accompanied by increasing of pressures lead to rise waste in heat generated between surfaces and this resulted in decreasing the amount of flange predicted to be revealed in trial 8.

Friction welding joint photograph showing the flash condition on both sides: (a) trial 7 (induced lower Von-Mises stress) and (b) trial 8 (induced higher Von-Mises stress).
Effect of factors on total deformation
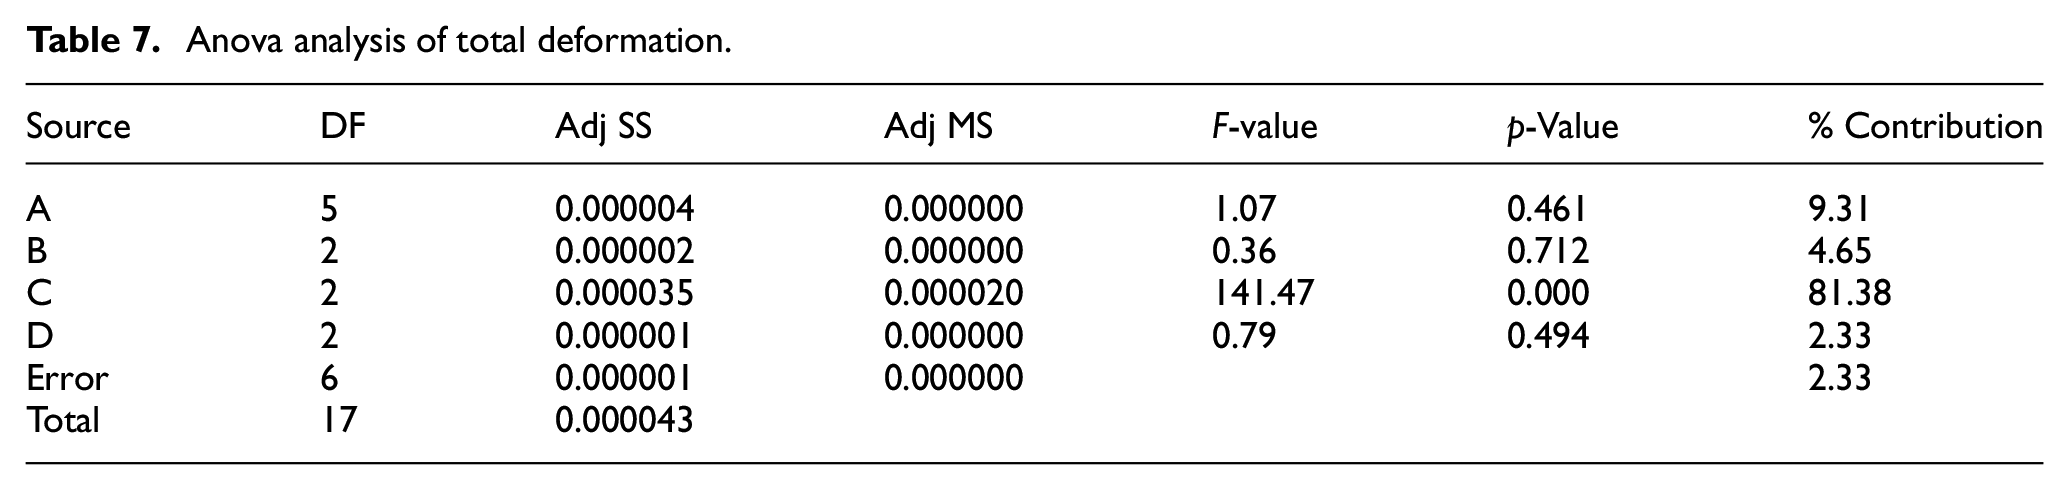
According to Anova analysis of total deformation and the effects of parameters shown in Table 7, the main factors which have more influence on total deformation were rotational speed (9.31%) and forging pressure (81.38%), the other two parameters have less influence on deformation. The total deformation increased with increasing in rotational speed and forging pressure as shown in Figure 13. It was seen that the deformation had higher values near the contact surfaces and toward the ferritic alloy specimen, and their values going to decrease toward the austenitic alloy. The flush is formed near the frictional surfaces and its amount look to be higher slightly in austenitic alloy tubes due to chemical composition and heat treatment of the ferritic alloy which lead to improve their mechanical properties to be similar to some extend to austenitic alloy, where the elastic modulus of ferritic and austenitic alloys was 220 GPa, 195 GPa respectively, also the differences in thermal conductivity and specific heat capacity of both alloys were the most reason of variance in total deformation. The maximum value of total deformation was found with trial 16 (0.012 mm) whereas it was (0.008 mm) with trial 11 as shown in Figure 8.
Anova analysis of total deformation.
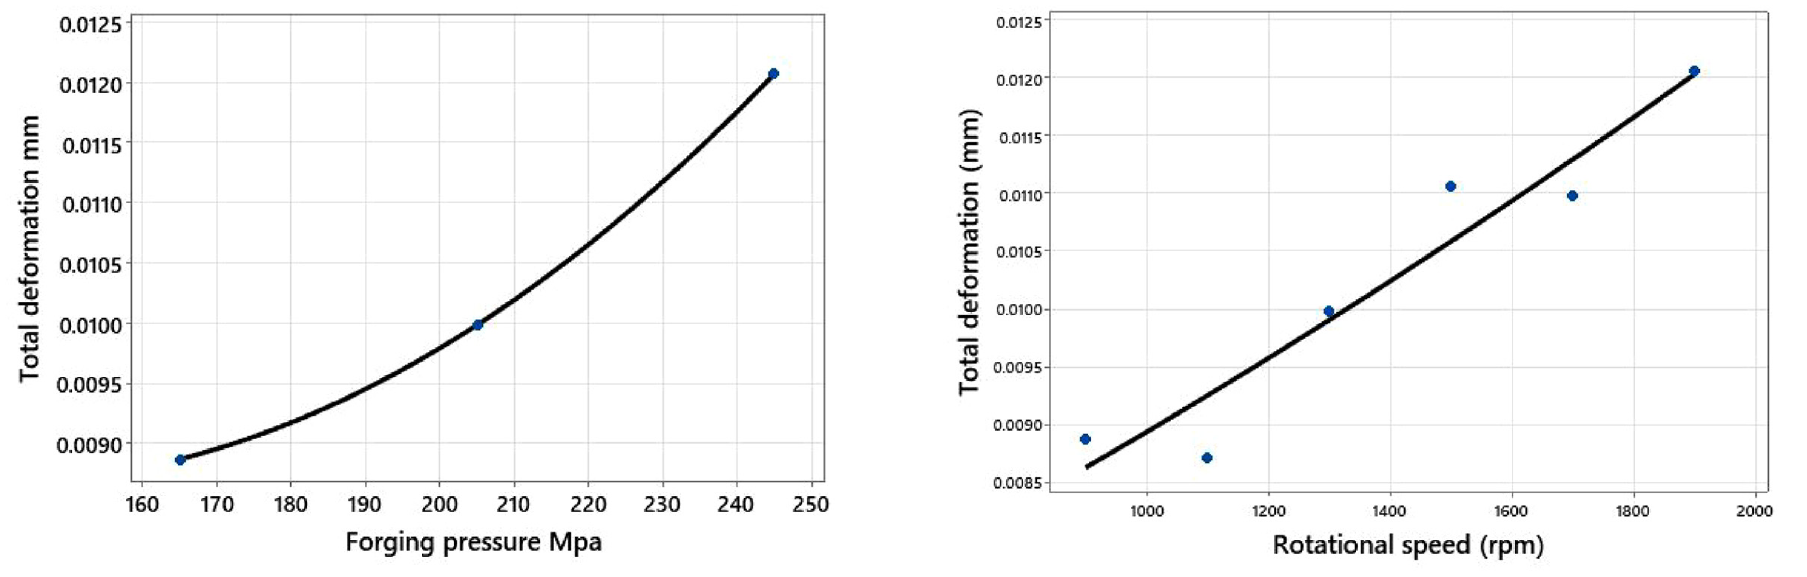
Effect of forging pressure and friction time on total deformation.
From simulation results shown in Figure 14 it can be concluded that in rotational speed of 900 rpm (trials 1, 2, and 3), an increasing in friction and forging pressures synchronized with increasing of friction time resulted a higher difference in total deformation with proceeding of process, and this variation start from the beginning of the friction process. In trials (4 and 7) and comparing with trial 1, the speeds are variable in each trial, the friction pressure is constant while forging pressure differs at trial 7, this lead to increase the deformation at forging stage while little difference in deformation had seen at heating stage. At constant forging pressure, when the speed will increase accompanied with decreasing in friction pressure, no change in deformation had been seen. The increasing in rotational speeds and pressure boost the conversion efficiency of mechanical energy to heat efficiency during the process and this in turn lead to improving the plastic deformation behavior. From Figure 14 it is observed that (trials 3, 8, 10, 14, and 16) have larger amount of deformation equivalent to 0.012 mm, and the deformation values looks less in trial 6 and the least values seen in trials 11, 15, and 17 which is equivalent to 0.008 mm, the larger deformation values related to higher forging pressure in above trials. Larger values of deformation also observed in ferritic side comparing with austenitic side this attributed to higher thermal conductivity of ferritic alloy at higher temperatures in addition to lower yield stress, and this is why higher amount of flash produced at austenitic specimen when comparing with ferrite in most trials of Figure 14. In another words, the deformation of ferritic alloy is seen to has axial mode than radial, so the axial shortening on the Hiperfer alloy side was more than that on TP347HFG alloy side. It was also found in most trials that the thickness of extruded flange generated at ferrite specimen is larger than its thickness in the other alloy. Radially, it is noteworthy that higher amount of deformation was seen at outer surfaces then tend to decrease toward inner surfaces, because of higher temperatures concentrated at outer surfaces.

Total deformation values under different trials.
From Table 2, the mechanical properties of the softer materials (which in this case is Hiperfer ferritic alloy), the yield strength at ambient temperature is equivalent to 230 MPa, and the elastic modulus is equal to 220,000 MPa. According to both stress-strain relation and strain-deformation relation:
E = (σ/ε), ε = 0.00105, ε = (deformation δ/original length). In this case the length of the specimen is 120 mm, this mean the allowed deformation which should not exceed by weldment is: deformation = ε × 120 mm = 0.125 mm. So, in this article the maximum deformation is not exceed 0.012 mm (trials 3, 8, 10, 14, and 16) as mentioned above. This mean acceptable values of deformation are attained in dissimilar welding of austenitic with ferritic alloy used in superheater boiler tubes of steam power plant. Moreover, trial 1 in Figure 14 show same amount of flange in both materials, this is due to low level of parameters was used. Concerning the axial shortening (burn off length) and by relating to Figure 14, trial 6 (characterized by 1100 rpm speed and 5 s friction time) shown less amount of axial shortening in ferritic side which is equal to 3.1 mm, whereas, trial 13 (characterized by 1700 rpm speed and 15 s friction time) produced higher axial shortening represented by 7 mm. So, the lower friction time accompanied with low speed may not enough to flow enough mass of material during friction process.
Figure 15 show the larger flange thickness in Hiperfer steel which is equal to 0.00401 mm but lower extrusion diameter, whereas TP347HFG specimen produce lower flange thickness equivalent by 0.00274 mm against larger amount of extrusion, this change related to difference in thermal conductivity and specific heat of the two materials.

Axially and radially dimension of flash formed.
In Macrostructure photograph show in Figure 16 which represent deformation condition in both of trials 11 (a) and trial 16 (b), it was seen in trial 16 the welding process parameters indicated higher speeds against low friction pressure which led to create undeformed regions due to low pressure (30 MPa) used in trial 16, so increasing the speeds with decreasing the heating pressure not give best results comparing with trial 11 in which the lower speed was used against higher heating pressure.

Friction welding joint photograph showing the flash condition on both sides: (a) trial 11 (induced lower Von-Mises stress) and (b) trial 16 (induced higher Von-Mises stress).
Because the temperature exceeded 720°C in dissimilar welding of austenitic with ferritic stainless steel, it is predicted to observe γ phase in weld joint which characterized the austenitic base metal and α’ (the induced martensitic phase). A uniform α’ decrease from the interface toward the base metal. This phase transformation can be triggered by deformation of the austenite and that the volume fraction of the induced martensitic phase formed is powerfully related to the amount of the plastic strain executed in different loading modes. The other factors, such as temperature and chemical composition, also impact the production quantity of martensite formed.
The martensitic induced phase was the product of friction process at the interface, and its percentage depended on thermo-mechanical effect produced in the metal. The temperature generated along the welded tube and the rapid cooling rate could clarify α’ phase growth. As it’s a relatively hard phase, α’ phase might affect the material hardness and corrosion characteristics. 26
The weld metal dilution with ferritic stainless steel base metal grew by increasing the heat input during welding, which is used to estimate the chemical composition in the interface zone. Then by depending on WRC-1992 diagram, Creq and Nieq, as well as the ratio between them, the results indicated that the weld metal was solidified in a completely ferritic mode, subsequently undergoing a solid-state phase transformation from ferrite to austenite. This mode of solidification causes significant alterations in the d-ferrite morphology. The changes in the amounts of Creq and Nieq can have a higher effect on the d-ferrite creation, which its content increase by increasing the heat input. 3
Conclusion
Finite element analysis of dissimilar continuous drive friction welding had been achieved. Dissimilar stainless-steel tubes had been used as specimens for welding process, and the following conclusion have been observed in this investigation:
Grey relational analysis as statistics procedure was used for specifying the optimum trial by depending on responses: maximum interface temperature, equivalent stress, and total deformation. The optimum parameters were found as; friction pressure is 80 MPa, friction time is 5 s, forging pressure is 165 MPa, forging time is 5 s, speed 1500 rpm which represent trial 11 of 18 trials carried out through this study. Anova analysis was then followed to identify the effect of individual factors on each response.
According to Anova analysis it was found that upset pressure had higher contribution percentage in equivalent stresses and total deformation while friction pressure had larger contribution percentage in maximum temperature distribution, followed by friction time. The rotational speed seen to had lower effect on the welding process except on the total deformation. In addition to, the highest temperature growth happened through heating stage, by which the ultimate temperatures are less the melting point of the material.
Macrostructure photographs showed that trial 11 has less deformation and the difference between the deformation value and acceptable value in end application is agreeable.
Welding of tubes faced difficulty than welding of solid bars due to non-concentrating the heat along contact surfaces and escaping it from the middle of the tube so this tends to decrease the amount of heat at interface region.
The ferritic properties after heat treatment seen to be similar approximately with austenitic alloy, it can see this from the extruded size of flash in both steels.
Equivalent Von-Mises stress observed to be less at interface region especially at the middle side of the tube than the peripheral side due to higher heat and in turn lower yield strength around this line.
Footnotes
Acknowledgements
We would like to express and convey our gratitude to Middle Technical Universtiy/Baghdad, Technical Instructors Training Institute, for giving us his advances to do some trials on their friction welding machine improved by their technical team to adequate my requirement. The results obtained helped me in specifying the best values of parameters to weld such these types of stainless steel.
Handling Editor: Chenhui Liang
Declaration of conflicting interests
The author(s) declared no potential conflicts of interest with respect to the research, authorship, and/or publication of this article.
Funding
The author(s) received no financial support for the research, authorship, and/or publication of this article.