
Abstract
This study used finite element analysis software DEFORM-3D to analyze the preform formability and die stress in the pre-forming process of forging automobile transmission components. The preform and die materials used are AISI- 5120 alloy steel and JIS-SKD61 mould steel, respectively. This research investigated the phenomenon of folding defects in the preform at the end of the final forging process. First, as the die shape under the pre-formed channel was designed to change, its die shape was close to the final forged hole shape. Then, three quality characteristics were optimally analyzed by the Taguchi method for pre-formed passes, namely, “maximum tensile stress of the upper die, ”“maximum stretch stress of the lower die, ” and “ the degree of filling of the preform in the die cavity.” Then, this study applied grey correlation analysis to identify the experimental parameter configuration that could achieve a balance between the three quality characteristics, as compared with the results obtained by the Taguchi method. The results show that the lower die after the design change of the pre-forming pass can indeed improve the phenomenon of folding defects in the preform. In terms of the overall experimental data, the experimental data obtained by grey correlation analysis can balance the experimental results of the Taguchi method based on the optimization of the three quality characteristics. The experimental result of this set of parameters not only obtained the maximum tensile stress value of 716.614 MPa in the upper die but also considered the degree of the preform filling and maximum tensile stress in the lower die. The two values were 102.56% and 836.843 MPa. Although these two values are not optimal, compared to the data obtained by the Taguchi method, the preform was filled completely in this case. The maximum tensile stress value of the lower die is also the lowest.
Keywords
Introduction
For traditional local methods, the high cost of moulds and dies manufacturing and the low rate of component development for mass production has caused a lengthy development cycle. The accumulation of manufacturing and design experience in moulds, manufacturing time, capital, and labour costs in production have progressed with the development of science and technology. The finite element analysis software is proficient, and the application of computer-aided design (CAD) and computer-aided engineering (CAE) technology has become a trend in the formation of landscape products and the design of process analysis parameters. Products can be developed on a trial basis, which reduces the number of die-forging failures and avoids waste. This study conducted forging in a hot forging environment. During the hot forging process, the die is in contact with heated to high-temperature metal while applying continuous impact forging and impact extrusion simultaneously. Therefore, the forging process will cause severe die wear and occur die defects. Furthermore, the fatigue life of forging dies is very important. That is because forging dies are usually subject to high stresses. Therefore, It can easily lead to a high level of internal pressure, local stress concentrations, deformation, and finally premature failure of dies. 1 In order to distribute the metal material evenly during the forging process to achieve the desired shape, and to avoid defects in the forging during the final forging process, sometimes one or more pre-forming processes are added in the previous process of final forging. The shape of the die in the pre-forming stage directly determines the shape of the pre-forming forging and also affects the final shape and microstructure of the forging. Hence, the design of the pre-forming stage is very important for controlling the quality of the forging. 2 In the hot forging process, the design of the preform is very important to minimize the forging load and effective stress, thereby improving the die’s life and the forging quality. Besides, in 3 to avoid defects in the forging process of forged components, the parameters of preform must be properly selected for the forging process. Die life depends not only on the material used but also on process parameters, such as forging load, forging times, preform size, die and preform temperature, friction coefficient and other parameters. 4 In 2005, Kim et al. 5 proposed two methods for estimating the life of hot forging dies by plastic deformation and, die wear for SDK61 die steel, based on two main process parameters (forming speed and die initial temperature) using it to predict the life of the mould. In 2010, Chen et al. 6 simulated the synchronous ring in the forged automobile parts based on the principle of rigid viscoelasticity with the finite element analysis software DEFORM-3D, mainly analyzing the influence of the die structure and friction coefficient on the forging quality, and the influence of the metal in the forming process. In 2009, Chan et al. 7 discussed that in order to avoid the folding defects of the axisymmetric flange during forming, they proposed a way to improve the problem by changing the internal shape of the mould by adding sliding inserts. In 2021, Yin et al. 8 used DEFORM-3D to simulate the closed-die forging process of copper alloy valve bodies with traditional double-acting and multi-axis core forging presses. Since the initial position of the punch and the actuation of the punch in the two processes, the sequence is different and the two processes need to be compared by utilizing of finite element simulations. How to effectively improve the dimensional accuracy of metal products while effectively improving the life of the die and reducing production costs has long been the main goal of discussion and research by technical workers in this field.
Research methods
Taguchi optimization method
The Taguchi method is also known as a robust quality design. Its main concept is to combine product quality and process parameters, apply statistical concepts to obtain experimental results, and use an orthogonal array (OA) for experiment planning. In Hsu and Yu 9 a Taguchi method combined with Stael in method is proposed to optimize the support vector machines (SVM). By comparation with other optimization methods the experiment results show that the proposed method can obtain the effective model. In order to obtain the best combination of control factors and levels in the process with the least number of experiments. First, the most important observation objects in the optimization experiment are determined, and they are set as quality characteristics. Then, the control factors and level number are determined. Afterwards, the most suitable orthogonal table for this experiment is determined for analysis. A Taguchi orthogonal table is represented by La(bc), where L represents the symbol of the orthogonal table; a represents the total number of experiments; b represents the maximum number of levels that each control factor can accommodate; and c represents the maximum number of control factors that can be accommodated. Then, the signal-to-noise ratio (S/N ratio) of each group of experiments is calculated according to the type of quality characteristics (Nominal-the-best, Larger-the-better, or Smaller-the-better), which can be further obtained by the S/N ratio factor response table/graph and analysis of variance (ANOVA). Finally, a set of optimal experimental parameter combinations and the influence of each control factor on quality characteristics are obtained. Formula (1) and formula (2) are the calculation formulas of the S/N ratio used in the quality characteristics of this article; while formula (3) to formula (6) are the calculation formulas used in variance analysis. 10


Where:
Analysis of variance (ANOVA) can be expressed as follows:

Degree of freedom for factor A:

Variance of factor A


Where:
Grey relational analysis
The grey system theory is mainly aimed at systems with the conditions of incomplete and unclear information. It carries out correlation analysis and model construction of the system, analyzes the situation of the system through prediction and decision-making, and deals with uncertainties in the system, including data incompleteness, discrete data, and multi-variable input, for effective processing. Grey correlation analysis is based on the degree of grey correlation as the main measurement basis. In order to obtain the grey correlation degree, the following calculation steps must be carried out for the experimental data. 11
Grey relation generation (Normalization processing)
If the data sequence generated by each factor is to be analyzed by grey correlation, but these sequences are not comparable, under the principle of comparability, data processing must be performed on these data sequences, and this method is called grey association generation. According to the data characteristics, data can be divided into the characteristics of Nominal-the-best, Larger-the-better, or Smaller-the-better. This study used the formula (7) to generate the data by grey correlation.

The process of solving grey relational degree
A grey generation sequence will be generated after all data series are generated by grey correlation. After the grey generation sequence is obtained, the difference between the corresponding value and the reference sequence must be calculated, which is taken as the absolute value. This difference represents the best experiment for the distance between each group of experimental data, meaning the difference between the data, and then, arrange the obtained values after calculation, in order will produce the absolute difference sequence. The calculation method is shown in formula (8):

Where
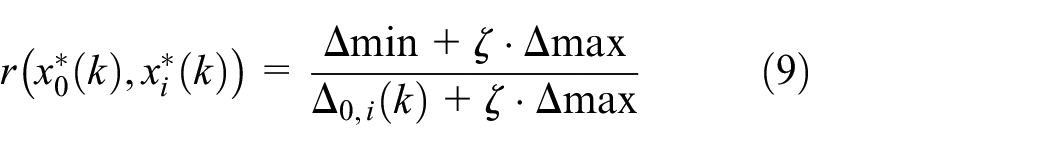
Where ζ is the Distinguishing coefficient, and its value range can be between 0 and 1, which can be adjusted according to actual needs; generally, it is 0.5. The main function is to compare the background value with the measured value and identify the value of the coefficient, meaning it only changes the size of the relative value but does not affect the sorting of the results obtained by the final grey correlation degree. After the grey correlation coefficient is obtained, formula (10) can be used to obtain the grey correlation value of each data series.

Experimental method
Forming pass and parameter setting for process simulation
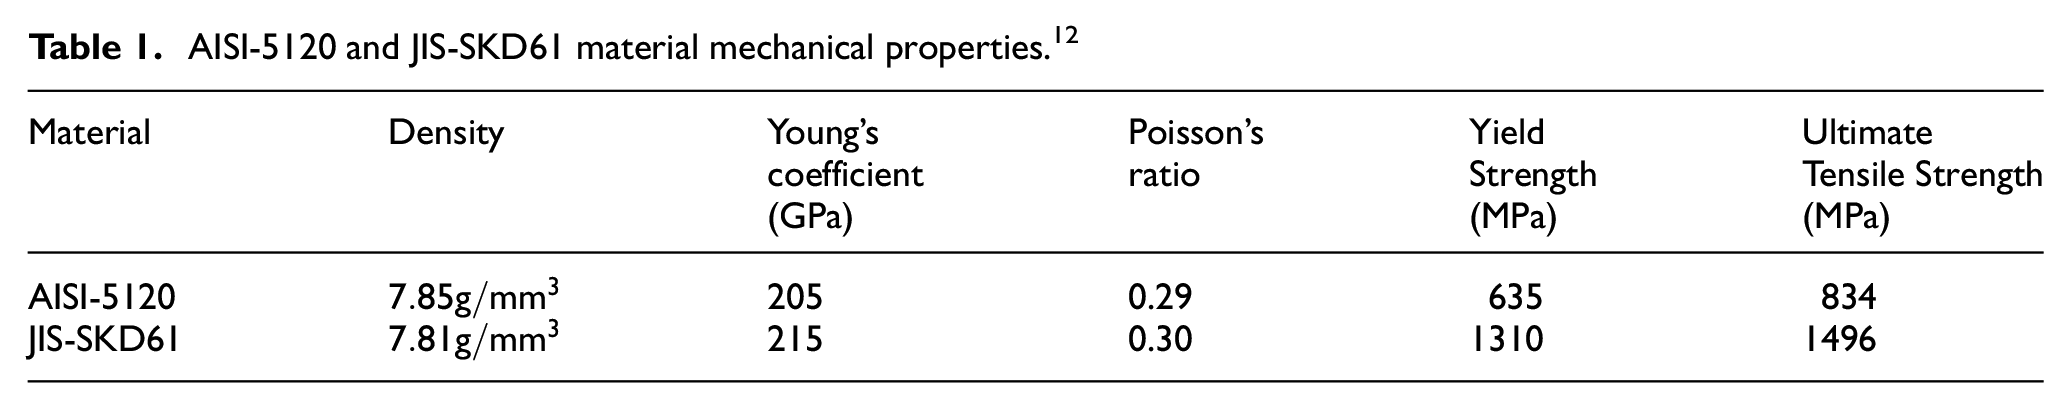
The automobile transmission parts analyzed in this study are products produced by closed-die hot forging. The entire forging process was processed through three forming passes, namely end press, pre-forging, and final forging. The preform material of the forging is AISI-5120 alloy steel, and the material of the upper and lower die is JIS-SKD61 die steel. Table 1 shows the mechanical properties of the two materials. Figures 1 to 3 show the schematic diagrams of the die shapes required for the three passes when simulating end pressure, pre-forging, and final forging. The shape, diameter, and length of the preform are processed by round bars of ∅55 × 104.5 mm. After the preform is formed through the three processing passes of the above closed-die forging process, the final shape of the forging product is shown in the schematic diagram of Figure 4.
AISI-5120 and JIS-SKD61 material mechanical properties. 12

Schematic diagram of the preform (a), die (b), and assembly (c) of the first pass of end pressure.

Schematic diagram of the combination of the upper and lower dies (a and b) and the cross section of the second pass pre-forging (c).

Schematic diagram of the combination of upper and lower dies (a, and b), and profile in the third pass of final forging (c).

The final shape of the forging: (a) upper view and (b) bottom view.
Defects of forgings in the initial manufacturing process and improvement methods
The aforementioned three forming passes belong to the original design version, while the shape of the die of this version is forged to form. The DEFORM-3D was used to conduct simulations in this study. DEFORM-3D is a robust tool that utilizes the finite element method (FEM) to model complex machining processes in three dimensions. In this study, we utilized the Tetrahedral mesh for all simulations, with a total of 95,000 grids. The boundary conditions for the simulations were straightforward, and certain necessary parameters had to be set in the pre-processor stage prior to conducting the simulations. These parameters needed to be imported based on the relevant parameters of the actual forging process, such as the forging material, punch speed, and coefficient of friction. Table 2 specifies the parameters for both the initial process and the process after the design change. Finally, based on the FEM simulation results shown in Figure 5, the forging will have a folding defect during the final forging process. When stress concentration occurs, it reduces the strength of the forged item, and its fatigue life will be reduced in future use, meaning it will fail earlier.
Parameter setting of DEFORM-3D simulation.


Folding defects of final forgings.
In order to improve the folding defects of the preform after the final forging process, this study changed the shape of the die of the pre-forming pass, which made the shape of the preform after the pre-forming pass close to the final forged shape. Figure 6 shows a schematic diagram of the die shape of the pre-forming pass and the shape of the forging after design changes. After design changes, the most important stage of formability was changed from the original final forging pass to the pre-forming pass. When the pre-forming pass was formed, the shape of the forging approached the shape of the cavity of the final forging pass, thus, the remaining material flow space during the final forging will not be enough for folding defects to occur.

The shape of the die (a) and the forging after the design change of the pre-forming pass (b).
This study used a round bar preform of the same size to perform the forging simulation experiment again from the first pass, in order to determine the state of the forging after the pre-forming pass. While the original folding defect was indeed eliminated, there was another problem, meaning that the preform could not completely fill the die cavity in this pass. Similarly, the obtained results of the FEM simulation are presented. Figure 7(a) shows the part where the preform failed to fill smoothly, while Figure 7(b) shows the positive pressure distribution diagram, which clearly shows that the area failed to be filled smoothly. The red areas are the positions where the preform has been in contact with the surface of the die cavity, which means that the preform in these areas have been successfully filled; on the contrary, the blue areas are the preform that have not yet been filled. The positions in contact with the surface of the die cavity indicate that the preform in these areas cannot be filled smoothly. When it is confirmed that the initial volume of the preform is greater than the volume of the pre-formed forging, but there is no way to completely fill the cavity, it means that there is a possible problem in the die design. The Taguchi method can be incorporated as one of the quality characteristics of the optimization target, in order to address the problem that the preform cannot be completely filled in the follow-up.

(a) The area where the preform material cannot be filled smoothly (b) Forward pressure profile.
Taguchi optimized parameter design
Since the preform cannot be completely filled in the pre-forming pass, the first quality characteristic to be optimized by Taguchi is defined as “the degree of filling of the preform in the die cavity,” and its quality characteristic is the large characteristic. The first control factor to be included in the Taguchi orthogonal table is “the inner diameter of the lower die of the pre-forming pass (mm).”Figure 8 shows the cross-sectional view of the lower die of the pre-forming pass. The inner diameter marked in the figure is the inner diameter of the level change, and 163 mm is the inner diameter of the initial design. As the volume of the preform remains unchanged, the thickness of the preform can be indirectly increased by reducing the inner diameter of the lower die, thereby increasing the stroke of the upper die, meaning that the preform has more deformation space, while the reduced area belongs to overflow. The material area does not affect the final shape of the forging product.

The inner diameter of the die under the pre-forming pass as the control factor (mm).
However, if the thickness of the preform and the stroke of the upper die gradually increases, the larger deformation of the preform will further increase the forging load and die stress, and such an increase in the forming load and die stress will affect the life of the die. The main reduction factors are1,3,4; therefore, the second quality characteristic to be optimized by Taguchi was subsequently defined as “the tensile stress of the die,” and its quality characteristic is the smaller the better. Three controls were also determined to be included in the Taguchi orthogonal table, “punch speed (mm/sec),”“ preform temperature (°C),” and “coefficient of friction.”
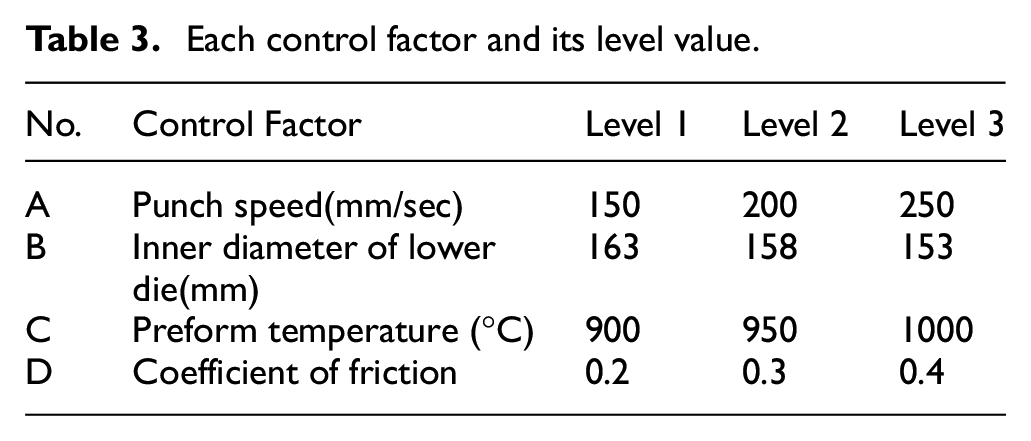
In the follow-ups of this study, simulation experiments will be carried out based on the nine groups of experimental parameter configurations of the L9(34) Taguchi orthogonal metre. Table 3 shows the control factor settings and their level values; Table 4 shows the parameter configurations of the nine groups of experiments in the L9(34) orthogonal table.
Each control factor and its level value.
Experimental configuration of L9(34) Taguchi orthogonal metre.

Two calculation methods for quality characteristics
The degree of preform filling in the die cavity
This study used the “surface area of the actual preform” and the “area of the preform in contact with the upper and lower die at the end of the simulation of the pre-forming pass” for judgement. It calculated the degree of die filling of the preform in the die cavity. First, in Inventor, reverse modelling of the preforms was performed with the inner diameter of the lower die in the three pre-forming passes. Afterwards, the surface area calculation function in general properties was used to obtain the surface areas of the three preforms, and their values were equivalent to the upper die. At the end of the stroke, the surface area value of the enclosed area between the lower die and the upper die was regarded as the actual surface area of the forging. Then, the contact between the preform and the upper and lower die was calculated through the DEFORM-3D post-processor, then, the values obtained in Inventor and DEFORM-3D were substituted into formula (11), in order to calculate the filling degree of the preform in the die cavity.

Tensile stress of the die
DEFORM-3D provides two methods for stress analysis of dies, the coupling method and the interpolation method. The advantage of the coupling method is that the stress distribution of the die can be calculated simultaneously with the forming process of the preform, which means that the stress distribution state of the die at each step can be obtained; however, because the die must be set as a deformable body and meshed, the simulation will take too long and too much computer storage space. The principle of interpolation is to push the load on the preform back to the die itself in the form of reaction force after the preform is formed. The advantage is that the simulation time is short; the disadvantage is that die stress analysis can only be performed for a certain step in the forming process, thus, the step with the largest forming load in the entire forming process is usually selected. As the die at this step is the most stressed, the analyzed data is also the most reliable. In the follow-up of this research, the interpolation method will be used to simulate and analyze the tensile stress of the die and discuss the data. Table 5 shows the parameter settings used in this article.
DEFORM-3D simulation analysis parameter settings.

Results and discussion
Analysis of single quality characteristics of the Taguchi method
Maximum tensile stress of upper die
A total of nine sets of simulation experiments were carried out according to the parameter configuration of the L9(34) orthogonal table. The experimental data of each set was recorded as
S/N ratio factor response diagram of the maximum tensile stress of the upper die.
Maximum tensile stress experimental data and its S/N ratio.

Analysis table of the variance of the maximum tensile stress of the upper die.

It can be clearly seen from Figure 9 that the parameter configuration that must be used to minimize the maximum tensile stress of the upper die is A3 B3 C1 D1, while the coefficient of friction of factor D can be further learned from the variance analysis table (Table 6). The contribution of 47.37% is the highest, followed by factor A, which accounts for 37.09% of the punch speed.
Maximum tensile stress of lower die
The experimental method is the same as 4.1.1, and the following three charts are also drawn in sequence according to the experimental data.
It can be seen from Figure 10 that the parameter configuration which must be used to minimize the maximum tensile stress of the lower die is A2 B1 C3 D1. This group of optimized parameter configurations is far from the parameter configurations obtained in 4.1.1. The variance analysis table (Table 8) shows that its contribution rate is 52.29%, which is the highest, but different from the result of 4.1.1. For the upper die, the impact of factor A punch speed on the tensile stress is the second highest; for the lower die, the change in the inner diameter of factor B die is more influential than the speed of the punch, and its contribution is 23.44%.

S/N ratio factor response diagram of the maximum tensile stress of the lower die.
Analysis table of the variance of the maximum tensile stress of the lower die.

The degree of preform filling in the die cavity
The experiment method is the same as 4.1.1, and the following three charts are drawn in sequence according to the experimental data.
The parameter configuration to increase the preform filling to the highest degree is A3 B3 C3 D2, as shown in Figure 11 and from the variance analysis table in Table 9, the change in the inner diameter of the lower die almost completely dominates the embryo. The contribution of the degree of material filling is 95.20%.
S/N ratio factor response graph of preform filling degree.
Analysis table of variance of preform filling degree.

Optimized parameter arrangement for each quality characteristic
Table 10 shows the best parameter information, as obtained based on the three quality characteristics, while Table 11 shows the best parameter configuration, as obtained from the three quality characteristics.
The best parameter configuration based on the three quality characteristics.

Experimental results of the best parameter configuration of the three quality characteristics.

Since there is no regularity in the optimal parameter configuration of the three quality characteristics, there is no way to know the parameter configuration that can simultaneously optimize all the quality characteristics from the currently known information, thus, the follow-up will focus on the L9(34) Taguchi style. The experimental data obtained by the orthogonal table is analyzed by grey correlation, grey correlation degree, and variance analysis, and the experimental parameter configuration that can achieve a balance between the three quality characteristics is evaluated.
Analysis of multi-quality characteristics of grey relation
Each quality characteristic is generated by grey correlation with the S/N ratio of each group of experiments, as obtained by the L9(34) orthogonal table. Since the characteristic of the S/N ratio is the larger the better, the formula of the large form is used for calculation according to its characteristics. Table 12 shows the sequence generated by the S/N ratio grey correlation of the nine experiments for each quality characteristic,
S/N ratio grey generation sequence of each quality characteristic.

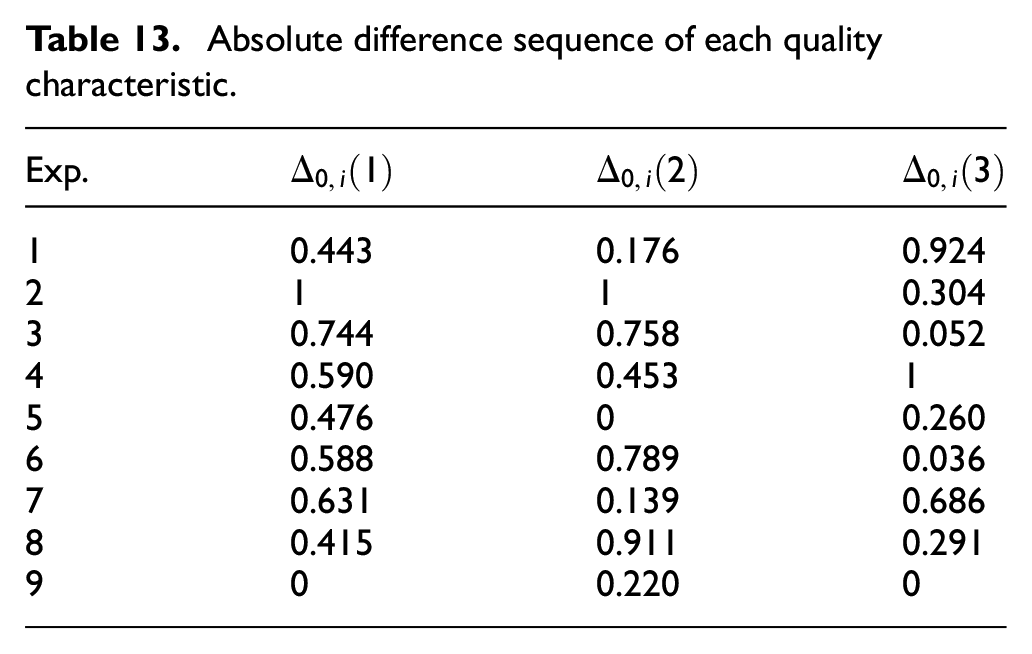
Absolute difference sequence of each quality characteristic.
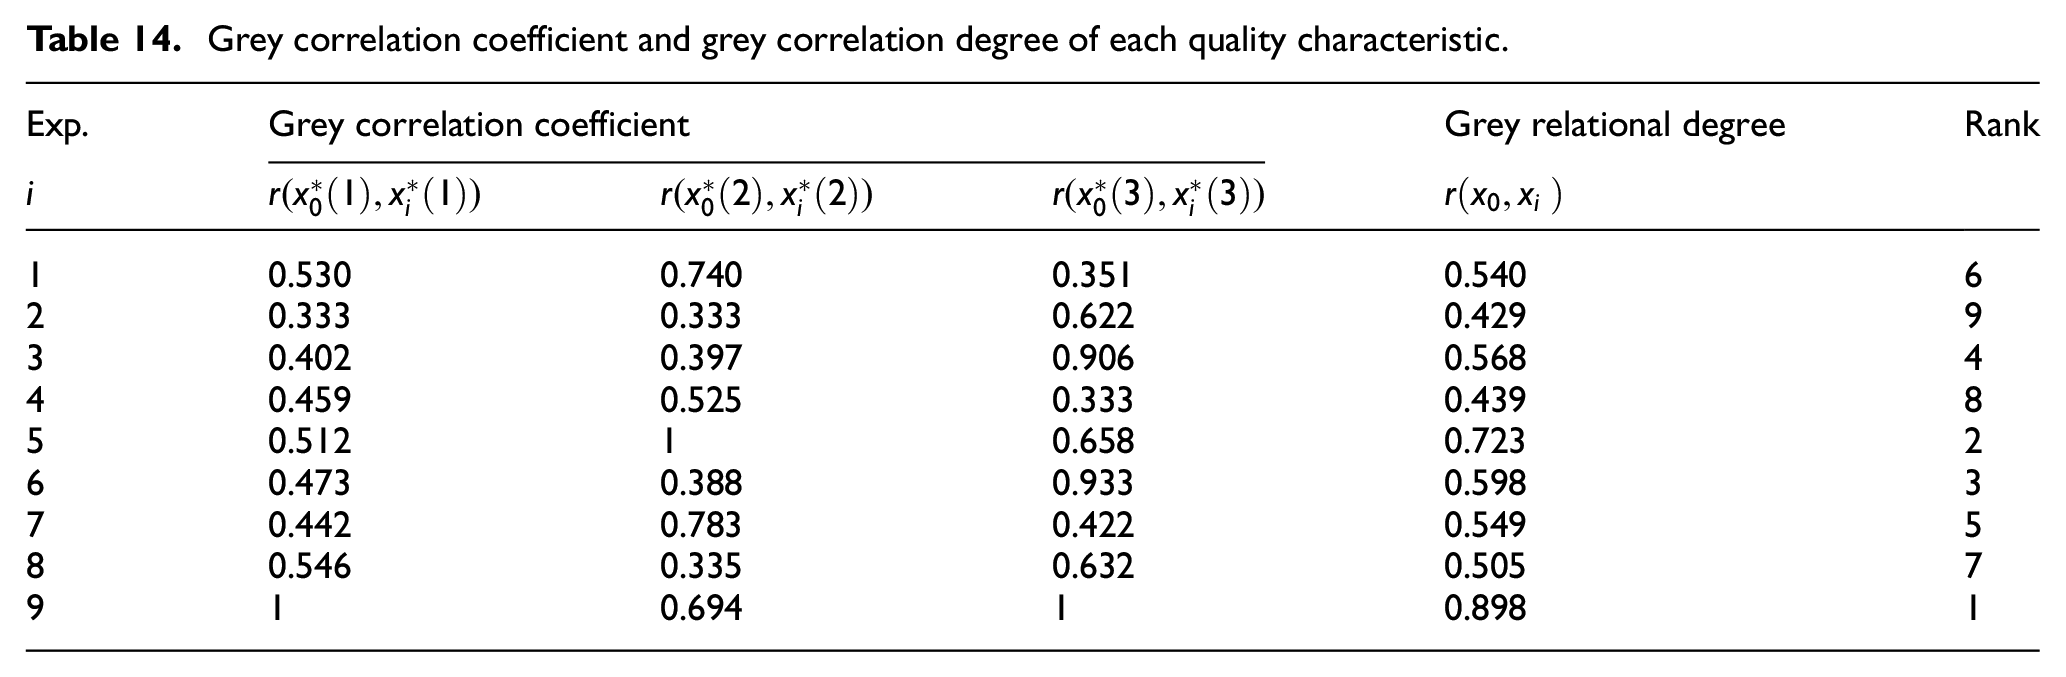
Grey correlation coefficient and grey correlation degree of each quality characteristic.
Then, follow the calculation method of the Taguchi method in 4.1, and draw the following two charts in sequence according to the experimental data.
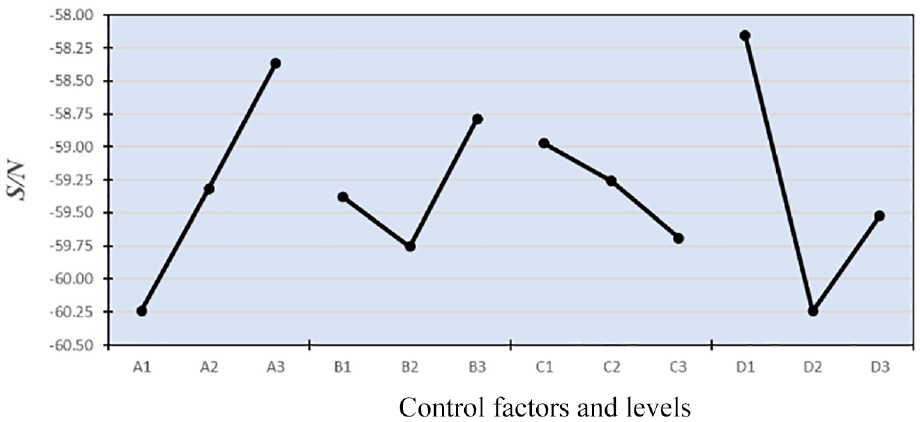
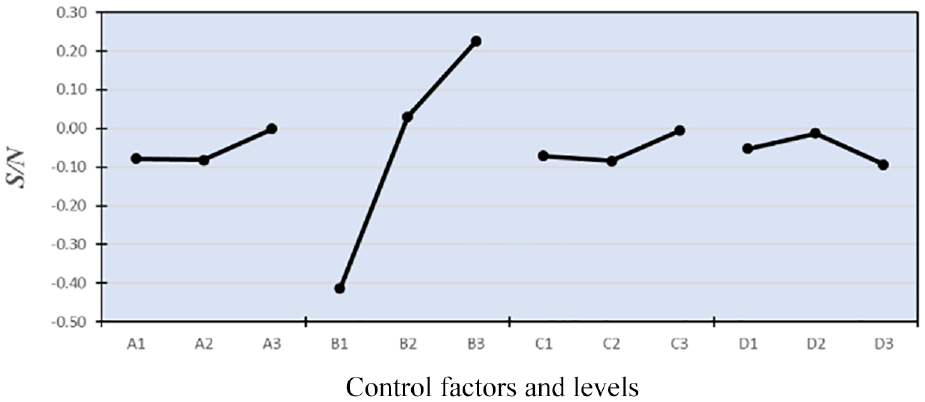
As shown in Figure 12, the best parameter configuration, based on all quality characteristics and obtained by grey relational analysis, is A3 B3 C3 D1, and the difference in the simulation experimental results of the two research methods are compared.

Grey correlation factor response diagram of overall quality characteristics.
Analysis of simulation experiment results based on two methods
Maximum tensile stress of upper die
Figures 13 and 14 show the experimental data of the stress distribution of the upper die, as obtained by simulation of the optimal parameter configurations A3 B3 C1 D1 and A3 B3 C3 D1, respectively, as obtained using the Taguchi method and grey relational analysis. The stress values shown in the figure are positive and negative. A positive value represents the part of the die that is subjected to tensile stress; while a negative value represents the part of the die that is subjected to compressive stress. The difference in parameters between the two is only in the preform temperature setting: the former is 900°C and the latter is 1000°C. Therefore, due to the preform material, it can be inferred that the maximum tensile stress value of the upper die has dropped from 895 to 717 MPa. Higher temperature leads to better formability of the preform, which reduces the forming load required by the upper die when squeezing the preform, thereby reducing the maximum tensile stress value.
Stress distribution data on the upper model with the best parameters of the Taguchi method: (a) Stress distribution data and (b) The percentage of nodes under the stress of the upper die.

Stress distribution data on the upper model with the best parameters of grey relational analysis: (a) Stress distribution data and (b) The percentage of nodes under the stress of the upper die.
In Figures 13 and 14(a), it can be seen that most of the higher tensile stress is concentrated in the area where the upper die is rounded and in contact with the preform. In Figure 15, the flow field in the distribution diagram shows that when the upper die is squeezed downwards, the preform will fill the upper die cavity first. When the preform in the filled area is still being squeezed, it will lead to the force that the area bears. This increase in turn leads to an increase in the stress value and stress concentration in the rounded corner area.

Flow field distribution of preform during forming.
The graphs (b) in Figures 13 and 14 show that the stress percentage trends of the grid nodes are quite similar; however, from the average (Avg) point of view, the value parameters of the grey relational analysis of this group is −510 MPa, which is higher than −575 MPa, as obtained by the Taguchi method. However, due to the high hardness of the die steel itself, only the generation of tensile stress is concerning. Although the average stress value has increased, the range still has negative values, which means that most of the die area is still under compressive stress, and the chance of crack initiation will not increase, thus, it is still in an acceptable range.
Maximum tensile stress of lower die
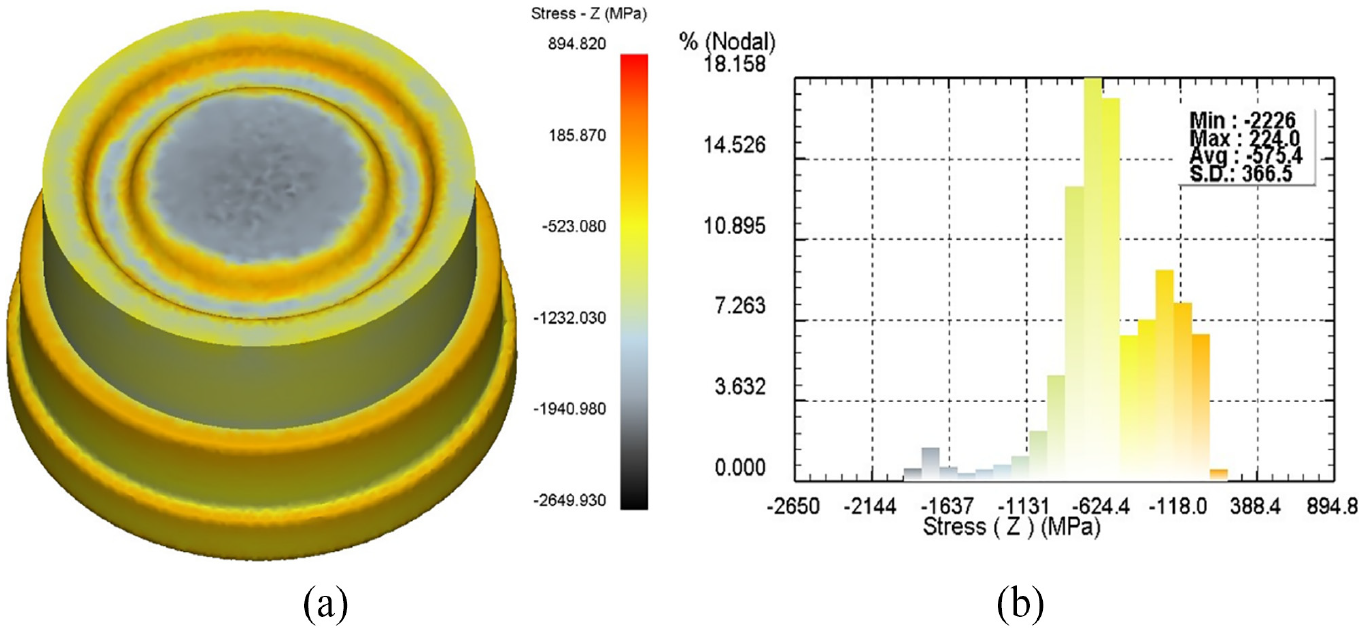
Figures 16 and 17 show the experimental data of the stress distribution of the lower die, as obtained by simulation of the optimal parameter configurations of A2 B1 C3 D1 and A3 B3 C3 D1, as obtained using the Taguchi method and grey relational analysis, respectively. The difference between the two is in terms of parameters, as the punch speed and the inner diameter of the lower die are set differently, the former has a punch speed of 200 mm/s and a lower die inner diameter of 163 mm, while the latter has a punch speed of 250 mm/s and a lower die inner diameter of 153 mm.
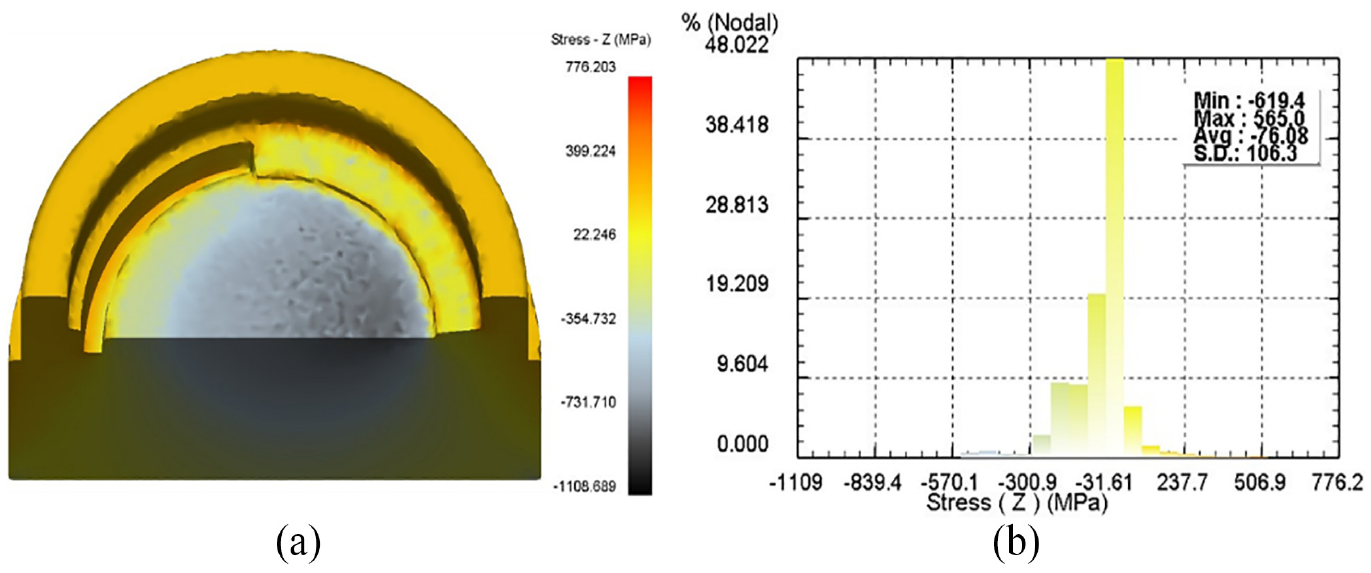
Stress distribution data under the best parameters of the Taguchi method: (a) Stress distribution data and (b) The percentage of nodes under the stress of the lower die.

Mode stress distribution data under the best parameters of grey relational analysis: (a) Stress distribution data and (b) The percentage of nodes under the stress of the lower die.
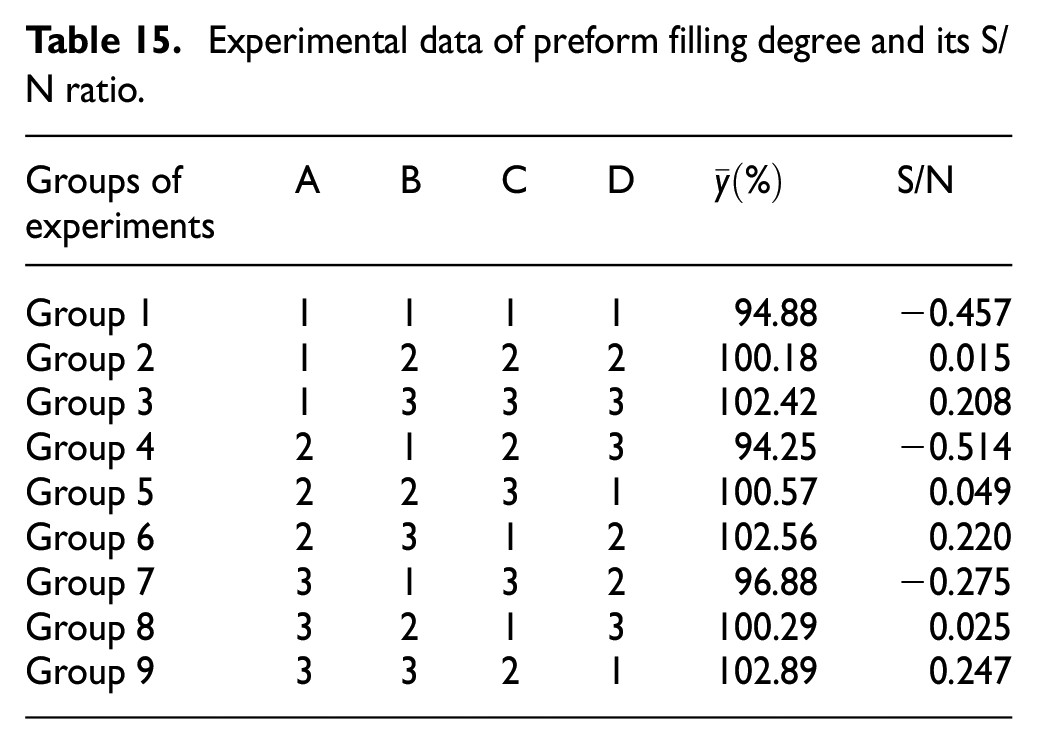
It can be inferred that the maximum stress value obtained by the grey correlation analysis is larger, which is partly because the punch speed is faster, and because the Taguchi method uses the inner diameter of the lower die of 163 mm, which will cause the preform to fail. Thus, the die cavity should be completely filled, as mentioned in the analysis table regarding the variance of the preform filling degree, as shown in Table 15. The experimental data of the orthogonal table shows that, provided the experimental group uses the inner diameter of the 163 mm lower die for simulation, the degree of die filling is less than 100%. This group of experiments is no exception. The die degree is 94.90%. When the preform material cannot completely fill the die cavity, the stress value borne by the lower die is relatively small, as shown in Figures 16 and 17(b). The average value shows that the value obtained by this set of parameters of the Taguchi method is −76.08 MPa, which is lower than the −53.19 MPa obtained by the set of parameters of grey correlation analysis. Table 16 is the analysis table of the variance of the maximum tensile stress influencing the inner diameter of the lower die, with factor B on the maximum tensile stress of the lower die ranking second, accounting for 23.44%. Hence, it can also be inferred that the inner diameter of the lower die is different. Whether or not the preform fills the die cavity will directly affect the stress that the lower die bears.
Experimental data of preform filling degree and its S/N ratio.
Experimental data of the maximum tensile stress of the lower die and its S/N ratio.

Figures 16 and 17(a) show that the lower die with an inner diameter of 163 mm has a stress distribution at the middle platform, as compared to the lower die with an inner diameter of 153 mm. The die is obviously unevenly distributed, and the stress value on the left half of the platform is significantly higher than on the right half. It is speculated that the preform continues to flow into the gap of the lower left groove in the final stage, which leads to stress on the left half of the platform and increases the value, as shown in the flow field distribution diagram in Figure 18.
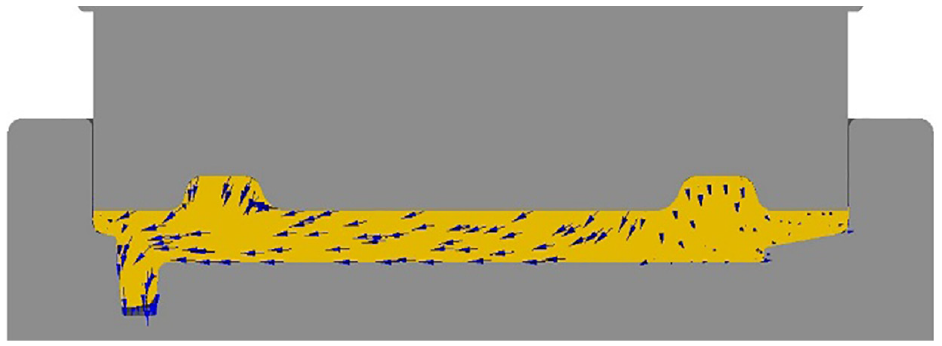
The flow field distribution of the preform when the inner diameter of the 163 mm die is formed.
The degree of preform filling in the die cavity
Figures 19 and 20 show the experimental data of the best parameter configurations of A3 B3 C3 D2 and A3 B3 C3 D1, as obtained by simulating the filling degree of the preform in the die cavity using the Taguchi method and grey correlation analysis. The difference between the two in terms of parameters is only in the setting of the friction coefficient, where the former is 0.3 and the latter is 0.2.

The preform forming process with the best parameters of the Taguchi method.

The preform forming process of the best parameters of grey relational analysis.
As mentioned in the previous section, the change in the inner diameter of the lower die almost completely determines whether the preform fills the die cavity or not. In this section, the die used in the Taguchi method and grey correlation analysis are all lower die with an inner diameter of 153 mm, thus, both can fill the die completely; however, the friction coefficient setting of control factor D is different for the two. During the forming process of the preform, it still has a slight influence on formability, as shown in Figures 19 and 20. According to the cross-sectional view of the forming process of the preform under the two methods, while the forming processes of the two are almost the same, it can be observed in Step 50 that the preform of this group of grey correlation analysis are almost filled. In the upper die cavity, the cross-sectional view of the Taguchi method, and in the left half of the upper die cavity (marked with the red frame), it can clearly be seen that the slight gap has not been filled. Then, the viewing angle of the billet is further converted into 3D and displayed as a positive pressure distribution map, as shown in Figure 21. At step 50, it is obvious that the preform of the Taguchi Method have a large area showing the blue distribution in the upper left half, meaning it has not been in contact with the die. In contrast, the grey correlation analysis of this group of preform shows that there are only a few small dots showing blue distribution at the same position in step 50, and the final preform is completely filled with the die. In one step, the grey relation analysis group of preform reaches the complete die filling at step 109, while the Taguchi method does not show the complete die filling until the 146th step. Although the parameter configurations obtained under the two methods are quite consistent with the results of simulated formability, the information obtained from the known data means that the friction coefficient used in the grey relational analysis group is 0.2 more than that of the Taguchi method. The friction coefficient of 0.3 used by the group can quickly make the preform fill the die completely.

The 50th step forward pressure distribution diagram of the preform of the two methods(a)~(b).
The simulation experiment results of the two methods
Table 17 shows the best parameter configuration and experimental results obtained by using the two research methods, and the three groups of the best parameter configurations of the Taguchi optimization method are A3 B3 C1 D1, A2 B1 C3 D1, and A3 B3 C3 in order. D2 is based on the three quality characteristics of “maximum tensile stress of upper die,”“maximum tensile stress of lower die,” and “filling degree of preform in die cavity.”
The best parameter configuration and experimental results of the two research methods.
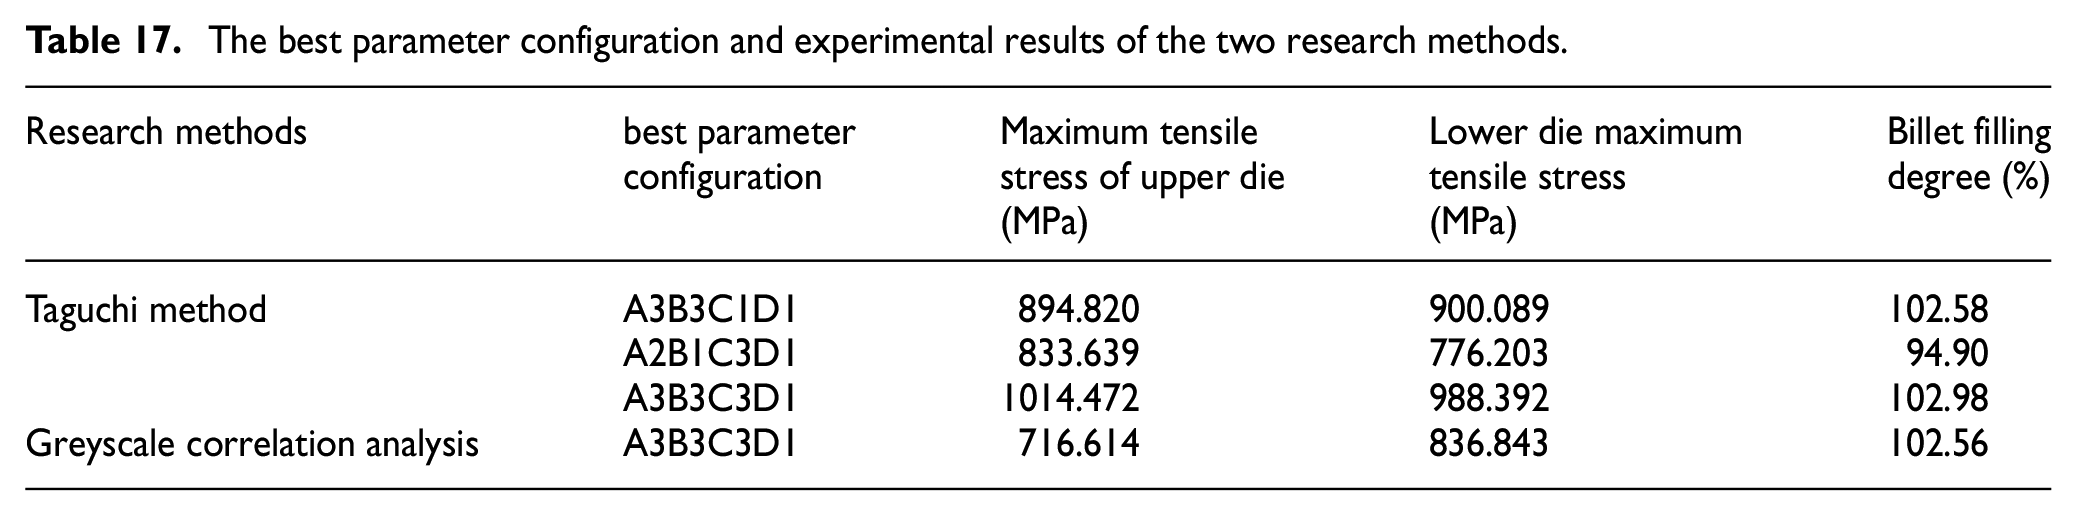
From the overall data point of view, the value obtained by grey correlation analysis in the “maximum tensile stress of the upper die” is the smallest among all experimental data, which means that for this quality characteristic, grey correlation analysis has indeed achieved the best change effect.
Regarding the “Maximum Tensile Stress of the Lower Die,” the value obtained by the grey correlation analysis of this group of parameters is not the smallest; however, in contrast to the second set of experimental parameter data of the Taguchi optimization method, although this group has obtained the smallest value and the maximum tensile stress value, there is no way to fill the preform completely. Regarding the 837 MPa obtained by grey correlation analysis, although it is greater than the second set of parameters of 776 MPa, it is still lower than the stress obtained by the other two sets of parameters. Finally, the grey correlation analysis of this group of parameters can also make the preform fill the die completely, thus, it was finally determined that the maximum tensile stress value of the lower die obtained by the grey correlation analysis is still an acceptable result.
Regarding the experimental data of the four sets of parameters of “ Preform Filling Degree,” except for the second set of parameters, the remaining parameters can make the preform fill the die completely. However, as mentioned in section 4.3.3, according to the embryo and from the perspective of the forming process of the material, the friction coefficient of 0.2 used in the grey relational analysis can indeed make the preform fill the die cavity faster.
Final forging verification of actual manufacturing process and experimental simulation results
Subsequently, the pre-formed forgings obtained by the simulation of this set of parameters of the grey correlation analysis are put into the die of the final forging process for final forging simulation, and the forming process is shown in Figure 22. When the final forging process is complete, the final shape of the forging is shown in Figure 23, which shows that there are many pink dots distributed on the outermost periphery of the forging, and each dot represents the place where a folding defect occurred. However, as these areas belong to the flash area, the preform in these areas will be further cut out in the follow-up, thus, these defects will not affect the quality of the forging product, and there is no fold in the non-flash area. Defects, meaning the simulation results of the formability of the preform in the final forging process, are acceptable. Figure 24 shows the actual forging product obtained by the actual process, where the outer flash area and the middle area of the actual forging have been cut out, and the product itself has not produced any defects, which shows that the simulation results and the results of the actual manufacturing process are mutually verified.

The forming process of the final forging process of the pre-formed forging in the grey relational analysis.
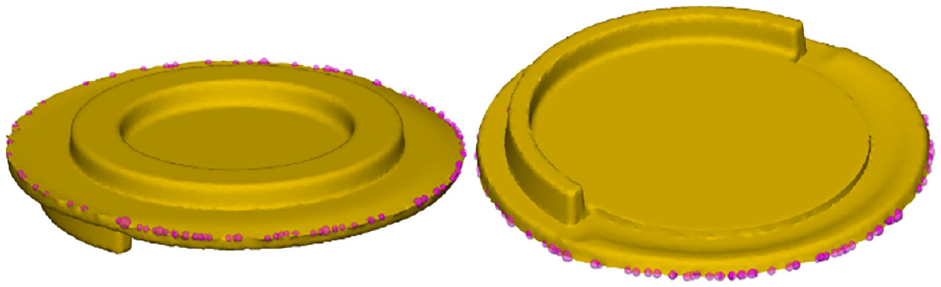
The final forging product diagram of the simulation process.
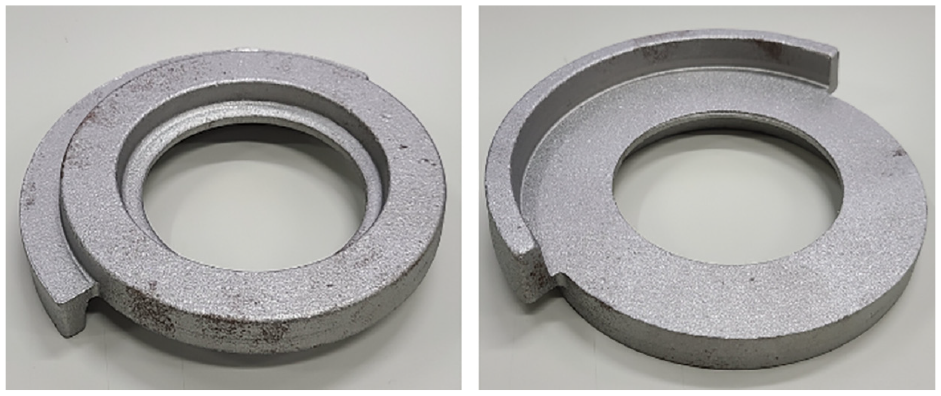
Finished product drawing of the final forging in the actual manufacturing process.
Conclusion
In this study, to analyze the preform formability and die stress in the pre-forming process of forging automobile transmission components, a approached of finite element analysis software DEFORM-3D was proposed. The closed-die hot forging simulations experiment are conducted. The simulation results show that, the forging will produce folding defects after the final forging and the position of the folding defect will cause the forging to produce stress concentration, which will reduce the strength of the forging. In order to improve the folding defects, subsequent design changes were made to the die shape of the pre-forming pass. The results presented that the folding defects could indeed be improved; However, another defect was derived, meaning that the preform could not completely fill the pre-forming pass die cavity. By using the Taguchi method, based on the quality characteristic of the maximum tensile stress of upper die and grey correlation analysis the best parameter configuration is obtained. According to the overall experimental data, the final experimental data obtained by grey correlation analysis can be said to balance the experimental results of the Taguchi method based on the optimization of the three quality characteristics, and the maximum tensile stress value of 717 MPa in the upper die was obtained. In terms of the lower die, it can also consider the degree of preform filling and the maximum tensile stress, and these two values are 102.6% and 837 MPa.
Footnotes
Handling Editor: Chenhui Liang
Declaration of conflicting interests
The author(s) declared no potential conflicts of interest with respect to the research, authorship, and/or publication of this article.
Funding
The author(s) disclosed receipt of the following financial support for the research, authorship, and/or publication of this article: This work was supported by the Ministry of Science and Technology, Republic of China, under Contract MOST 110-2622-E-992-009.