
Abstract
In order to upgrade the comfort and dynamic feeling of the sound in the cabin of electric vehicle acceleration and uniform driving, this paper conducted a study on active sound making control in EVs based on sound fitting. Sound fitting was analyzed by short-time Fourier technique (STFT), sound extraction and synthesis was tested by STFT and synthesis method was conducted by Kaiser window function. A study on the sound requirements of a Class A EV was completed, in which a sound design method integrated three objective dimensions of sound amplitude strengthening, energy distribution, and order composition in the vehicle speed range, so as to determine the sound design scheme of accelerated driving with both comfort and dynamic sense. By comparing the characteristics of two kinds of engine sound extraction, the correlation between dynamic sensation and engine sound amplitude was analyzed, and the active sound parameter selection was confirmed under two conditions of acceleration and uniform speed. Efforts were devoted to conduct the active sound system program workflow diagram and system hardware design and testing, and to complete the active sound generation system (ASGS) formation and accuracy testing of the electric vehicle based on the audio system speaker, and additionally the sound calibration and target verification of the ASGS under the static conditions of the real vehicle were carried out. The objective test shows that the ASGS reduces the sharpness under the two working conditions of acceleration and constant speed to 1.0 and 0.52 acum respectively, which effectively alleviates the uncomfortable feeling brought by the high-frequency order sound, and proves that the ASGS can enhance the comfort and dynamic quality characteristics of the electric vehicle interior sound.
Keywords
Introduction
The NVH (Noise, Vibration, and Harshness) performance, an important quality of a vehicle, is a crucial factor to the evaluation of a complex system engineering. The interior sound of EVs is treated with the same care as that of the classical engine. The vibration noise amplitude of EVs has been reduced to allow the sound inside the vehicle to be softer, in response to the ongoing advance to the control technology of the wind noise, road noise, motor noise, air tightness, and acoustic package, which lays the foundation for the study.
Active control technology, used to reduce the noise vibration to improve the passenger comfort, is key to EV sound design. It is therefore necessary to carry out research on this technology.
The link between sound quality (SQ) and vehicles is highlighted as a key area for analysis and discussion, to understand how vehicles interact with their interior sound, as well as how the two are perceived and understood. Fang and Zhang 1 analyzed the sound characteristics of the electric powertrain (E-PT) through objective evaluations with the representation of acoustic tests and subjective evaluation, confirmed the validity of the corresponding prediction model, and demonstrated the feasibility of sound quality. For a knowledge of EV sound characteristics, attention has to be paid to such well-known figures as Swart and Bekker. 2 They proposed a new EV sound satisfaction metric depending on several existing objective acoustic metrics. Gwak et al. 3 applied psychoacoustics and music harmonic theory in a creative way to find out the most acceptable sound for passengers. The engine sound was synthesized from two sounds, one traveling when the machine is running, and the other coming in the process of combustion, whose acquisition was completed by Min et al. 4 who proposed important parameters for evaluating the synthesized sounds. In the work of evaluation, auditory experiments were allowed to identify the sound properties of the vehicle. Fang et al. 5 proposed a novel method based on contribution assessment for testing and enhancing the sound quality of electric power systems. The results of the subjective evaluation show that the model can improve the sound quality. Mosquera-Sanchez et al., 6 for the purpose of improving the SQ of interior noise in vehicles, introduced a new model that used loudness, sharpness, and pitch as the main metrics for the method design. He et al. 7 presented a psychoacoustic model for the identification of vehicle noise sources that were analyzed by means of computational listening scene analysis and independent segmentation analysis, which helps optimize the sound quality in the vehicle interior.
As passengers become more demanding about sound quality, the question of how to raise SQ is beginning to receive widespread attention, which initiates lively discussion about the prospects of vehicle sound quality in its future development. Tan and Tan 8 generally described the hot topic of sound quality, including the way in which it could be improved in a machine and correlative techniques of subjective and objective evaluation. As discussion extents, sets of methods and principles for studying sound quality achieve progress. Zhuang and Zuo 9 tested the sound signals of different models of cars driving at various speed conditions and played back the test signals using HAR (HEAD Audio Recorder) software. A new model between objective acoustic parameters and subjective evaluation was constructed by the relevant software. Song and Yang 10 constructed a model to evaluate the sound quality of the car by means of BP (Back Propagation) neural network. Sharpness, loudness, and roughness were used as reference indicators for evaluating sound quality. The test results showed that the model was realistic and feasible and the sound quality synthesized by this model in accordance with the relevant standards. Lee et al. 11 presented the correlation between psychological and physiological acoustics of car sounds. Correlations between subjective tests and factors were obtained on the basis of correlated acoustics. Finally, correlations between subjective evaluations and brain EEG (Electroencephalography) were obtained. A new evaluation scheme was developed for evaluating the quality of the interior sound of passenger cars. Seo et al. 12 developed an improved sound quality evaluation scheme that was applicable to mono-channel characterization and multichannel characterization of signals, taking both “spatial” and “timbral” characteristics into account, and that is important for testing the quality of multichannel sound. Jeong et al. 13 developed a new sound quality index that took four parameters used by Zwicker, and that received Mahalanobis distance as the basis to project the results of subjective evaluation of sound quality. It has been demonstrated that the log Mahalanobis distance was a new sound quality index employed for the assessment of vehicle performance. Bernardi et al. 14 conducted a sound quality test on perceptual aspects for different algorithms of AFC (Adaptive Feedback Cancellation). The correlation between subjective and objective scores suggested that objective measures can predict the quality degradation phenomenon caused by acoustic feedback and AFC artifacts. Liang and Zhao 15 depended on speed tracking psychoacoustic metrics and deep CNN (Convolutional Neural Network) to study the non-stationary interior noise of pure electric vehicles and propose a planned way for predicting its quantitative sound quality.
The continuous advancement of technology is the biggest contributor to the ASGS, which allows the sound of vehicle to become more active. Liang and Zhao 16 designed a new active sound production model by means of a GAN (Generative Adversarial Net) model to diversify the sound imitation of EV engine, as well as to improve the accuracy of this imitation. The test results provided further evidence for the model that was able to learn distribution feature of the original audio signal accurately. Wang et al. 17 established a framework for online secondary path modeling of active tone control systems. Based on the current algorithm, an ASS-LMS (Adaptive Step Size Least Mean Square) scheme for secondary path modeling with interference signals is investigated. In addition, a novel auxiliary noise power scheduling strategy is developed. The simulation results verify the passability of the proposed scheme. Chang et al. 18 investigated a sound generation method using vibration actuators and microphones in order to fit to obtain similar engine sounds in an electric vehicle. The results show that the method can perform noise cancellation well and will be a new form of sound system for modifying noise to achieve the target sound. Lee et al., 19 for abating the engine noise of a car, organized a new ANC (Active Noise Cancellation) scheme whose positive effect on noise was confirmed by simulation tests. Simulation tests demonstrate that the ANC system of the proposed scheme can better reduce the engine noise in the cabin of the car. Lee and park 20 for complying with higher requirements for sound quality in the vehicle interior, proposed a corresponding optimization strategy, the results of which were verified and tested by a sound quality objective evaluation (SQOE) model. Anthony et al. 21 introduced an active noise control (ANC) system for mufflers, performing real-time experiments. The active noise equalizer (ANE) was also experimented and designed to achieve engine sound tuning. Wang et al. 22 developed a psychoacoustic model of sound quality using psychoacoustic parameters, the predictions of which were applied to measure not only the sound performance of several technical design modifications, but also the perceived performance of engine sound.
Liu et al. 23 developed a strategy on in-vehicle noise targets for subjective evaluation methods and acceleration conditions, proposed a CAPC (Continuous Assessment by Predefined Categories)-based method applied to subjective evaluation, and discussed the research process for sound quality targets, which has attached value on the design of sound quality during acceleration of passenger cars. Zhang 24 used a GAN model to recreate an active sound creation model for electric vehicles aiming at advancing the electric vehicle engine sound. The results showed that it could accurately memorize the characteristics of the audio signal. Wu 25 measured the strength of the sound to control the external noise of electric vehicles under the condition of acceleration, and found that the correct rate of noise control became higher, the reaction faster, and the performance better. Lee et al. 26 introduced a sound quality index for assessing interior noise of vehicle, the importance of which was indicated by a comparison of relevant aspects between present and past factors. A correlation comparison was obtained between acoustic parameters and subjective evaluations. Finally, a comparison of relevant aspects between present and past factors was carried out to verify the value of the proposed index. Zeng and Sun 27 took the advantage of the Zwicker steady-state time-varying method to predict a sound quality on the basis of psychoacoustic parameters, through which a new sound quality parameter, SQP-WRW (sound quality parameter base on wavelet and then proceed to RNR-WVD), was developed. The SQP-WRW-based model enjoyed benefits of the improvement of accuracy in prediction for the sound quality when the signal of acceleration was sent out. Feng et al. 28 investigated a new AST (Active sound tuning) system configured with the FDIMLMS (frequency-domain filtered-x lease mean square) algorithm, and the proposed system was able to achieve faster convergence and more balanced performance with simultaneous reduction in computational cost. The test results show that the convergence rate and the balance are significantly improved in most engine speed ranges. Moon et al. 29 made a study to calculate the semantic space of sound quality during engine acceleration for the end user, and also to study the connection with sound characteristics. These works can provide a better sound effect for passengers. Kwon et al. 30 introduced an active in-vehicle sound generation system for active, load-dependent playback of signals extracted from engine vibrations via vibration exciters mounted on the firewall. Kwon et al. 30 developed a psychoacoustic kinematic model for vehicle interior sound for the “moving” image of the vehicle. Experiments under the condition of wide open throttle (WOT) acceleration show that the proposed sportiness model was reliable and could be practically applied.
However, active sound control research based on engine order sound fitting has become increasingly important in current research. Therefore, this study does research into in-vehicle active sound control of EVs, and developed an in-vehicle ASGS combining subjective and objective evaluation, which laid a foundation for the research on in-vehicle active sound control of EVs.
Theoretical analysis
Comparative analysis of in-vehicle sound spectrum
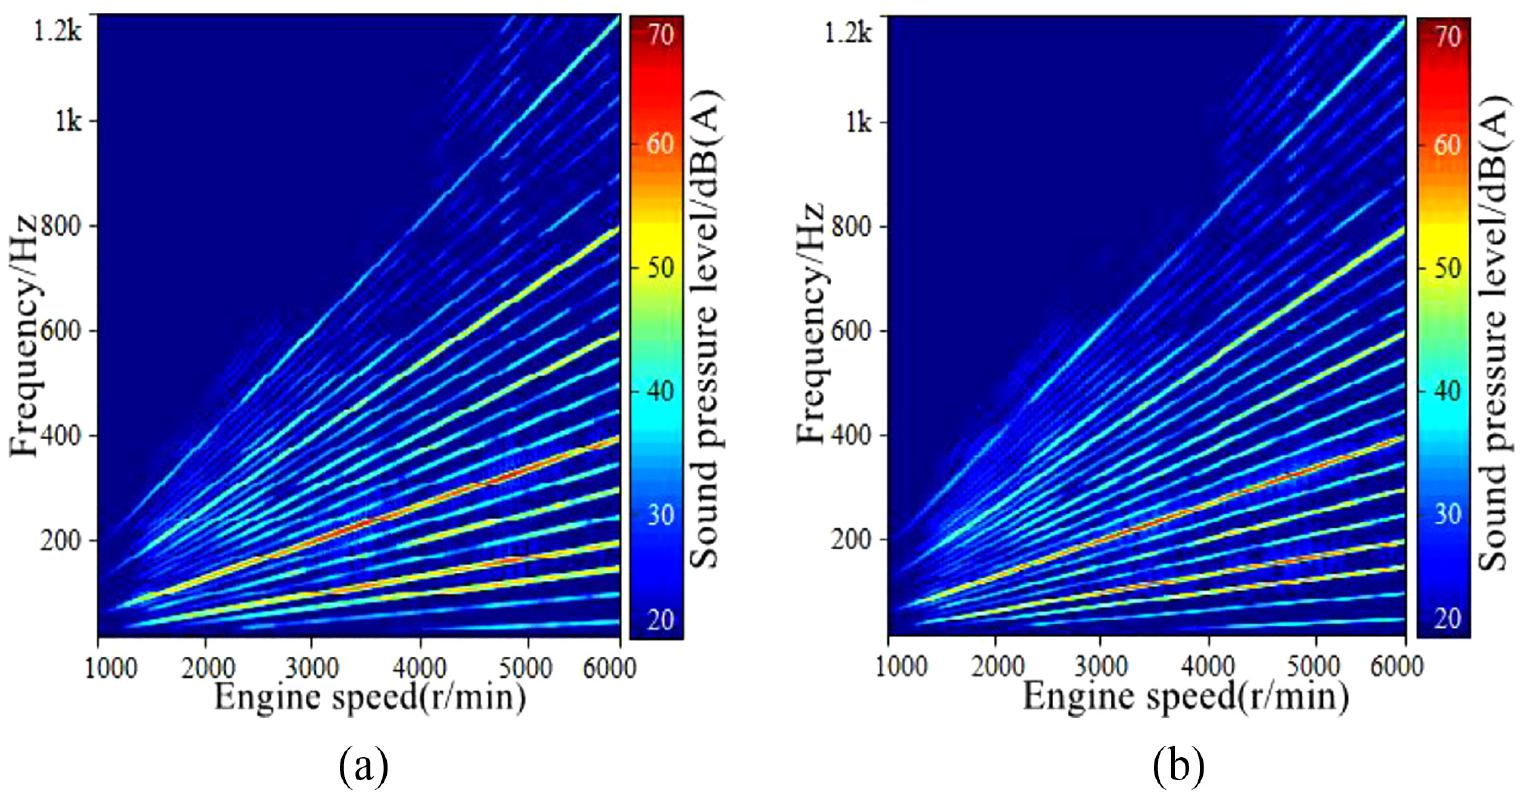
EVs do not possess the engine order component in comparison with FVs, and at the same time, a high frequency component appears for the motor order. Figure 1 compares the in-vehicle sound spectra at the accelerating phase.

Acoustic spectra in the vehicle: (a) EV and (b) FV.
Engine sound can be divided into random engine wire-band sound and deterministic engine order sound.
A gasoline four-stroke engine’s ignition excitation frequency can be summed up as follows:

where the variables
Theoretical basis
Analysis of engine order sound model

Where, the variables
When engine speed is ne:

Where, the variables
The in-vehicle engine order sound has an continuous-time signal

Analysis of sound signals
Fast Fourier Transform (FFT) can only analyze and process signals in a single dimension of time domain or frequency domain. For the time-varying sound signal of the engine in-vehicle, time and frequency information need to be obtained at the same time. Therefore, a discrete Fourier Transform extension method-STFT method, is adopted.
Discrete short-time Fourier transforms and discrete time Fourier synthesizations are illustrated as:


Where,
If

Where,
It is necessary to make a trade-off between time resolution and frequency resolution, so the choice of analysis window function is very significant.
Window function analysis and selection
Rectangular windows, Hamming windows, Blackman windows, Hanning windows, Kaiser windows, and others are commonly used.
As can be seen in Table 1, each window function has a pair of key parameter pairs that describe its frequency response characteristics.
Key parameters.

For this paper, to obtain good frequency resolution in low frequency band, a ideal window function requires adjustable main lobe width and low amplitude side lobe peak to reduce frequency leakage.
Highly flexible kaiser window can control length N and shape parameter, as well as adjust the width of main lobe and side lobe peak. When the window length

Comparison of Kaiser window spectrum curves with the same window length and different

Comparison of Kaiser window spectrum curves with the same
In the low engine speed interval, the frequency of engine order harmonic components is relatively low, the frequency resolution is preferred to the time resolution, and the shape parameter
The STFT is applied to the quasi-steady time-varying signal of the engine order sound, through which a long interception time and a high precision time resolution in the whole engine speed range is obtainable. Meanwhile, the Kaiser window function can obtain an outstanding frequency resolution by controlling the
Sound fitting
Engine order sound test and analysis in-vehicle
In a test site with a horizontal and smooth road, the engine revved uniformly toward rated speed from the lowest speed, with the three-speed transmission set and the accelerator pedal slowly depressed. The time the whole acceleration spent was more than 20 s, and the sampling frequency reached 51.2 kHz. The SCR205 multi-channel data acquisition equipment manufactured by Siemens was used to test and acquire the FFT spectrum of the sound inside a FV during accelerated driving, see Figure 4.

Sound spectrum inside an accelerating FV.
Synthesis and validation
Figure 4 records the short-time Fourier transform. The main parameters included an overlap rate of 50%, a

Synthesized time-domain signal of in-vehicle sound during accelerating.

Synthesized sound spectrum of an accelerating vehicle.
The subtle difference of the synthesized engine order sounds demonstrated by Figures 4 to 6 lies in the low-speed region and the high-order sub-region, and the change of the amplitude of some order components in Figures are discontinuous to a certain extent. The main energy region and the amplitude of the main order components are similar with the original input signal.
By subjective audition, the original sound signal scored 7.2 and the synthesized sound signal scored 7.1. Subjective audition reflects that the difference between subjective hearing of the two is negligible. The authenticity of the synthesized sound is slightly different from the original sound signal, mainly comparing the clarity and sound pressure level levels in Figures 4 and 6, which are caused by synthesis errors.
Depending on the Kaiser window function the STFT and synthesis technique is able to satisfy the requirements of the fitting accuracy of the engine order sound and to stimulate the start-up sound of the active sound control system.
EV sound design
Research on sound control requirements
The research object is a class-A SUV purely powered by electricity, whose sound should be comfortable and power sense sound quality.
When accelerating, the sound in-vehicle should reflect the power sense by simulating the dynamic change of the engine order sound, and the dynamic response of the engine sound amplitude with the acceleration of the vehicle should be controlled within a reasonable range. When the vehicle maintains a constant speed, the sound in-vehicle should keep the amplitude of the original EV sound as far as possible for the passenger comfort, while retaining the appropriate engine order sound.
Guidelines for sound design in accelerated driving vehicles
The specific performance of the sound quality in the accelerating FV is as follows:
(1) The more engine orders, the more harmonious the sound, on the contrary, the more monotonous. Multi-cylinder engine has more order components and strong sound plasticity.
(2) In the range of frequency domain, when the engine order energy is concentrated in the range of middle-high frequency, the sound quality of the vehicle tends to motion. When concentrated at low frequency, it shows a sense of power.
(3) Engine order sound amplitude will increase as engine speed increases, thus enhancing the sound quality experience of power sense in-vehicle.
Concerning this study, reliable guidelines of in-vehicle sound design for EVs are as follows: derived from human auditory subjective perception, the sound design of ASGS for EVs is carried out from such aspects as engine order composition: engine order composition, energy distribution in frequency domain, and sound amplitude enhancement.
Subjective perception analysis
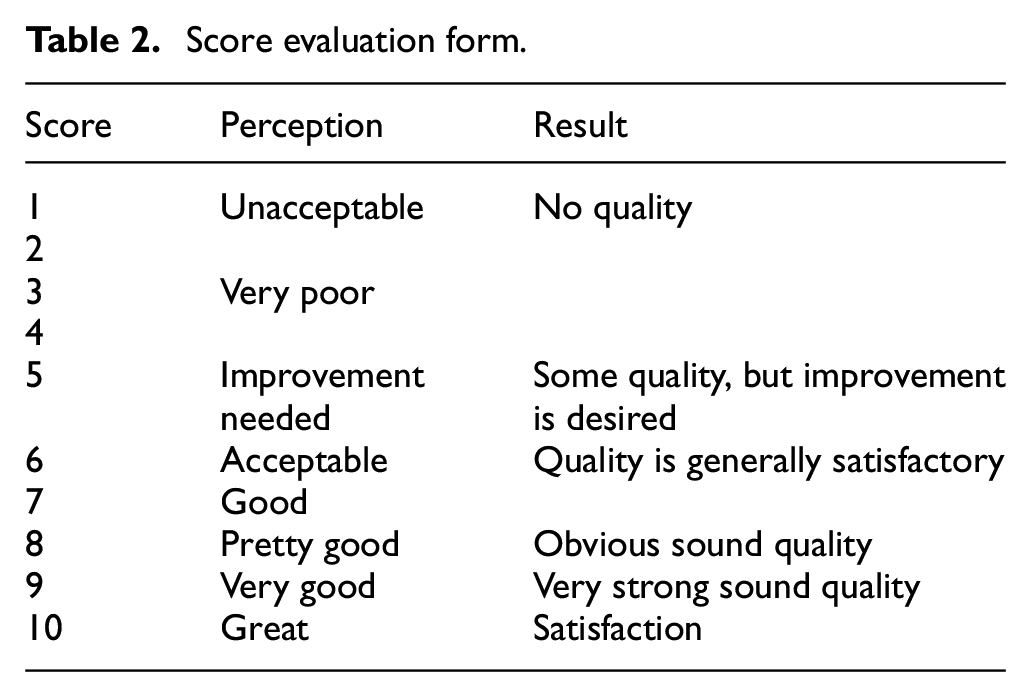
NVH engineers who are seasoned veteran in evaluating acoustics, established a team for subjective evaluation. The subjective perception were divided into 10 levels according to the condition of accelerated driving and the indicators for evaluation, that is, power and comfort of sound, as Table 2 has detailed.
Score evaluation form.
The in-vehicle sound was captured using a sound capture and playback method with a HEAD Acoustics artificial head. The head was adjusted to achieve the same position as that of an 1.7 m-tall evaluator sitting in the passenger seat, as shown in Figure 7.
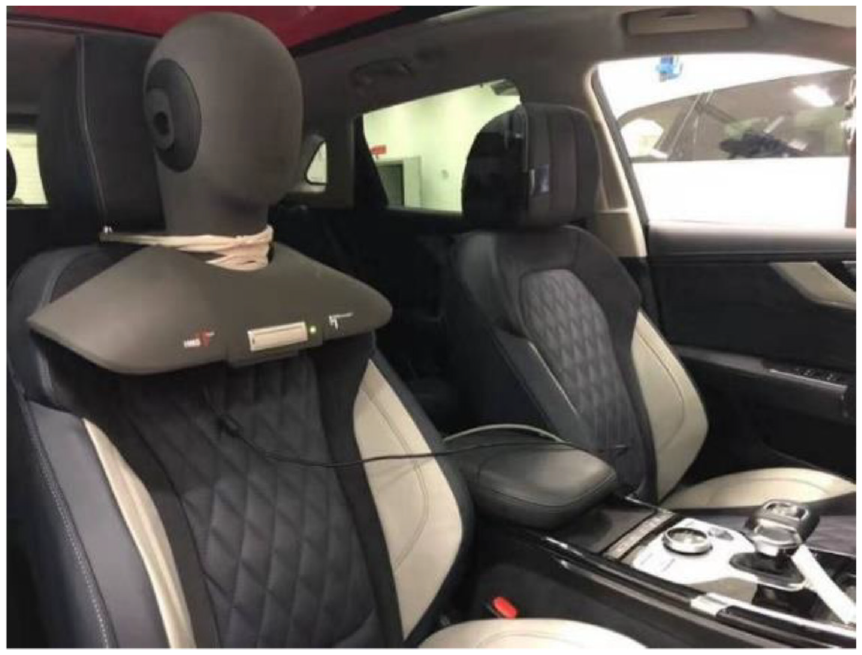
HEAD acoustics artificial head in-vehicle sound measurement points.
Table 3 lists 14 samples of test vehicles and their information. For a EV driving on the surface of a horizontally smooth road, its gear was shifted to D gear, its accelerator pedal was opened to 100%, and its speed built up from the lowest stable condition to 120 km/h, in the process of which the in-vehicle sound signal and the motor speed signal were synchronously collected. The FV was shifted to third gear, on full throttle, whose engine speed gained from the lowest to 6000 r/min at full load, during which in-vehicle signals was acquired.
Basic information of the test vehicle.

The final result of subjective evaluation of each sound sample is indicated in Figure 8.

Subjective evaluation results of sound quality.
Figure 8 indicates that the power sense quality is more obvious at the top. The right side of the comfort quality is more obvious. Diagonally, the upper right corner has both sound features.
The FFT spectrum analysis is conducted for 14 samples, as shown in Figure 9.

FFT spectrum of the accelerated in-vehicle sound of each evaluation sample.
According to Figures 8 and 9, details are the following:
The sound inside the car is closely connected to the order composition of the engine as well as the energy distribution. Sound of accelerated driving vehicle, perceived as comfortable, is clearer when engine order components are below 400 Hz, less clear above 400 Hz, there is a very obvious engine main order (order 3 or 4) component sound. Power accelerated driving vehicle sound: engine order components above 400 Hz than below 400 Hz more clear.
Sound amplitude local enhancement area determination
Through the analysis of drivers’ dynamic driving behavior, the expected speed interval under different driving condition of acceleration and uniform are obtained, as shown in Table 4.
Most likely speed intervals.
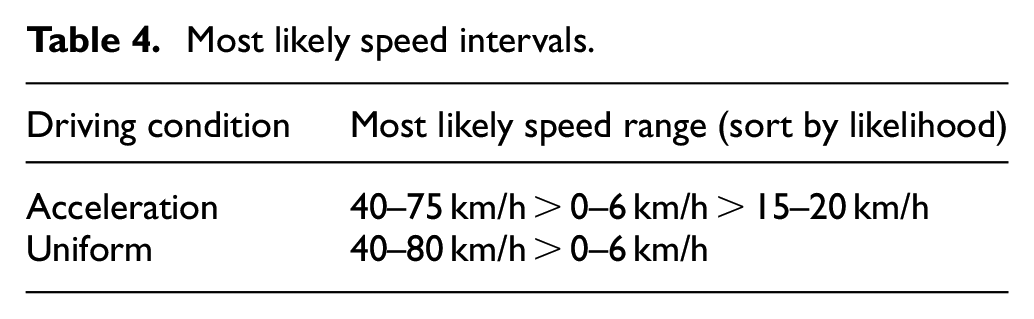
Seen from Table 4, 40–75 km/h is the speed interval with the maximum possible acceleration, and the corresponding virtual engine speed interval of 2500–4000 r/min is the preferred interval to enhance the power sensing of the ASGS.
Determine the in-vehicle sound design scheme
According to the above principles, determine the design requirements:
(1) Establishment of an order architecture with engine order 4 as the main component and other engine integer orders and half-orders as supplementary components, with engine order components to include the 20–1200 Hz range.
(2) Engine order components below 400 Hz are required to have a greater sound amplitude than those above 400 Hz.
(3) The sound amplitudes within 2500–4000 r/min virtual engine speed were appropriately enhanced.
Software LEA was employed to deal with engine order component sounds, and four sound amplitude gain schemes were developed for the virtual engine speed interval of 2500–4000 r/min. Four schemes show variation curves of the total sound value varied with the engine speed, as illustrated in Figure 10, and the FFT spectrum is shown in Figure 11.
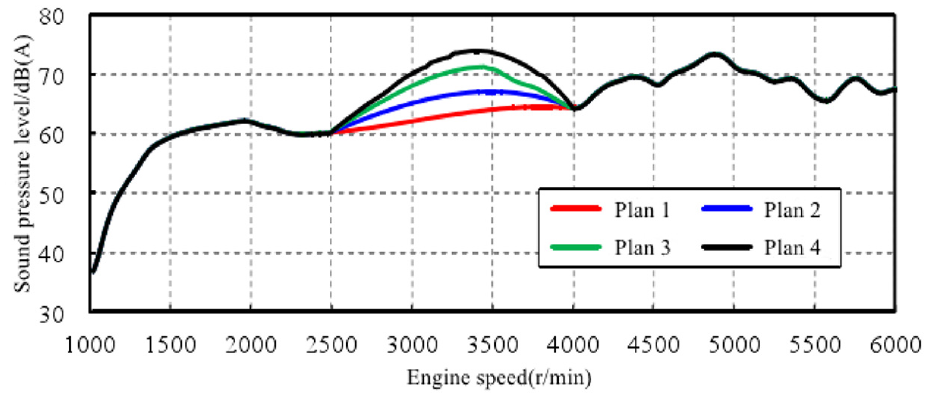
In-vehicle sound design alternatives.

FFT spectrum of in-vehicle sound design alternatives.
The details of subjective evaluation are depicted in Figure 12.

Distribution of subjective evaluation results of the four design schemes.
In accordance with Figure 12, scheme 1 and scheme 2 tend to allow the sound to be comfortable and to have relatively weak power sense. The fourth scheme tends to weaken sound comfort yet to strengthen that of power feeling; scheme 3 tends to achieve the same level of the sound comfort and power, and is used for the ASGS in EVs.
In-vehicle sound total target set
Accelerated driving condition
A FV with the same location as the EV was compared, and the relationship between engine order sounds and other background sounds was analyzed. The target trend line of sound amplitude of the ASGS and the target trend line of total sound value of the EV were formulated, as shown in Figure 13.

Target trend line for sound amplitude of ASGS at 100% pedal opening.
According to the target trend line of the sound amplitude of the ASGS, the changing trends of the sound amplitude in scheme 3 was appropriately modulated to obtain the sound amplitude change curve of the system at 100% accelerator pedal opening, as demonstrated in Figure 14.

Target curve of total sound value in scheme 3 at 100% pedal opening.
The adjusted scheme retains the 2500–4000 r/min sound amplitude enhancement area, and the total sound value of the system is consistent with the trend of the total sound value of the FV engine order in the whole speed area.
Uniform driving condition
Table 5 details the speed of A-class pure electric SUV that responds to each virtual engine speed, and the sound amplitude of SUV at each speed.
Sound test results of EV driving at constant speed.
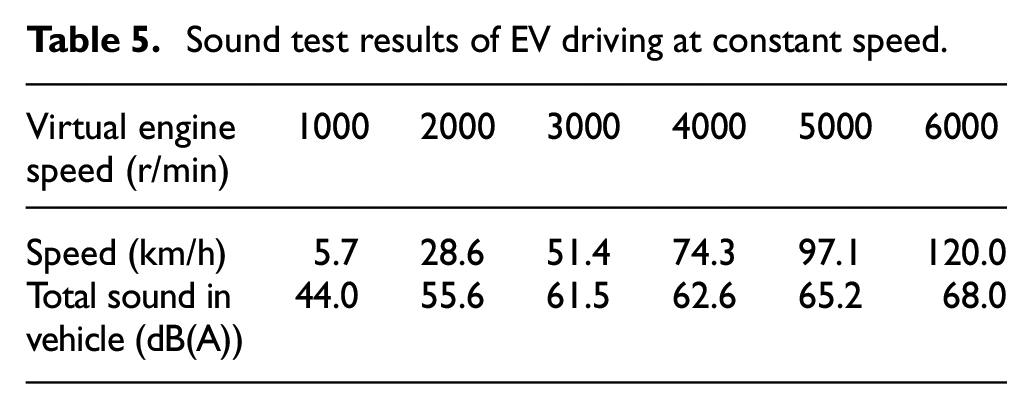
The target of the sound amplitude and the total value of the in-vehicle sound of ASGS under the condition of uniform speed is set, in the light of the original sound in-vehicle sound of the EV, which is revealed in Table 6.
Total value of in-vehicle sound and sound amplitude target setting of ASGS for EV driving at constant speed.

Under the condition of uniform speed, a requirement is that the target value is in no way exceeded by the sound produced by the system, so as to keep the noise at the low amplitude and better have the comfort sound quality control.
Active sound control methods
In-vehicle sound spectrum analysis
The parameters that satisfy the condition of the sound control are the vehicle speed and pedal opening.
The pedal opening that changes from 40% to 90% reveals the dynamic characteristics of vehicles. The FFT spectrum analysis is carried out for the sound signal in vehicles as FVs are accelerating with partial pedal opening. Primary parameters are the following: spectrum analysis range 20–12.5 kHz, frequency resolution 4 Hz, engine speed analysis interval 20 r/min. Figure 15 shows the FFT spectrum.
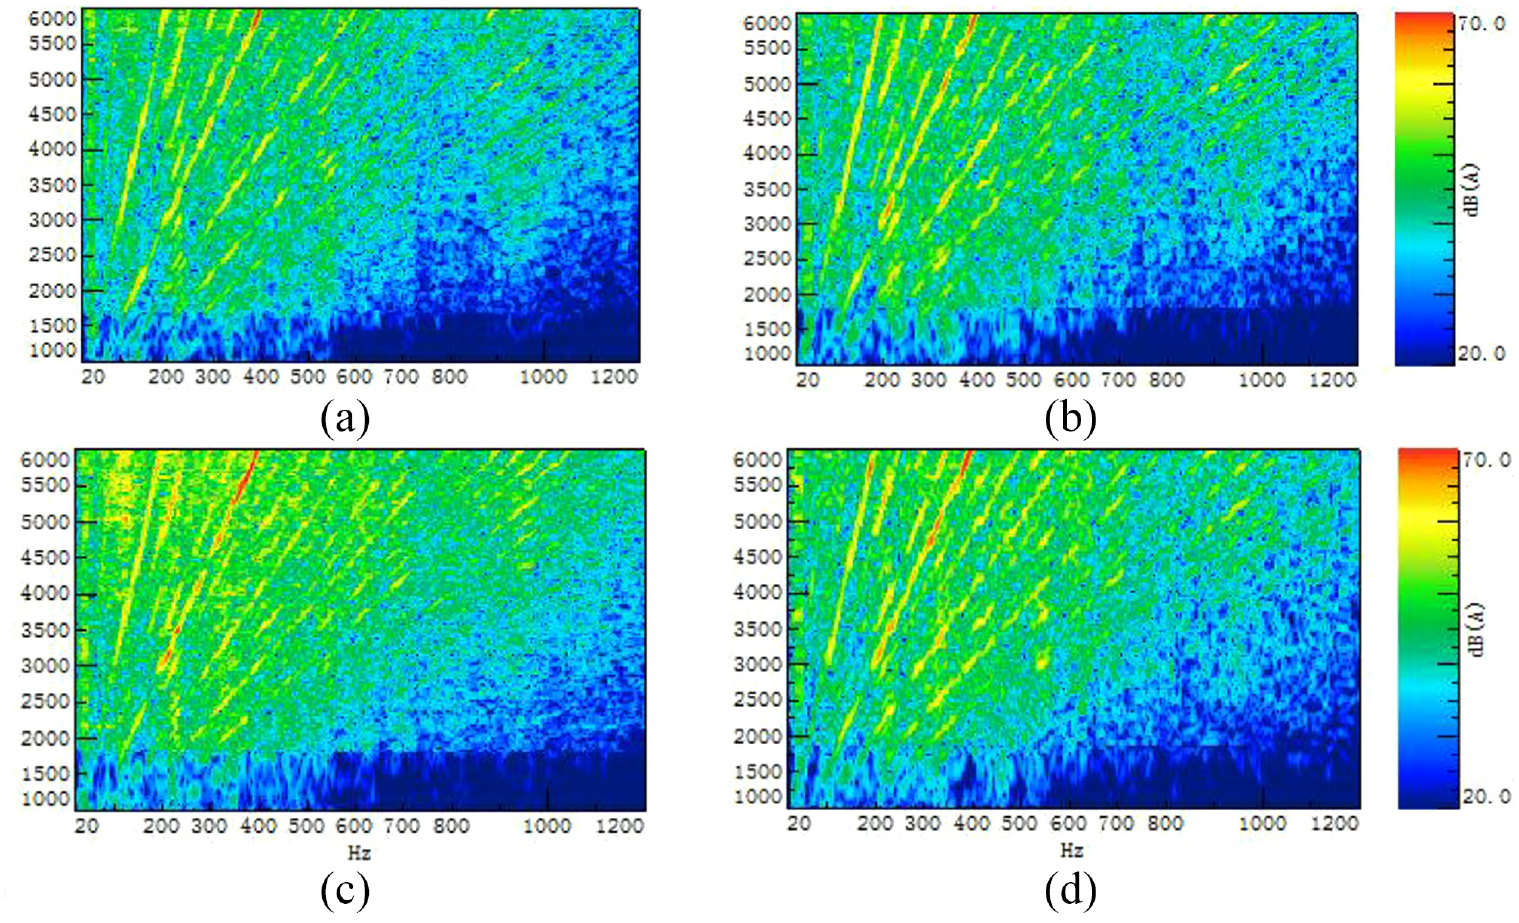
FFT spectrum of vehicle sound variation with engine speed during accelerated driving: (a) 40% accelerator pedal opening, (b) 50% accelerator pedal opening, (c) 80% accelerator pedal opening, and (d) 90% accelerator pedal opening.
Sound extraction method
Direct extraction method: First of all, FFT analysis is performed on the sound inside the vehicle and the engine speed data to collect spectrum cloud. Then the target engine order is selected using the automatic extraction function. Finally, the order components of the engine are retained by the separation function.
The engine order components were extracted by direct extraction method based on in-vehicle accelerated driving as accelerator pedal was open by 40%, and the result was shown in Figure 16.

Front and rear vehicle spectrum comparison: (a) before extraction and (b) after extraction.
Indirect calculation method: Firstly, the spectral cloud map of engine speed tracking is obtained by the first method. Then, all prominent engine order components in the spectrum are selected, and all the selected components are erased, after which only road noise and wind noise are left in the interior sound. Finally, the sound pressure level subtraction of the original sound data and the erased sound data are examined to capture the engine order sound data.
Through indirect calculation method, order component erasure was carried out on the sound inside the vehicle when the pedal opening was 40% accelerated, and the results were shown in Figure 17.

Comparison of in-vehicle spectrum before and after engine order component erasure: (a) original vehicle state before erasure and (b) after erasure.
Occasionally, the results of the indirect calculation method are greater than the direct extraction method in the entire speed range. The direct extraction method can be used for the extraction of engine order components and amplitude calculation in all accelerated driving conditions. In order to improve efficiency, the direct extraction method was adopted to calculate the order sound amplitude of the engine during acceleration in an attempt to achieve greater efficiency. In the diagram, gray area on the left is the part that is expected to be extracted, and the area on the right is the result after extraction.
The diagram showed the both methods (seen in Figure 18).

Two methods schematic diagram: (a) direct extraction method and (b) indirect calculation method.
Correlation analysis of sound amplitude and power sense
For the FV, the process from accelerator pedal pressed to the final engine sound sent out is extremely systematic and complex. The sound amplitude that varies with the engine speed in each operating condition is summarized by Figure 19.
The trend of engine order sound amplitude in each condition.
Seen from the change trend, the speed interval of 3000–6000 r/min is the stable growth zone, the speed interval of 1800–3000 r/min is the stable transition zone, and the speed interval of 1000–1800 r/min is the initial rapid change zone.
The sound amplitude of engine speed such as 3000–6000 r/min produced as accelerator pedal is open to different degrees is extracted from Figure 19, and the correlation analysis of accelerator pedal opening and engine output power is carried out. The amplitude curve of the engine order sound, which changes with accelerator pedal opening and the engine output power load ratio, is demonstrated by Figures 20 and 21, respectively.

The correlation between the order sound amplitude and the percentage of accelerator pedal opening.

The correlation between sound amplitudes and the engine output power load ratio.
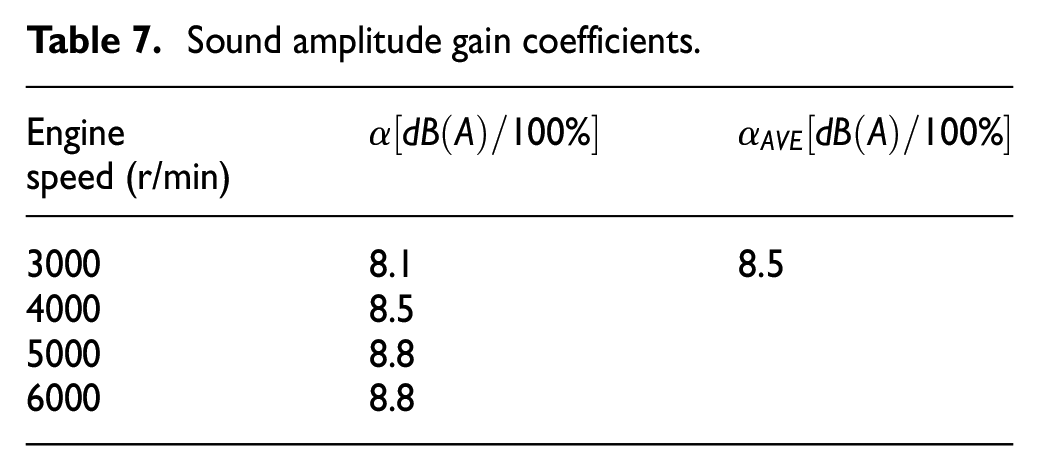
The mean value of sound amplitude gain coefficient
Sound amplitude gain coefficients.
Analysis of active sound parameter setting
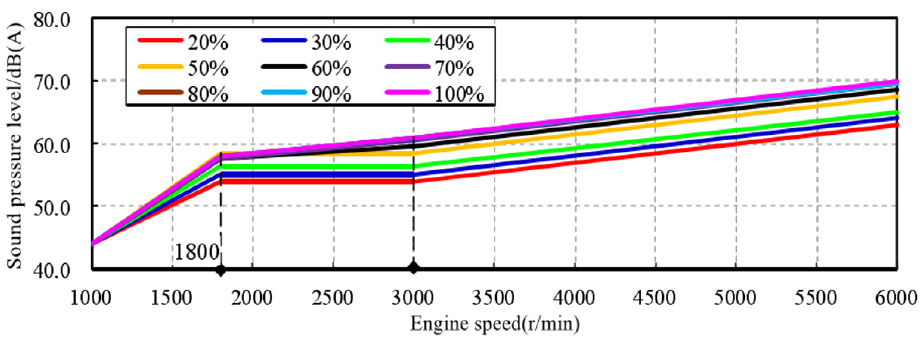
According to the EV motor speed and torque, calculate the motor output power under 20%–100% accelerator pedal opening. Figure 22 shows the motor output power that changes with the speed under 20%–100%, Figure 23 depicts the distribution of motor output power, and Figure 24 demonstrates the motor output power that varies with accelerator pedal opening at varying motor speeds.

The correlations between motor output power and motor speed under different percentages of accelerator pedal openings.

Motor output power distribution cloud.

Variation curve of motor output power with pedal opening at different motor speeds.
According to Figure 22, the output power of the motor increases linearly, in contrast with the flat growth of the power at a certain motor speed.
In terms of Figure 24, there is a steep rise in the motor output power as the accelerator pedal opens steadily and the motor speed exceeds 3000 r/min. The motor output power still climbs markedly when the speed increases within the interval of 1500–300 r/min, and when the pedal opens within the range of 20%–80%. Yet the motor output power increases significantly with the pedal opening no more than 20%–60% and with the speed dropping from 1500 r/min. There is a linear rise in output power of the driving motor within the closing and the opening of the pedal, as illustrated in Figure 25.
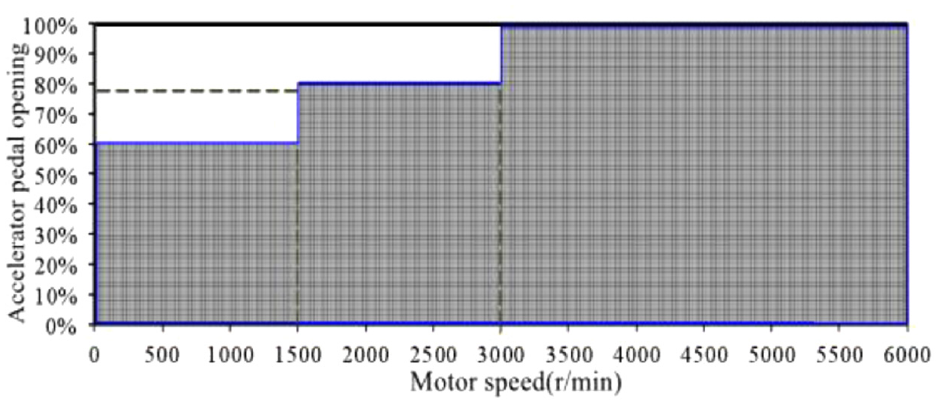
The output power varies linearly with the opening of the accelerator pedal.
When the EV is in the operating condition as shown in the figure above, the motor power is linearly varying with the opening of the accelerator pedal. According to the changing relationship, the active sound control can achieve both comfort and power quality. The control strategy is revealed in Figure 26: sound amplitude gain coefficient:

Control curve of sound amplitude gain.
In FVs, the engine order sound amplitude shows a rapid growth when the engine speed is below 1800 r/min while the sound amplitude holds steady when the engine speed exceeds 1800 r/min.
The speed of 24 km/h equal to the virtual engine speed of 1800 r/min was used as the inflection point speed as shown in Figure 27. Before the inflection point speed, the sound amplitude needs to be properly “faded in.” At this time, the comfort is the main thing. The sound provides both comfort and power when driving past the inflection point. The relationship between sound amplitude and vehicle speed will be based on the trend of sound amplitude at 100% pedal opening and combined with the relationship between sound amplitude gain and pedal opening to realize the adjustment of sound amplitude at each pedal opening with the trend of vehicle speed.

Control curve of sound gain with speed.
Amplitude gain of sound is controlled with vehicle speed. The minimum sound amplitude gain, which corresponds to a vehicle speed of 0 km/h, needs adjustments to meet the needs for comfortable acceleration.
Through the synergistic control of pedal opening degree and vehicle speed, the ASGS can realize different sound amplitude control and generate corresponding feedback sound.
ASGS for EVs
Design of ASGS in-vehicle
The writing of the ASGS software uses C language. The software program is designed and modularized for the coherence of structure and the operability of debugging, the software program is designed modularized. The workflow is shown in Figure 28.

ASGS program workflow diagram.
Module assembly in the controller physical object is described in Figure 29.

Active sound controller.
Hardware system performance test
To guarantee that the ASGS in-vehicle functions normally and stably, CAN signal and audio are tested, as shown in Figure 30.

Performance test: (a) CAN signal test and (b) audio signal test.
According to the test results, CAN signal and audio signal suit the requirements of design.
Construction of ASGS
The vehicle CAN information reading
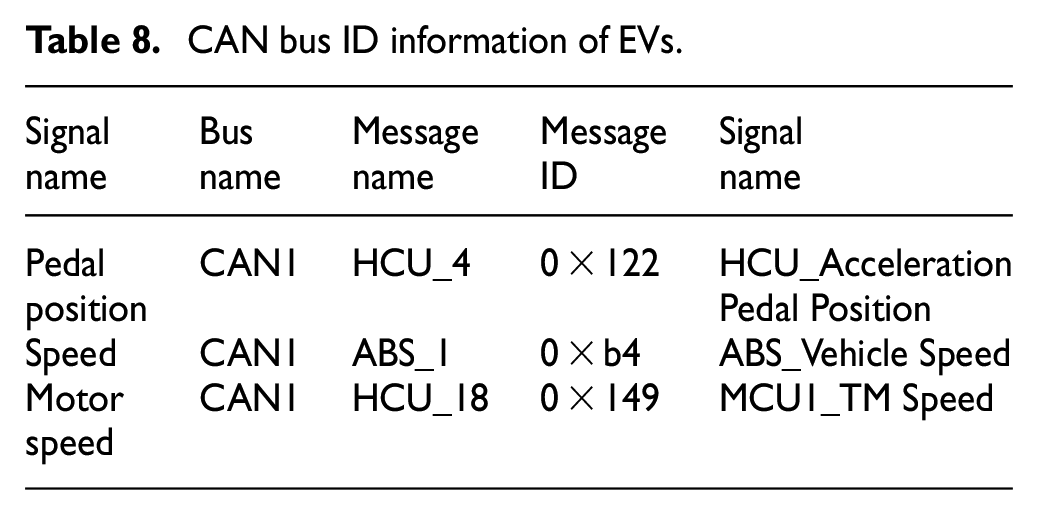
CAN information is analyzed by importing the CAN BUS DBC file of the vehicle. The ID information of such signals as vehicle speed, motor speed, and accelerator pedal position is shown in Table 8.
CAN bus ID information of EVs.
System construction
Amplifier: The trunk comes equipped with the audio amplifier to which six speakers are connected by the wiring harness.
Speakers: Two low frequency speakers are installed on the left and right front doors, two full frequency speakers on the left and right rear doors, and two high-frequency loudspeakers in the joint between pillar A and the instrument panel, as shown in Figures 31 to 33.

Position of low frequency speaker.

Position of full frequency speaker.
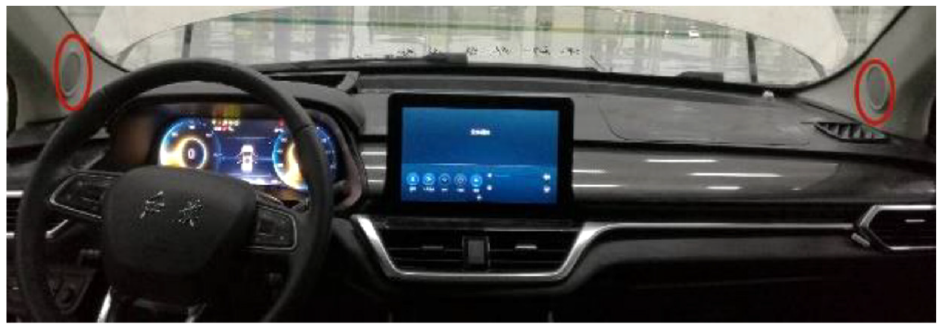
Position of high-frequency speaker.
ASGS sound synthesis accuracy verification
The process of test is the following. On the test environment that all doors and windows are closed, one tester is arranged in the driver’s position. Near the right ear of the position, all-pointing microphone of 4189-A-021, by reference to the method of “GB/T18697-2002 acoustic automobile interior Noise Measurement Method,” is installed to record the sound signal. On the passenger seat, Siemens SCR205 multi-channel data acquisition front end is accessed.
In GB/T18697-2002, a measurement point must be selected in the driver’s seat. For cars, an additional measurement point can also be in the rear seat. During the test, there must be no person in the selected measurement position except the driver’s position. The distance of the microphone from the cabin wall or seat cushion must be greater than 0.15 m.
The layout is seen in Figure 34.

Measurement points of the frequency response.
The final sound scheme of accelerated driving is discretized, and the amplitude, frequency, and phase of each engine order component are obtained by Fourier transform, which are imported into the active sound controller. The active sound program retrieves the corresponding sound parameter information for engine order sound synthesis, then determines the overall sound amplitude based on information of the accelerator pedal opening and the speed, and finally collect sound playback through the hi-fi speaker.
The input signal of virtual engine speed is set to the same data as in scheme 3, that is, the speed accelerates from 1000 to 6000 r/min, and the accelerator pedal opening is 100%. The hi-fi speaker volume is thus adjusted to match the sound amplitude of scheme 3 to test the sound signal generated by the speaker during the change of virtual engine speed. From the test, the time-domain signal employed to simulate the sound produced as the vehicle accelerates is shown in Figure 35. The original time-domain signal from Scheme 3 is depicted in Figure 36, and the spectrum analysis in Figure 37.

Time domain signal of sound in-vehicle simulating accelerated driving.

Time domain signal under scheme 3 sound design.
FFT spectra of two sound states with virtual engine speed: (a) test and (b) design.
The analysis of test results shows that two kinds of time domain sound signals are basically consistent, but slightly different in the range of 15–18 s. In the subjective evaluation audition, the two states of engine sound are in agreement. Spectrum analysis proves that the sound synthesized by the system can restore restore sound characteristics from the design. As a result, the ASGS of the engine sound fitting precision can satisfy requirements.
Validation of target of the ASGS under the static condition of real vehicle
System simulation acceleration target achievement verification
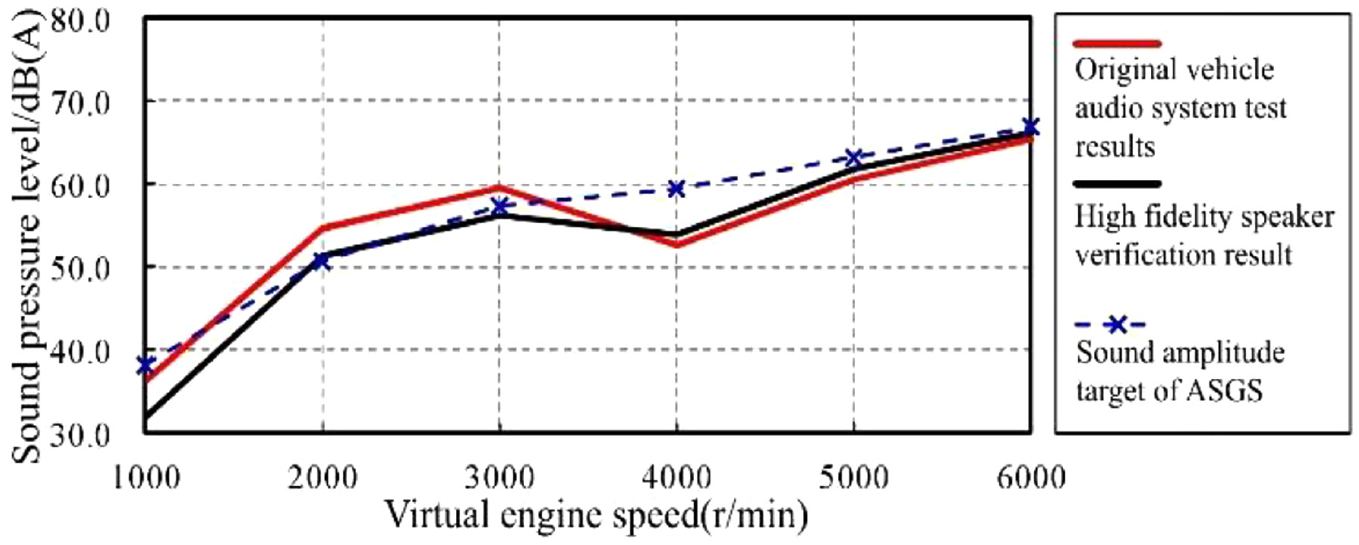
The test results under each accelerator pedal opening were processed to obtain the curve of the real vehicle sound amplitude with the virtual engine speed, as shown in Figure 38. The sound amplitude target of the system under the condition of 100% accelerator pedal opening is reached, as demonstrated in Figure 39. FFT spectrum analysis is performed on sound produced when the engine is at full throttle, results of which compares two sound spectra, respectively from hi-fi speaker test and vehicle sound system test.

Variation curve of measured sound amplitude gain with virtual engine speed.

Sound amplitude change curve of the original vehicle sound system simulating accelerated driving condition.
Seen from Figures 38 to 40, the change curve of the original vehicle audio sound amplitude is consistent with the target trend line of hi-fi loudspeaker verification results. In terms of the overall change trend, the sound amplitude at each speed increases linearly with the change of the accelerator pedal opening.

Sound comparison of simulated acceleration engine under 100% accelerator pedal opening: (a) hi-fi speaker test and (b) vehicle sound system test.
The test that simulates uniform speed and adopts static original vehicle sound system is run, whose results are shown in Table 9 and Figure 41.
Test results of simulated uniform speed under static condition of real vehicle.

Sound amplitude reaching standard in simulated uniform speed condition under static condition of real vehicle.
System simulated uniform speed conditions target achievement verification
The test results of simulated uniform speed condition under the condition of static original vehicle sound system are shown in Table 9 and Figure 41.
In the middle and low speed area, the sound of the ASGS is more obvious. In the high speed area, the sound amplitude of the system is moderate, which can maintain the noise level in the low amplitude in the vehicle at a constant speed.
Test and analysis of ASGS
Objective test and analysis
Accelerated driving condition
The sound signal of the driver’s right ear, as ASGS runs and stops, is tested at 100% accelerator pedal opening. Figure 42 depicts that sound pressure level of three signals changes with the change of virtual engine speed. Figure 43 shows that sound sharpness of two signals varies with the verification of vehicle speed. Figures 44 and 45 demonstrates the FFT spectra of two signals.
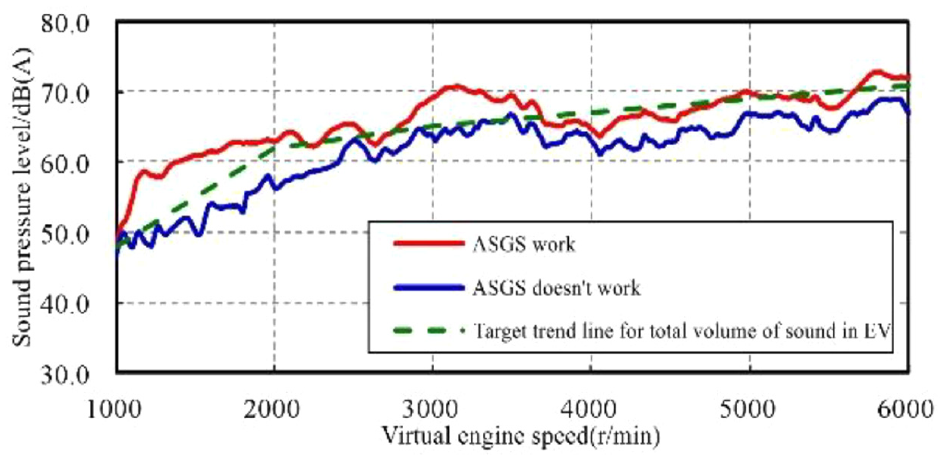
Total interior sound curve with 100% accelerator pedal opening.

In-vehicle sound sharpness curve with 100% accelerator pedal opening.

FFT spectrum of sound in accelerated driving vehicle when ASGS is working normally.

FFT spectrum of sound in accelerated driving vehicle when ASGS is not working.
According to Figures 42 to 45, the trend line for total value of the sound in the EV can generally follow the target line, when the ASGS works normally. The in-vehicle sound sharpness has been improved with maximum improvement up to 1.0 acum, which effectively lessens the discomfort caused by the high frequency order sound of the original vehicle.
The ASGS basically enhances quality of comfort and power sense required in the sound design, from three objective indicators: engine order composition, energy distribution in frequency domain, and sound amplitude enhancement in typical speed range.
Constant speed driving condition
The sound signals of the ASGS in the interior of the car is tested at a constant vehicle speed and under the virtual engine speed of 1000–6000 r/min. Through the test, pressure level and sound sharpness is calculated under operating and non-operating state of the system, as listed in Tables 10 and 11.
Results of sound pressure level at uniform speed.

Results of sound sharpness at uniform speed.

According to data in Tables, results of the sound pressure level are generally consistent with the target value as the ASGS works normally, which confirms that the vehicle noise is in the low amplitude and the comfort quality in the uniform speed driving is likely to be achieved. The sharpness is less than original vehicle, which is reduced by 0.52 acum when the speed is 28.6 km/h.
Subjective evaluation
Subjective evaluation was made on the inside sound of the EV and a coupe type FV under the driving state. The operation process of each working condition was shown in Table 12.
Detailed operation process of subjective evaluation working conditions of real vehicles.

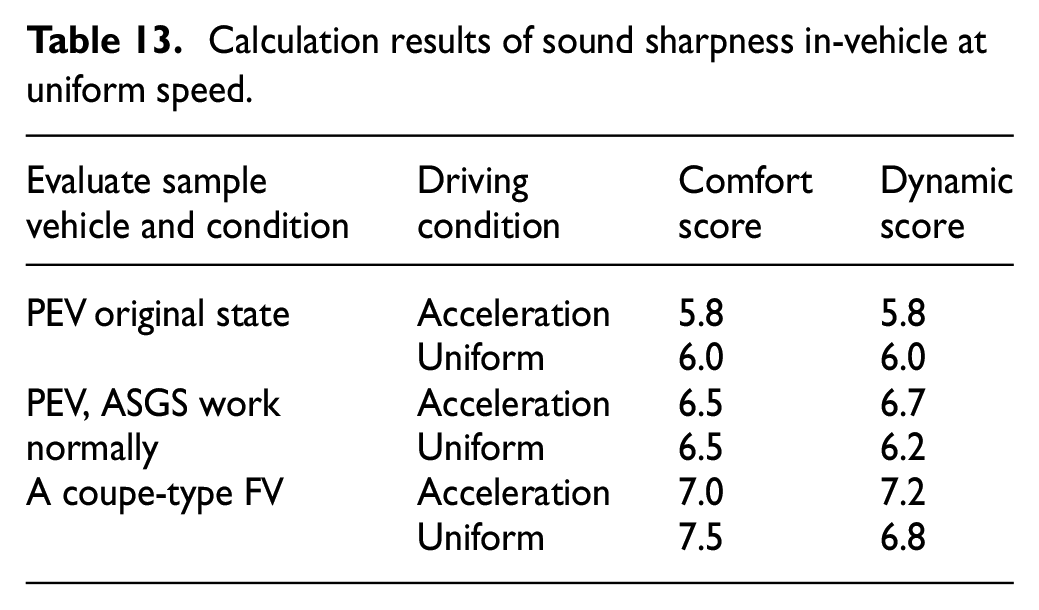
Table 13 lists results of three sample vehicles and Figures 46 and 47 depict the sound quality in each working condition.
Calculation results of sound sharpness in-vehicle at uniform speed.

Sound quality under accelerated driving conditions.

Sound quality under uniform driving conditions.
Comparative analysis of subjective and objective test results is the following:
When accelerating, the voice generated by the ASGS can reduce the proportion of high frequency order components and increase the sound comfort. Moreover, the engine order component is added in the local range to realize the dynamic sense of sound. For a constant speed, the sound amplitude of the system is moderate, and the sharpness has been improved to a certain extent, the combination of which contributes substantially to the improvement of sound comfort and power sense.
As a result, the EV ASGS achieves a goal of the conceptual design of “comfort and power sound quality characteristics” in the vehicle.
Conclusion
(1) The frequency spectrum of sound in EV and FV is compared and analyzed, and the theory of sound synthesis are analyzed. The sound fitting in the vehicle was completed by STFT, which verified that the STFT and synthesis function based on Kaiser window function could fulfill requirements for fitting accuracy, and makes positive contribution to simulation of in-vehicle sound.
(2) The research on the sound control requirements of A-class PEV is completed, and a guideline of sound design is proposed, which takes into account three aspects in a comprehensive way: engine order composition, energy distribution in frequency domain, and sound amplitude enhancement. The design scheme of sound comfort and dynamic is established, and the target of the total amount of vehicle sound is set.
(3) The sound spectrum analysis of the FV in the sate of acceleration is conducted, and two methods of sound extraction are compared. The correlation between sound amplitude and power sense is analyzed, and the parameter setting of EVs sound is clarified.
(4) The working flow chart is designed, and the hardware of ASGS is tested. The construction and accuracy verification of the ASGS based on the loudspeaker of sound system are completed. The verification of the target achievement of the ASGS under the static condition of real vehicle is carried out under the state of acceleration and constant speed.
(5) When the ASGS is working normally, the sharpness under the two conditions of acceleration and uniform speed is reduced to 1.0 and 0.52 acum respectively, which effectively alleviates the discomfort caused by the high-frequency order sound of the original vehicle. Combined with objective and subjective evaluation, it is verified that the research of EV active sound control based on engine order sound fitting can change the comfort and power sense quality of EV in-vehicle sound.
Footnotes
Handling Editor: Chenhui Liang
Declaration of conflicting interests
The author(s) declared no potential conflicts of interest with respect to the research, authorship, and/or publication of this article.
Funding
The author(s) disclosed receipt of the following financial support for the research, authorship, and/or publication of this article: This research was funded by the Major Science and Technology Project of Henan Province (221100240400), Key R&D and Promotion Project of Henan Province (no. 232102240052), Key Scientific Research Project of Colleges and Universities in Henan Province (no. 20A460013), National Key Research and Development Program of China (no. 2022YFD2001203), the National Key Research and Development Program of China (no. 2017YFD070020402).