
Abstract
This paper explores the hazard classification method of blasting vibration on nearby buildings. The ratio of the self-vibration frequency f0 of the protected buildings to the main vibration frequency f of blasting vibration and the ratio of the actual measured peak blasting vibration velocity to the permissible vibration velocity of blasting safety regulations are used as two indicators of the blasting vibration hazard classification method, the blasting vibration hazard index calculation formula was proposed, and the blasting vibration hazard was classified into four levels according to the blasting vibration hazard index. An open pit mine blasting project was used for monitoring, the collected data were processed by random forest method. After processing, bursting heart distance, the total explosive quantity required for one blast, the hole distance meter delay, and the row distance meter delay was selected as the input parameters; the optimal kernel function parameter gamma and c were applied to the SVR (Support Vector Regression) model by changing the search step to expand the parameter search, and improved GS-SVR (Grid Search-Support Vector Regression) model was constructed, through which peak blasting vibration velocity and vibration frequency values were predicted. The results show: improved GS-SVR is effective in predicting peak blasting vibration velocity, with the lowest relative error of 0.15% and the average error of 7.96%; the minimum relative error for the prediction of vibration frequency is 0.03% and the average error is 2.54%. The measured data in the literature of related scholars verified that the blasting vibration hazard classification method is scientific and feasible. It can provide reference and reference for blasting vibration hazard classification and prediction of similar blasting projects.
Keywords
Introduction
With the rapid growth of the national economy and the rapid development of the engineering construction industry, engineering blasting has been widely used in transportation construction, demolition and blasting, water conservancy and hydropower projects, and mining and other projects. Compared with the mechanical rock-breaking method, the drill, and blast method is low-cost, flexible and adaptable, and is the main production means and production process of open pit mine production. However, the hazards arising from blasting operations are difficult to avoid the problem of mining, blasting vibration is a common problem faced by blasting projects. Only a small amount of energy is used to break the rock when the explosive explodes in the rock and other media, and the effective utilization rate is only 10%–15% of the total explosive energy, 1 and most of the energy is released in the form of vibration. When blasting vibration exceeds the safe allowable value, it can cause engineering disasters such as landslides, structural deformation, fracture and even collapse of buildings (structures), structural instability of underground works, and foundation sinking. 2 For example, in 2010, a physical exploration brigade of Sinopec East China Petroleum Bureau was responsible for implementing seismic exploration and blasting operations and collecting exploration data in Liuzhi Special Zone, Guizhou province, but in the process of implementing blasting operations, local villagers reported that blasting vibration caused in the process of blasting, local villagers reported that blasting vibration caused damage to houses and cut off water sources, which led to civil disputes. The impact of blasting vibration on surrounding buildings and water sources is highly valued by the local government. 3 In 2012, a cement plant in Guizhou province, implemented blasting operations, residents around mine have been reflecting that excessive blasting vibrations have caused serious damage to their houses, resulting in disputes. 4 Environmental law and policy in the People’s Republic of China The Mineral Resources Law of the People’s Republic of China stipulates that mining enterprises should protect their surrounding buildings (structures) from mining operations, 5 and to strengthen the development and utilization of mineral resources, guarantee the current and long-term needs of socialist modernization, and safeguard the safe operation and normal production of mines, there is an urgent need to research the prediction and control of blasting vibration hazards.
The impact of blasting vibration depends not only on the size and strength of the vibrating load, but also on the structure and foundation form of the building (structure) itself. However, since the current blasting theory is not perfect and the complex and variable geological conditions and propagation medium are not sufficiently considered, the accuracy of the existing blasting vibration prediction rate needs to be further improved; on the other hand, the structure of buildings (structures) varies, and the self-oscillation frequency of different buildings (structures) varies, so the sensitivity to blasting vibration also varies. Under the same blasting vibration amplitude and frequency, blasting vibration may cause different degrees of damage to the ground buildings (structures).
At present, the blasting safety control criteria commonly used at home and abroad are the “vibration frequency – peak blasting vibration velocity” criteria, such as the German standard (DIN 4150-3:2016-12), the British standard (BS 7385-2), the French standard (87/70558), American standard (USBM), Norwegian Standard (NS8141:2001), blasting vibration control standard adopted by Turkey and the Standardization Administration of the People’s Republic of China. 6 However, in actual engineering blasting, it is not enough to consider only the two influencing factors of main vibration frequency and peak vibration velocity; the degree of building damage caused by blasting vibration is influenced by different primary control factors, and there is a potential nonlinear relationship between the initiating cause and the degree of damage. Therefore, in-depth studies on blasting safety discrimination criteria have been carried out both at home and abroad. Liu et al. 7 considered that the control criteria of blast vibration are the properties of the protected object itself, which are mainly influenced by the requirements of the protected object’s category, structural characteristics, and stability status. Shi et al. 8 proposed that the main indicators affecting blasting safety discrimination are the vibration frequency, frequency duration, and peak mass vibration velocity. Zhou et al. 9 believed that in addition to peak blasting vibration velocity and vibration frequency should also include vibration frequency duration, all of which affect blasting vibration safety criteria. Li et al. 10 studied the response law of buildings to blasting seismic wave energy at different frequencies by a single-degree-of-freedom linear damping system. Considering only the main vibration frequency is not enough to study the degree of blasting vibration impact on buildings, and the magnitude of energy components consistent with the inherent frequency of buildings also affects the degree of blasting vibration impact on buildings. The above study has improved the quantitative analysis method of blast vibration safety impact degree, but the limit value of blast vibration safety criterion has not been calculated quantitatively.
To predict the hazard level of blasting vibration that may be generated by blasting operations, so that effective vibration reduction measures can be taken to cope with it and thus control blasting vibration hazards. Lawal et al. 11 used Gaussian process regression to predict the ground vibration rate caused by blasting, and used the Gray Wolf algorithm to optimize the neural network to achieve the goal of optimizing blasting parameters, thus minimizing the ground vibration caused by blasting operations in quarries.
Shao et al., 12 Peng et al., 13 Ding et al., 14 Hasanipanah et al., 15 and Mohamadnejad et al. 16 used support vector machine for Peak Particle Velocity prediction for their respective research objects, and the results showed that the peak blasting vibration velocity predicted by the support vector machine method is closer to the true value than the peak blasting vibration velocity predicted by the traditional empirical regression approach, but the support vector machine also has the disadvantage that the kernel function is more and it is difficult to determine the optimal kernel function parameters. Based on this, scholars have used other algorithms combined with support vector machines to optimize the kernel function parameters, and the common optimization algorithms include Particle Swarm Optimization (PSO) 17 and Genetic Algorithm (GA). 18
Yue et al. 19 extracted four main factors affecting blast vibration velocity as input variables of the GA-SVM model by Principal Component Analysis (PCA) and established PCA-GA-SVM based blast vibration velocity prediction model for open pit mines, which has the advantage of improving the prediction accuracy of blast vibration velocity. Mei et al. 20 proposed a blast vibration intensity prediction method based on the combined Adaboost–PCA-SVM algorithm for predicting the peak blast vibration acceleration, which is faster than the traditional empirical formula and BP neural network training, and the prediction accuracy can be more than 97%. Keshtegar et al. 21 proposed RSM-SVR (Response Surface Model-Support Vector Regression) model. The combination of RSM and SVR is based on two calibration processes, which provide nonlinear relationships between input factors based on two regression processes of RSM and SVR relationship, forming two regression processes of RSM and SVR between PPV and input factors, thus improving the accuracy of PPV prediction. Ding et al. 22 proposed an improved bagged support vector regression (BSVR) combined with Firefly Algorithm (FA) to predict ground vibration by modifying the weights of the SVR model by FA. Shao et al. 23 established LS-SVM (Least Squares-SVM) prediction model for civil building damage due to blasting vibration in open pit mining using actual measured data as training samples, which provided a new idea for predicting civil building damage due to blasting vibration in open pit mining. Shi et al. 24 established a Bayesian discriminant analysis model for predicting civil house damage due to blasting vibration. Zhou et al. 9 used gradient – boosted machine model (gradient boosted machine referred to as GBM) for blasting vibration prediction, and the prediction accuracy is high, meanwhile, this model can also classify and predict the damage to civil buildings around the open pit mine.
In this study, the ratio of the self-vibration frequency to the main vibration frequency of the protected building and the ratio of the actual measured blast vibration velocity to the permissible blast vibration velocity according to the blast vibration safety standards is selected as the two indicators for grading, and the blast vibration hazard classification study is carried out by combining the safety conditions of the protected building (structure), especially the damage caused by resonance. The precondition for accurate prediction of blast vibration hazard class is the prediction of the two indexes of classification. The parameters of support vector machine are optimized by using improved grid search algorithm, and the optimal combination of kernel function parameters and penalty parameters is applied to the support vector regression model by changing the search step, and the model is used to predict the peak velocity and main frequency of blast vibration, and then the blast vibration hazard class is predicted.
Blasting vibration hazard classification method
Blasting vibration hazard index calculation formula
Blasting vibration frequency has a very important influence on the safety of the building (structure), especially when the vibration frequency is close to the self-vibration frequency of the affected building (structure), it will intensify the damaging effect of blasting vibration on the building (structure). Therefore, when evaluating the danger caused by blasting vibration to the protected building (structure), it is necessary to consider not only peak blasting vibration velocity, but also the self-vibration frequency f0 of the building (structure) and the blasting vibration frequency f, to evaluate the danger more accurately. The current Blasting Safety Regulations (GB 6722-2014) stipulate that different safety criteria should be used to evaluate the vibration effects of blasting on different types of buildings (structures), and the range of PPV for civil buildings in general is 1.5–3.0 cm/s. To further study the vibration hazard, the lower limit of vibration velocity corresponding to the main vibration frequency of blasting in the Blasting Safety Regulations is used as the basic criterion, and the ratio of the self-vibration frequency f0 of the protected building to the blasting vibration frequency f is used as a correction index for a quantitative study, to improve the reliability of the evaluation results. This study proposes a blasting vibration hazard level calculation method that integrates quantitative and qualitative indicators, and the calculation formula for the degree of impact of blasting vibration on buildings (structures) is as follows.

where:
D – blasting vibration hazard index.
e – Euler number; e(|1−β|) as a correction factor, mainly using the advantage of the adjustable decay rate of the exponential function, in order to study its vibration amplification coefficient and accurately evaluate its vibration hazard.
V – the peak blasting vibration velocity measured in the actual project, cm/s.
[V] – the minimum value of peak blasting vibration velocity corresponding to the vibration frequency of blasting in the blasting safety regulations, cm/s.
β– the correlation coefficient of blasting vibration to the surrounding buildings (structures), the value of β is related to the ratio of f0 to f, and its mathematical expression are as follows.

where:
f0– the self-vibration frequency of the protected building (structure), Hz.
f – main frequency of blast vibration, Hz.
Assessment of different types of buildings should be used to assess the safety criteria and allowable standards, T0 is the building (structure) itself self-oscillation period, which can be used to calculate the general civil building’s self-oscillation period, 25 the results of the error is not a big difference, the general use of horizontal self-oscillation period, according to the formula f0 = 1/T0, then the calculated f0-value is brought into equation (2).


where:
N – number of floors.
K – foundation coefficient, taking small values for hard foundations and 0.7 for rocky foundations. 26
The self-vibration frequency of common buildings, as shown in Table 1. 27
Common building structure self-oscillation frequency.

Qualitative description of blasting vibration hazard levels
In order to quantify blast vibration hazards.
(1) the formula f and f0 is close, the ratio is close to 1, and the building will appear resonance phenomenon, at this time, the closer the value of β is to 0, the law of change of 1−β is the opposite of β, take the extreme case, that is, when f and f0 are equal, the value of 1−β is 1, the correction coefficient e(|1−β|) takes the maximum value of about 2.71828. In the actual engineering blasting, the value of V is not too large, so the value of V/[V] is small, the correction coefficient can be magnified for the value of V/[V], indicating that blasting vibration the closer the vibration frequency is to the inherent frequency of the building, the larger the value of the blast vibration hazard index D is taken, and the blast vibration may bring a greater hazard. It also quantitatively explains that the low vibration speed (not exceeding the national allowable standard) vibration makes the building damaged.
(2) When f is much larger than f0 in the formula, the ratio is close to be 0. At this time, the value of β is close to 1, and the value of 1−β tends to 0. The correction coefficient e(|1−β|) takes the value of about 1. According to the Chinese Ministry of Railways about the damage to buildings by blasting vibration, at V = 12, the house wall ash cracks and falls off; at V = 20, small cracks appear on the surface and the general building is damaged; at V = 50, the building is seriously damaged. 28 It shows that the value of blasting vibration hazard index D is mainly influenced by the peak blasting velocity.
(3) When f in the formula is much smaller than f0 at this time for the building, the loading of blast vibration is equivalent to the static load effect, and the building amplitude can be calculated approximately by the amplitude of blast vibration as static load. 29
According to the literature and site survey results, the comprehensive assessment of blasting vibration hazard can be divided into the following four grades, safe (I), relatively safe (II), small dangerous (III), and dangerous (IV), and the grading details are shown in Table 2. 30 Eight sets of actual field measurements from the literature 23 were selected as test samples for the engineering application of the blasting vibration hazard grading method established in this study, as shown in Table 3, with a view to verifying the feasibility and reliability of the hazard grading formula.
Blasting vibration hazard classification table.

According to the formula (3), the self-oscillation frequency of the buildings of residential and industrial facilities around the mine in this study is taken as 6 Hz.
Test sample and prediction results.

In Table 3, the real situation of samples 1, 2, and 3 are that the houses (masonry structures) show irrecoverable open cracks and cracks in walls and roofs, which are consistent with the qualitative description of dangerous (IV) in the blast vibration hazard grading method (Table 2) mentioned in this study; the real situation of samples 4–7 is that the houses only produce elastic deformation without any cracks, which is consistent with the safe (I) in the grade of Table 2 Qualitative description is consistent; the real situation of sample No. 8 is that non-opening type fine cracks appear in the local stresses of doors, windows, and corners, and there are no cracks in walls and roofs, which is consistent with the qualitative description of relatively safe (II) in the blast vibration hazard class in Table 2. Thus, it can be concluded that the blasting vibration hazard grading method mentioned in this study has applicability and reliability.
The blasting vibration hazard level calculation method proposed in this research incorporates quantitative and qualitative indicators, and field engineering applications and tests are carried out based on the above results. The self-oscillation frequency of the buildings of residential and industrial facilities around the mine in this study is taken as 6 Hz.
Applications and validation
Project overview
Some open pit mine is located in a suburban location where both society and government authorities have high expectations for mine safety. The surrounding environment of the mine is very complex, with important protection objects such as city buildings and industrial facilities, which are particularly sensitive to blasting vibrations.
The current production scale of the mine is 3 million tons/year, using finished powder and cartridge-emulsified explosives with a unit consumption of about 0.20 kg/t. The blasting operation was designed to use 115 mm gun holes with a depth of 8–15 m and a filling height of 4–4.5 m, and mainly uses electronic detonators to detonate hole by hole with an inter-hole delay of 12–20 ms.
Blasting vibration data acquisition
The iSensor series blast vibration meter manufactured by Sichuan Topper Measurement & Control Technology Co. including the monitoring values of intensity factor (density factor = hole spacing/row spacing) recorded as X1, bursting heart distance recorded as X2, drilling depth recorded as X3, chassis resistance line recorded as X4, explosive quantity for a single blast recorded as X5, hole distance meter delay recorded as X6, row distance meter delay recorded as X7, and single hole explosive quantity recorded as X8.
From October to November 2021, nine blasts were carried out in the production quarry, and the blasting areas were +43 m dolomite area, east and west dolomite area crushing plant +43 m limestone area, main body (103) dolomite area, etc. A total of 36 sets of data were measured in December 2020, and the blasting vibration speed and main frequency field monitoring results are shown in Table 4.
Partial peak blasting vibration velocity-vibration frequency monitoring data.

The calculation of the peak blasting vibration velocity is based on the formula V =
Blast vibration monitoring data pre-processing
The random forest method was used to filter the characteristics of the eight indicators of the original data. Figure 1 shows the degree of influence of different attributes on the peak blasting vibration velocity and vibration frequency, and the values of the bars represent the importance of the characteristic attributes, and the importance score of the blast core distance is 13.10, which has the greatest influence. This is followed by the hole spacing meter delay, row spacing meter delay, and the total amount of single blast, while the amount of single-hole explosives, density factor, chassis resistance line has less impact. Therefore, the blast center distance, single blast total charge, hole spacing meter delay, and row spacing meter delay were selected as the input parameters of the model, and the peak blasting vibration velocity and vibration frequency were used as the output parameters to evaluate the blasting vibration effect.
Blasting vibration property importance ranking result.
For the 72 sets of data collected on-site from 2020 to 2021, pre-processing was performed, and the random forest was used to filter the characteristics of the original data attributes, and after eliminating the outliers, 53 sets of valid data were obtained, and the data collected by the blast vibration tester are shown in Table 5.
Blasting vibration sample data.

Peak blasting vibration velocity-vibration frequency prediction
The performance of SVR depends on the penalty factor c and the value of the kernel function parameter gamma, 31 compared to other optimization algorithms such as GA (Genetic Algorithm), K-CV (K cross-validation method), PSO (Particle Swarm Optimization), etc., the advantage of grid search method algorithm is that its convergence speed is fast, simple idea can be calculated in parallel, the optimal parameters of the support vector machine is exhaustively searched and the parameter optimization takes less time. 32
In this study, a combination of improved SVR and GS was used to build a model of an improved grid search algorithm to optimize the support vector machine 33 for peak blasting vibration velocity-vibration frequency prediction. Fifty-three sets of data monitored in an open pit mine site blast were selected for modeling and prediction, and the selected chassis resistance line, total amount of explosives required for one blast, hole distance meter delay and row distance meter delay. Four indicators were selected as input parameters, and then the support vector regression parameters were optimized by using a grid search algorithm with varying search steps, and finally the model was built to predict the vibration speed and main frequency.
In this study, an improved grid search algorithm is used to achieve the optimization of SVR parameters, and the specific steps are shown in Figure 2. The improved GS optimized SVR hyperparameter algorithm is shown in Table 6.
Improved GS-SVR process diagram.
Based on improved GS-SVR hyperparameter optimization algorithm.

The optimal parameter combination selection method is the grid search method (import GridSearchCV from model selection in SKlearn library), and set the RBF kernel parameter gamma and penalty parameter c to [2−10, 210], set 0.5 as the initial search step of both, and process them in 10-fold expansion, 5-fold reduction, and a 2-fold reduction in turn, with the trifold cross-validation method, and the search results are shown in Figures 3 and 4.

Optimal SVR parameters found by grid search in peak blasting vibration velocity.
Optimal SVR parameters found by grid search in vibration frequency.
The optimal parameter combination of the support vector machine was found by grid search, and RBF (Gaussian radial basis kernel function) was the optimal kernel function. From Figure 3, the optimal combination of parameters in the improved GS-SVR peak blasting vibration velocity prediction model: gamma = 0.1759, c = 8. Regression prediction of test data was performed based on the calculated optimal parameters c and gamma, while the SVR, PSO- SVR, GA-SVR, Tabnet, and improved GS-SVR five prediction models.
From Table 7, it can be obtained that the established improved grid search optimized support vector machine regression model predicts blast vibration velocity well, and the evaluation results are in good agreement with the actual results, with a minimum relative error of 0.15% and an average error of 7.96%, which is much lower than that of PSO-SVR, and the average error of prediction of GA- SVR model is 21.89% and 20.21%, which is since GA-SVR and PSO-SVR models fall into local extreme optimality. The support vector machine model has the least training time, but at the same time there is a great bias. Tabnet is a model proposed by Google Cloud AI in 2020, which considers both tree models and neural networks, but this model does not apply to the prediction of small samples of peak blasting vibration velocity. In comparison, the training efficiency and relative error of the improved GS-SVR peak blasting vibration velocity prediction models are better than other models, and the nonlinear mapping relationship (peak blasting vibration velocity influencing factors) can be handled effectively. This method is ideal in terms of generalization capability and applicability.
Comparison of the prediction effect of each model for peak blasting vibration velocity.

The prediction results of the five peak blasting vibration velocity and the real values are shown in Figure 5, and the relative errors are shown in Figure 6. From the analysis of the prediction effect, the improved GS-SVR model is closer to the real value and better than the other four models; from the relative error, it can be obtained that the improved grid search algorithm model keeps the lowest level.

Comparison of predicted and true value of different prediction models.
Relative error of predicted value of different prediction models.
Based on the improved GS-SVR model for vibration frequency prediction, the test set and training set were divided according to 4:1 based on the data in Table 5, and the support vector machine parameters were optimized according to the improved GS, with RBF as the optimal kernel function and the optimal combination of parameters: gamma = 0.0078125, c = 1.2311. The results of the support vector machine parameter search are shown in Figure 4. Modeling on this premise, regression prediction is performed for blast main vibration frequency test data.
Based on the vibration frequency data, five prediction models were simultaneously developed to improved GS-SVR, SVR, PSO-SVR, GA-SVR, and Tabnet.
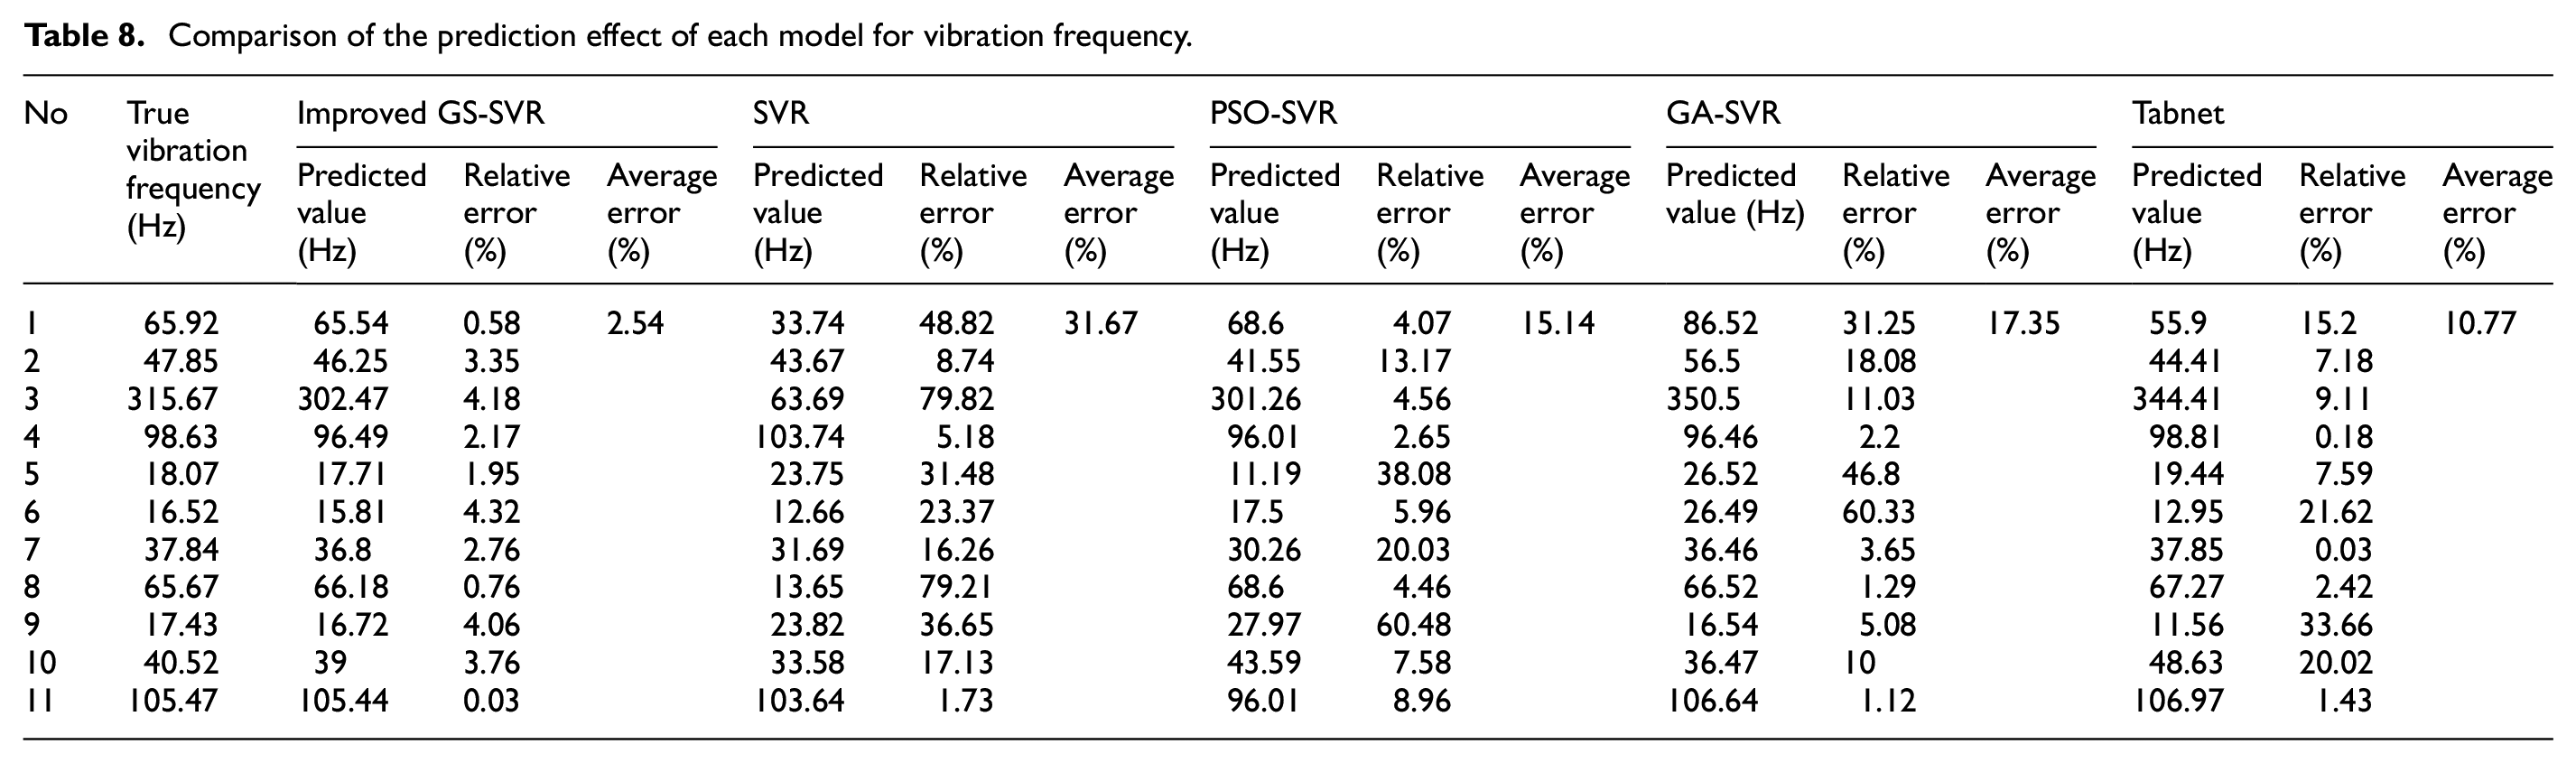
The training effects of multiple models in blast main vibration frequency prediction are shown in Table 8. The smallest relative error of the improved GS-SVR model is 0.03%, and the average error is 2.54%. The prediction effect of the improved GS-SVR model is better, which can improve the prediction performance of the SVR modeling method and is more suitable for blasting prediction in open pit mine blasting projects. The prediction results of blasting main vibration frequency and its relative error are shown in Figures 7 and 8, respectively.
Comparison of the prediction effect of each model for vibration frequency.
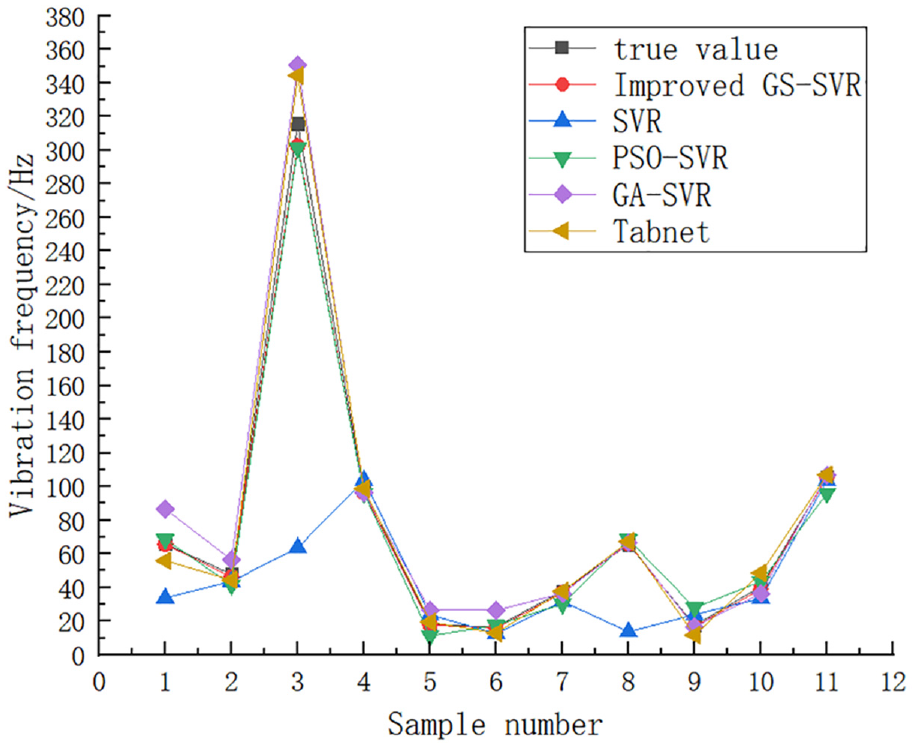
Comparison between the predicted value and the true value of different prediction models.
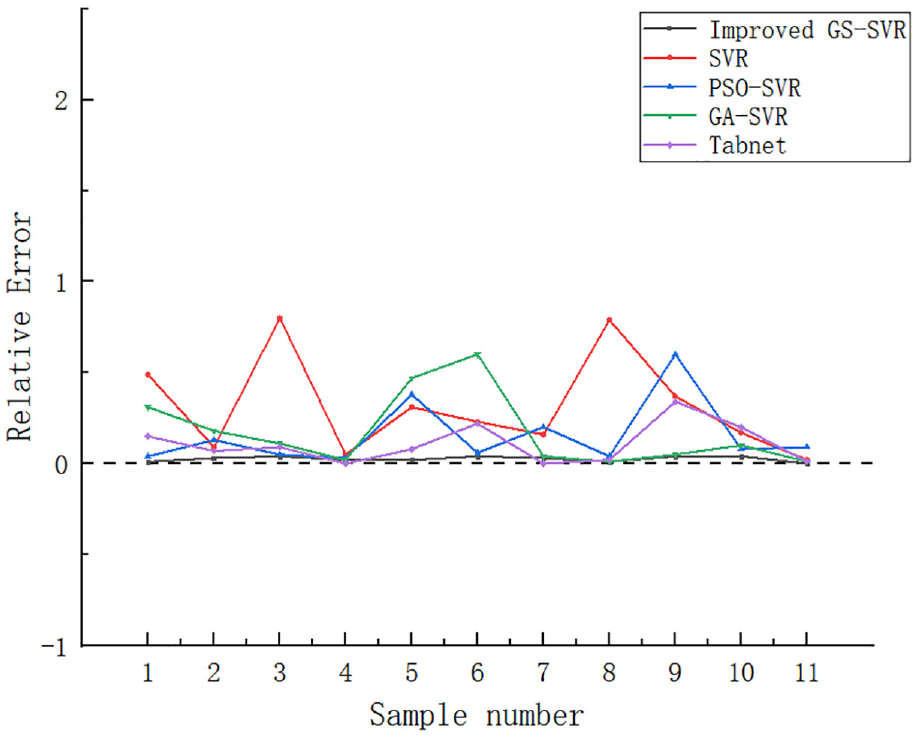
Relative error of predicted value of different prediction models.
Engineering verification
This study blast vibration-monitoring protection object for the office building, residential areas, control center three protection objects, and the relative direction of the quarry are almost the same, the three protection objects to the quarry of the same geological conditions, so the three protection objects and the relative direction of the quarry as a direction to set up monitoring points (hereinafter referred to as the common measurement line direction). Burst source as the starting point, toward the direction of the common measurement line, laid five monitoring points, five monitoring points of the burst center distance were 111, 162, 222, 261, and 313 m. monitoring points schematic diagram is shown in Figure 9.

Blasting vibration co-location monitoring points layout diagram.
Blasting vibration hazard level verification was performed for monitoring points 1#, 2#, 3#, 4#, and 5# in Figure 5, and the test results are shown in Table 9.
Test sample and prediction results.
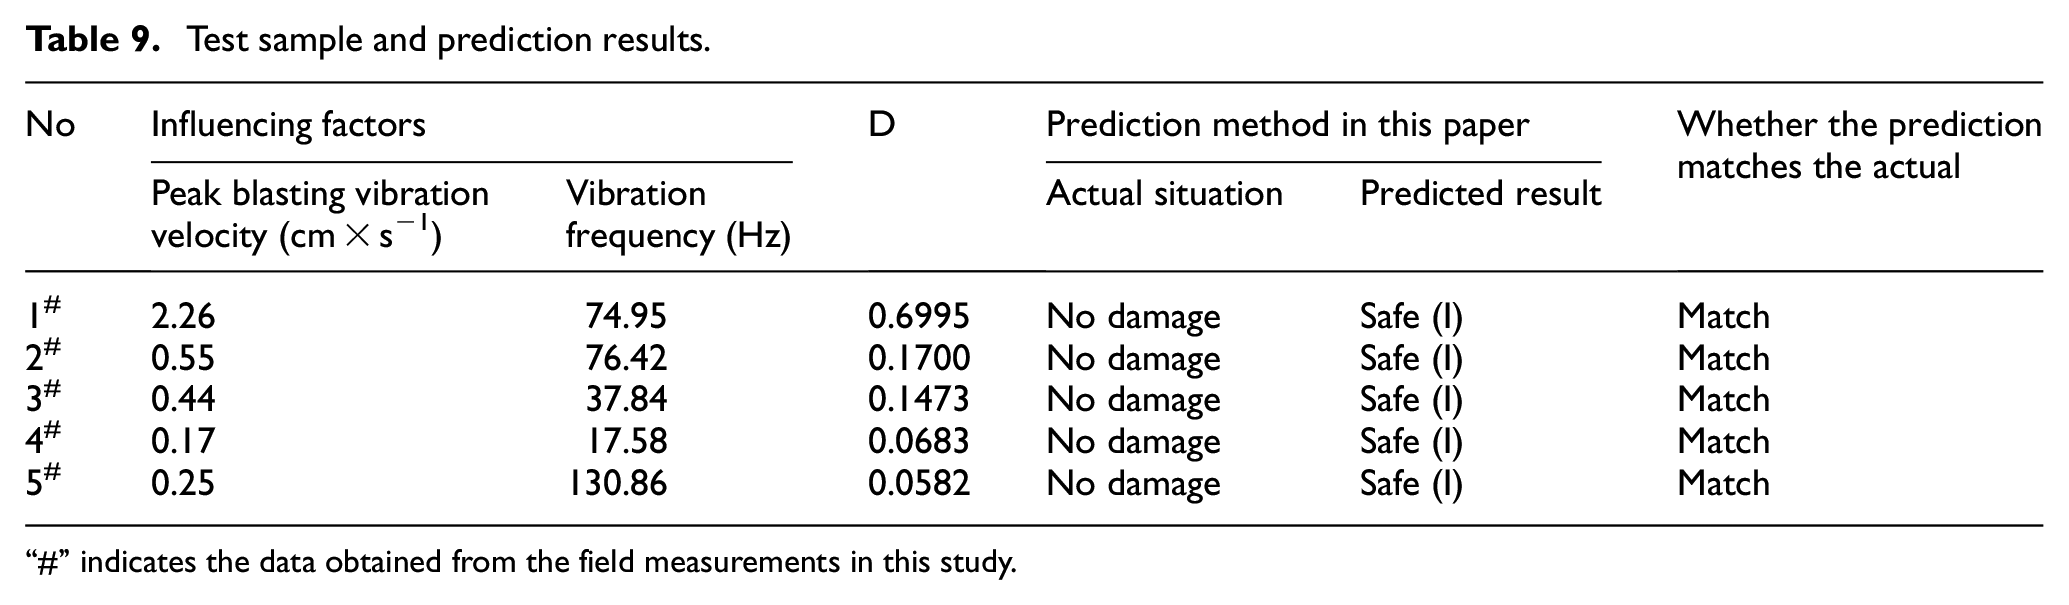
“#” indicates the data obtained from the field measurements in this study.
Conclusion
Combining with the actual situation of blasting in an open pit mine project in Hubei province, based on the study of relevant domestic and foreign literature and blasting engineering examples, the calculation formula and definition of the blasting vibration hazard grading method were proposed, and the research on the prediction of peak blasting vibration velocity and vibration frequency was carried out based on the improved GS optimized SVR algorithm, followed by the prediction of blasting vibration hazard grade based on accurate prediction of blasting vibration intensity. Based on the above research analysis and exploration, the following conclusions were mainly achieved:
(1) The blasting vibration hazard grading model is proposed, and the ratio of the self-vibration frequency of the protected object to the blasting vibration frequency and the ratio of the actual measured blasting vibration velocity to the permissible vibration velocity of the blasting safety regulations are taken as two indicators for grading, which improves the reliability of the evaluation index selection, based on which the calculation formula of blasting vibration hazard index is proposed, and the blasting vibration hazard grades are divided into safe, safer, more dangerous and based on this, the formula of blasting vibration hazard index is proposed, and the four levels of blasting vibration hazard are classified as safe, relatively safe, small dangerous, and dangerous, and the four levels are described qualitatively, which are verified by the field measurement data and the real situation of the measured houses, showing that the method has high feasibility and reliability.
(2) A prediction model based on the improved GS-SVR was established to predict the peak blasting vibration velocity and vibration frequency. The combination of the optimal kernel function parameter gamma and the optimal penalty parameter c is applied to the SVR model. The minimum relative error in the prediction of peak blasting vibration velocity is 0.15%, and the average error is 7.96%; the minimum relative error for the prediction of blast main vibration frequency is 0.03%, and the average error is 2.54%.
(3) By substituting the predicted values into the formula of the blasting vibration hazard index, the blasting vibration hazard class is predicted. This study provides the calculation formula and qualitative description for blast vibration hazard classification, and provides a new method for blast vibration hazard grade prediction for reference of related studies.
Footnotes
Handling Editor: Chenhui Liang
Declaration of conflicting interests
The author(s) declared no potential conflicts of interest with respect to the research, authorship, and/or publication of this article.
Funding
The author(s) disclosed receipt of the following financial support for the research, authorship, and/or publication of this article: This work was supported by the National Natural Science Foundation of China (U1802243).