
Abstract
Renewable energy sources include solar, wind, hydro, geothermal and biomass. Furthermore, ocean energy is being rapidly harnessed worldwide. In this study, to establish a suitable design method for various bidirectional ducted tidal turbines, instead of using blade element momentum theory and CFD, which have been used previously, the method used for turbomachinery was used for designing the turbines. A bidirectional turbine optimises the equipment design and reduces manufacturing and maintenance costs. Using the turbine power as the design condition, the difference in the tangential velocity between the front and rear of the turbine was calculated using Euler’s equation, and the blade stagger angle was determined based on the potential flow theory. To incorporate the effect of duct geometry into this design method in the future, the effect on the internal flow of the duct was experimentally investigated using three ducts with different maximum cross-sectional areas. Performance tests showed that the duct geometry had a negligible effect on the flow rate through the turbine. Therefore, the larger the maximum diameter of the duct, the greater the flow rate into the outside of the duct. The pressure difference between front and rear of the turbine and the inflow energy into the duct were different due to the energy conversion as the flow turned outside of the duct. To improve the accuracy of the design method, the effect of flow at the duct inlet and the energy conversion should be incorporated, and a review of the estimation method for the axial velocity ratio and the selection method for the design representative value should be conducted.
Introduction
Since the 21st session of the Conference of the Parties (COP21), the urgent need to switch to renewable energy sources to achieve a decarbonised society has been acknowledged. Renewable energy sources include solar, wind, hydro, geothermal and biomass energies. In addition, ocean energy is being harnessed worldwide. Ocean energy includes offshore wind, ocean thermal, wave, salinity difference, ocean current and tidal power generation. Tidal power generation uses the regularly fluctuating seawater flow caused by tides. Tidal power generation is advantageous in that it is predictable over the long term, 1 and unlike wind and solar power generation, it is not affected by weather conditions. 2 Various turbine types have been studied, mainly in the United Kingdom.
Vertical-axis turbines, such as Savonius and Darius, always rotate in one direction without additional equipment, even if the direction of the tidal current changes. However, the torque fluctuation during the blade rotation is large, and it is not possible to produce positive torque on all blades simultaneously. Therefore, an investigation was conducted to improve the torque characteristics by active pitch control of the Darius turbines. 3 Because the Darius turbine has low self-starting performance, experiments have been conducted to improve the starting torque characteristics by combining it with a Savonius turbine. 4
Horizontal-shaft turbine types include multibladed and propeller types, which produce smaller torque fluctuations than vertical-shaft turbine types. Several studies have been conducted on horizontal-shaft-type turbines with the aim of increasing the power output, including a study of two turbines in parallel 5 and a study of counter-rotating turbines in series. 6 However, horizontal-shaft types, particularly propeller types, support only one-directional flow; therefore, countermeasures are required to generate power with bidirectional flow. Floating turbines can be self-directed by tidal currents, 6 even though the installation area of a single turbine is larger. In the bottom-mounted type, the installation area is small; however, the entire turbine must be rotated to follow the direction of the tidal current, or countermeasures such as a variable pitch will be required. 7 However, the undersea environment is considerably harsher than that at sea or on land, and marine organism adhesion and corrosion are major problems; therefore, fewer moving parts are desirable. To lower the cost of design, manufacturing and maintenance, other countermeasures are required, such as using a blade shape that is compatible with bidirectional flow. In addition to these rotating machines, oscillating blades and kite types have also been studied.8,9
Among the various types, many studies, developments and demonstrations of horizontal-shaft propeller-type single turbines have been conducted.10–14 For single turbines, methods based on simplified blade elementary momentum theory, which is widely used for wind turbines, are often applied.15–17 Studies on diffusers and ducts18–20 have been conducted. The ducted type is expected to improve performance during turbine start-up and tidal velocity fluctuations. 18 For the ducted types, a combination of the Blade Element Momentum (BEM) theory and computational fluid dynamics (CFD) can be used to accurately determine the induction velocity in the duct. However, when combined with CFD, the BEM theory becomes more complex, significantly increasing the design time. In addition, most studies of ducted turbines dealt only with one-sided flow21,22 or simulated the turbine section with an actuator disk,23,24 and no design method was proposed for a bidirectional turbine. Therefore, a simple design method for bidirectional ducted turbines that can be applied to various duct shapes is required. To establish this design method, it is necessary to develop a theory that can handle both internal and external flows to estimate the energy entering the duct and the flow in the duct.
In this study, a design method based on Euler’s equation and potential theory used for internal flow in turbomachinery was examined to establish a suitable design method for bidirectional ducted tidal turbines. As the first step of the design method establishment, an axial velocity ratio (AVR) between the main flow and turbine inflow was assumed, and a one-dimensional design was performed. A bidirectional turbine was designed to reduce the design, manufacturing and maintenance costs of the equipment. The blades are flat plate blades, and the turbine responds to changes in the direction of the tidal current by counter-rotating. With the turbine power as the design condition, the tangential velocity difference between the front and rear of the turbine was calculated using Euler’s equation, which is used for internal flow in turbomachinery, and the blade stagger angle was determined using the potential flow theory. Estimating the AVR is the most important part of the design process. However, there is currently no method for calculating a suitable AVR for various duct geometries. Therefore, to clarify the effect of duct geometry on the flow into the duct, experiments were conducted in combination with three patterns of bidirectional ducts. The experimental results were compared with the design specifications to examine consistency and enable improvements in the design method.
Turbine design
Theory
In this design, the turbine blade of a bidirectional ducted tidal turbine consisting of turbine blades, a hub and a duct was designed. To accommodate bidirectional flow, the blades were flat in cylindrical coordinates. First, the tip speed ratio (TSR), AVR, the tidal velocity vm, turbine speed ω, power P, turbine radius Rt, hub ratio Rh/Rt, turbine axial length la, tip clearance τ and number of blades NB were determined. Next, losses of friction, collisions and other losses and temperature variations were assumed to be negligible. Applying the determined values and the assumptions, the turbine geometry can be determined by obtaining the stagger angle γ from Euler’s equation and the potential theory.
Using P, Rt, ω, the flow rate Q through the turbine, density ρ and Euler’s equation, the tangential velocity difference Δvt (= vt2−vt1) between the front and rear of the turbine was calculated using the following equation:

Where the inlet and outlet tangential velocities were assumed to be vt1 = 0 and vt2 = Δvt, respectively. Figure 1 shows a flat blade on a cylindrical surface and velocity triangles. In this design method, Δvt was used as a representative value for the entire turbine, and a one-dimensional design was performed. Therefore, the inlet relative tangential velocity, wt1, and outlet relative tangential velocity, wt2, were wt1 = −rω and wt2 = −rω + Δvt, respectively. The average relative velocity wave (=(wa 2 + wt,ave 2 )0.5) was obtained from the average relative tangential velocity wt,ave (= 0.5 (wt1 + wt2)) at the inlet and outlet at each radius and the axial relative velocity wa (= va).

Flat blade on cylindrical surface and velocity triangle.
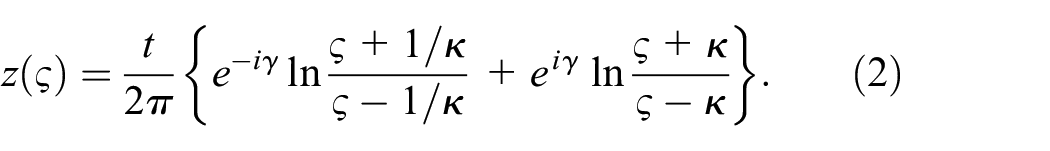
The flow of a cascade of infinitely thin planar blades in the z-plane can be converted to a flow around a circle in the ζ-plane by the following equation using the blade chord length l (= la/cosγ) and pitch t (= 2πr/NB) from the two-dimensional potential theory 25 :
Where κ is the distance between the singular point and origin in the unit circle in the ζ-plane, and κ is obtained as follows:

The complex potential W(ζ) on the ζ-plane is expressed as follows:

Using αave as the angle of attack of the wave, the circulation Γ around the blade can be expressed using the following equation:

From the complex potential in equation (4), the conjugate complex velocity


The stagger angle γ was calculated iteratively, at which wx1, wy1, wx2 and wy2 obtained from wa, wt1 and wt2 coincide with the respective values obtained from equations (6) and (7). The directional change of the tidal flow is handled by counter-rotating the turbine.
This design method represents the flow out of the duct by incorporating AVR into the method used for the internal flow of turbomachinery. However, at this stage, the factor representing the external flow is only the AVR, and the AVR is an empirically determined value. The effects of duct geometry on AVR and inflow energy into the ducts were investigated in this study and will be incorporated into the design method in the future. The design method will be improved by more accurate evaluation of the inflow energy into the ducts. Kan et al. 26 indicated that tip leakage flow and tip leakage vortices have a significant effect on the blade surface pressure. However, this design method does not take into account the effects of tip clearance, tip leakage flow and tip vortices. The tip loss should also be incorporated into the design method in the future.
Design parameters and designed turbine
The design parameters are shown in Table 1. As shown in Table 1, a tidal velocity of 3 m/s (maximum speed at the tidal demonstration field in Nagasaki, Japan), TSR of 2.6, AVR of 0.7, power of 1.6 MW and diameter of 10 m were assumed for the actual scale. At the model scale, the TSR and AVR were set to be the same as the actual scale, and the tidal velocity vm, turbine speed ω, power P, turbine radius Rt, hub ratio Rh/Rt, turbine axial length la, tip clearance τ and number of blades NB were determined. Six points were taken up to the tip, with the first point on the hub surface, and γ was obtained at each point. The designed turbine is illustrated in Figure 2.
Turbine design parameters.


Designed turbine.
Experimental equipment and methods
The water tunnel used in the experiment is a closed loop with a partially open channel as shown in Figure 3. The water from the two circulating pumps flows through the rectifying plate into the test section. A schematic of the test section is shown in Figure 4. The test section is a rectangular cross-section with a depth of HT = 0.7 m and a width of WT = 1 m. The air-water interface in the test section is accelerated by the accelerator to the same level as the mainstream velocity. The turbine is placed at the centre of the test section. A Pitot tube is placed 1 m upstream from the centre of the test section to measure the mainstream velocity by using a differential pressure gauge (Kyowa Electronic Instruments PD-100GA, Rated capacity: 10 kPa, Accuracy: 0.36%). The shaft of the turbine is connected to a servomotor (KEYENCE SV-M040CK, Rated rotational speed: 3000 min−1, Accuracy: 0.01%) installed downstream and forced to rotate at a set speed. The torque is measured using a torque metre (UNIPULSE UTMII-2Nm, Range: 2 Nm, Accuracy: 0.042%) at the bottom of the servomotor. The thrust forces on the duct and turbine are measured using a load cell (NISSHO-ELECTRIC-WORKS LMC-3504-200N, Rated power: 0.5 mV/V, Accuracy: 0.28%).

Circulating water tank.
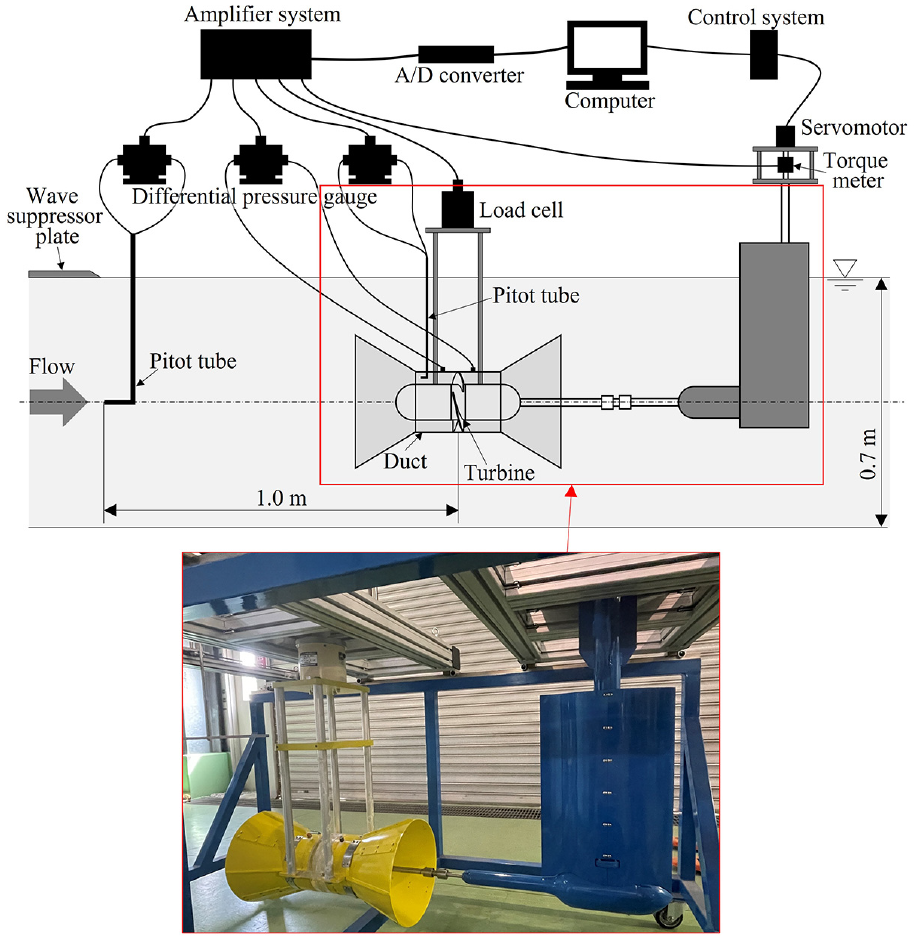
Experimental equipment.
As shown in Figure 5, the turbine is installed with ducts designed for bidirectional flow, and three duct shapes are used. The first (DuctA, Figure 5(a)) is a cylindrical duct with an inner radius Rd = 85 mm (= Rt, the maximum area ratio ADuctA/At = 1.0) and a total length of 240 mm. The second (DuctB, Figure 5(b)) is a duct with a convergent and divergent section with an opening angle of 22° and a maximum radius of 1.8 Rt (ADuctB/At = 3.2) upstream and downstream of DuctA. The last (DuctC, Figure 5(c)) is a convergent and divergent duct with an opening angle of 31° and a maximum radius of 2.2 Rt (ADuctC/At = 4.8). A Pitot tube is placed between the hub and inner wall of the duct, 110 mm upstream from the centre section of the duct, and a differential pressure gauge (VALIDYNE DP15-22-N-1-S-4-A, Range: 1.4 kPa, Accuracy: 0.25%) to measure the axial velocity va of flow into the turbine. The static pressure difference between the front and rear of the turbine Δp is measured at the pressure holes in the front and rear duct walls of the turbine by a differential pressure gauge (VALIDYNE DP15-22-N-1-S-4-A, Range: 1.4 kPa, Accuracy: 0.25%). The measurement instruments were connected to a computer for data recording via an amplifier system and an A/D converter or a control system.

Outline of ducts: (a) DuctA, (b) DuctB and (c) DuctC.
The main flow velocity vm was set at 0.8 m/s and the turbine rotation speed ω was stepwise changed from 50 to 300 min−1 to measure vm, va, the turbine torque Tq, and Δp. The sampling frequency was 256 Hz, and the sampling time was 64 s. Time-averaged values were obtained from the obtained data. The uncertainties were calculated by the method of Coleman and Steele 27 with a 95% confidence level: 5.3% for the differential pressure for vm, 1.5% for the differential pressure for va, 1.1% for Δp, 6.5% for Tq and 11.3% for FT. The uncertainties for each dimensionless value are 2.8% for TSR, 2.8% for AVR, 5.5% for CDP, 8.5% for CQD, 8.1% for CPD and 12.3% for CT.
Results and discussion
In Figure 6, black, red and blue indicate DuctA, DuctB and DuctC, respectively. The DuctA result does not attain AVR of 0.7, which is the design value at TSR = 2.6. For the other two ducts, AVR of 0.7 is reached at approximately TSR = 3.2. All the plots generally overlap on a single line, indicating that the maximum area ratio of the duct hardly affect va. From these results, it can be observed that the blockage ratio in the duct has a greater effect on the internal axial velocity than the maximum duct area ratio. The blockage ratio in the duct is an important parameter in the design of ducted turbines. Therefore, the blockage ratio for the test section of the water tunnel and the length of the duct must be investigated in the future.

AVR against TSR.
Figure 7 shows the static pressure difference Δp between the front and rear of the turbine. The horizontal axis represents TSR, and the vertical axis represents CDP. The DuctA results show a gradual decrease from CDP = 1 to approximately 0.8 as TSR increases. DuctB and DuctC also demonstrate a downward trend to the right relative to TSR. This is attributed to the observation that as the turbine rotational speed increases, the upstream pressure decreases, and the downstream pressure increases as the fluid passes through the turbine more easily. The CDP of DuctC with the largest maximum area ratio was the largest, and the maximum CDP increased approximately linearly with the maximum duct area ratio. In other words, there is no significant difference in Q with respect to TSR depending on the duct geometry, but the inflow energy is different. The comparable flow rates in the ducts imply that the flow rate flowing out of the ducts is larger as the maximum diameter of the ducts is larger. As the flow turns around the outside of the duct, the kinetic energy is converted to the pressure energy, and the inflow energy is considered to become larger. It is important to incorporate the effect of duct geometry on the inflow energy into the design method in order to improve the accuracy of the design method in the future. However, because no significant change in the air–water interface shape was observed in this experiment, the effect of the test section blockage on CDP was considered to be small. However, numerical simulations in a larger space are required to clarify the cause of the difference in CDP of the ducts.

C DP against TSR.
Figure 8 shows the torque coefficient CQd. Figure 9 shows the CQt result obtained by multiplying CQd with the ratio of the maximum duct cross-sectional area to the turbine cross-sectional area (Rd 2 /Rt 2 ). The design values at TSR = 2.6 were DuctA: CQd,design = 0.58, DuctB: CQd,design = 0.18, DuctC: CQd,design = 0.12 and all ducts: CQt,design = 0.58. Duct A, Duct B and DuctA were approximately 7%, 20% and 25% of the design value, respectively. This is because AVR is smaller than the design value, as shown in Figure 6, that is, Q passing through the turbine is smaller. DuctA was the largest in the TSR < 2.6 range, followed by DuctB and DuctC. The results show that for TSR < 2.6, the larger the duct maximum area ratio, the smaller the torque based on the maximum duct cross-sectional area. Furthermore, the slope of each CQd was the steepest for DuctA and the most gradual for DuctC, and the CQd for DuctC was the largest at TSR > 3.0. This result indicates that the tangential velocity difference Δvt varies depending on the duct geometry. In the future, a detailed investigation using numerical analysis should be conducted and the duct’s factors affecting Δvt should be incorporated into the design method. Furthermore, it can be seen that a larger duct maximum area ratio produces a larger torque in the range where the tidal velocity is small (i.e. TSR is large). Because the velocity of seawater flow fluctuates with tides, a duct with a large maximum area ratio, such as DuctC, is effective at reduced velocity. In Figure 9, CQt is larger for DuctC, DuctB and DuctA, in that order. Although the CQd of DuctC is generally small, the CQt at turbine startup is high, indicating that DuctC is effective in the small TSR range.

C Qd against TSR.

C Qt against TSR.
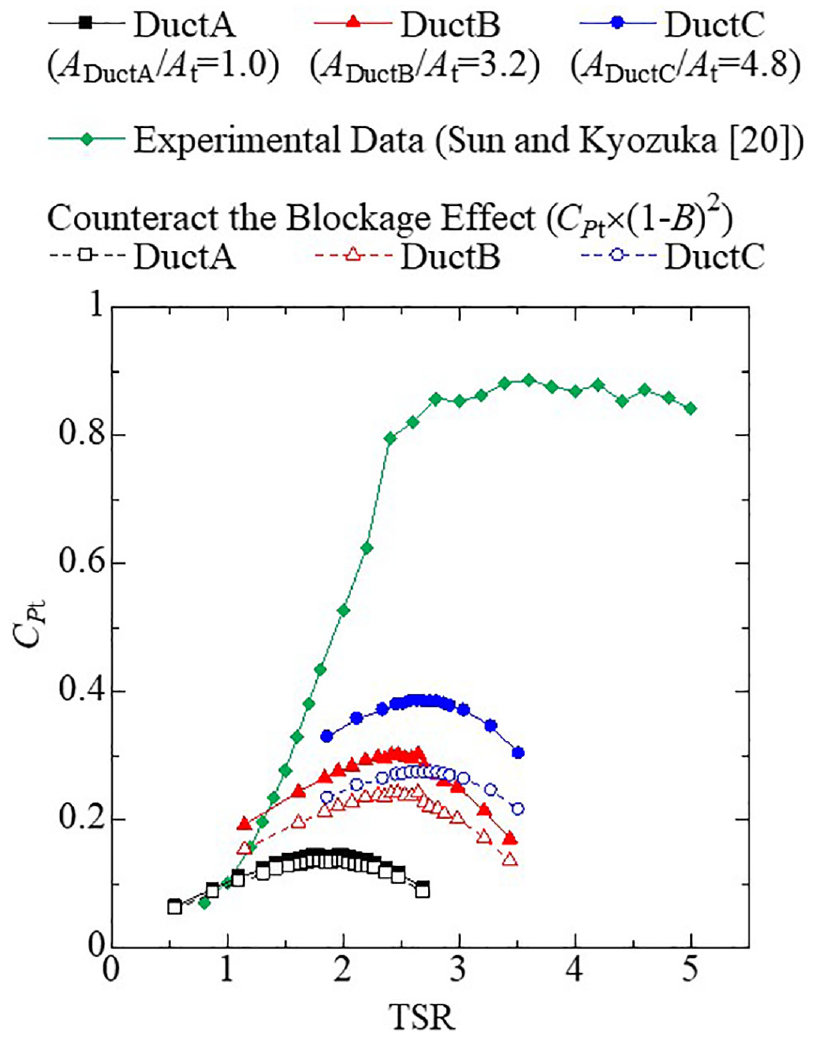
Figure 10 shows the power coefficient CPd. Figure 11 shows the power coefficient CPt with the reference cross section as the cross-sectional area of the turbine. The design values at TSR = 2.6 are DuctA: CPd,design = 1.5, DuctB: CPd,design = 0.47, DuctC: CPd,design = 0.31 and all ducts: CPt,design = 1.5. The blockage effect in the water tunnel test section may be larger for a larger maximum duct area ratio. The CPd,design in DuctA exceeds the Betz limit (0.593) because the turbine is designed as an internal flow. Garrett and Cummins 28 conducted a theoretical investigation of the blockage ratio and showed that the maximum power coefficient for a single turbine at blockage ratio B is (1 − B)−2 times the Betz limit. To counteract this blockage effect, each power coefficient is multiplied by (1 − B) 2 , and the corrected values are shown in the filled white plots in the figure. This results in a correction for the blockage effect, which is approximately 94% for DuctA, 80% for DuctB and 71% for DuctC, but does not alter the magnitude correlation. The experimental data for the ducted turbine of Sun and Kyozuka 20 are also included in Figure 11 in a green plot. Figure 10 shows that the TSR at the maximum value of CPd is larger for larger maximum duct area ratio. The maximum values of CPd for DuctA, DuctB and DuctC are 9%, 20% and 26% of the design values, respectively, and DuctC is closest to the design value. CFD should be used to investigate the cause of this difference and incorporate it into the design method. As with CQd in Figure 8, CPd of DuctA is larger at small values of TSR, while CPd of DuctC, which has the largest maximum duct area ratio, is larger at TSR > 3.0. In addition, the turbine-area-based power coefficient CPt is the highest for DuctC. This trend in different ducts was qualitatively consistent with the results obtained using an impulse turbine by Sakaguchi et al. 29 In other words, for both impulse and reaction turbines, a larger maximum duct area ratio is advantageous for fluctuating flows, such as tidal currents, because it allows the turbine to generate power for longer times, even at lower tidal velocities when the TSR is high. Comparing the experimental data of Sun and Kyozuka 20 with the results of DuctC, the DuctC results are approximately half the value of Sun and Kyozuka’s experimental data. The duct used by Sun and Kyozuka has an asymmetric shape, therefore, the data in Figure 11 correspond to flow in only one direction. Therefore, to generate power at the performance shown in the figure, power must be generated in only one direction flow, or the entire turbine must be rotated 180°. The bidirectional ducted turbine can accommodate changes in tidal flow direction and reduce the cost of rotating the entire turbine and changing the pitch angle of the blades.

C Pd against TSR.
C Pt against TSR.
Thus, the experimental results for the designed turbine were clearly lower than the design performance. In this study, AVR was assumed as the design value for simplicity as the first step in establishing a design method suitable for ducted turbines. The discrepancy between the design and experimental values is one of the major causes of the difference between the design performance and experimental results. In addition, a one-dimensional design was developed using Δvt as the representative value for the entire turbine. Further research is necessary to determine each representative value for Δvt, such as the radius and effect of duct geometry. In addition, it is known that energy losses and fluid vibrations occur during the transition between turbine operation and pump operation in pump turbines where the flow direction and turbine rotation direction change. 30 In the turbine of this study, it is necessary to investigate the energy loss and the fluid vibrations associated with the changes in the tidal flow and the direction of the turbine rotation for the safety design. However, this design method can significantly reduce the required time compared with the CFD method. It is possible to establish a low-cost, time-effective design method suitable for ducted tidal turbines by revisiting the AVR estimation method and the selection method for representative values and by improving the accuracy of the design method in the future.
Figure 12 shows the thrust coefficient CT. A larger CT was obtained in the order of the maximum duct area ratio, and the coefficient was approximately 2.5 for DuctC. The maximum CT value increased linearly with the maximum duct area ratio. From the torque and power coefficients in Figures 8 to 10, a larger maximum duct area ratio can be expected to generate more power. However, a larger maximum duct area ratio than that of DuctC results in a larger CT; thus, there is a trade-off between the installation cost and power generation. Although a more detailed investigation is necessary to determine the optimal maximum duct area ratio, CT = 2.5 is sufficiently large; hence, opening beyond DuctC is not recommended. In the future, the design method will be improved to incorporate duct design, aiming at designing turbine systems with reduced thrust and higher power generation.

C T against TSR.
Conclusion
This study aims to establish a suitable design method for ducted tidal turbines. The turbine was designed using the method used for turbomachinery, and the turbine performance was experimentally investigated for different duct geometries. The key points of this study are as follows:
A simple one-dimensional design suitable for ducted turbines was developed using Euler’s equation and the potential theory.
The results of the performance test of the designed turbine were significantly lower than those of the design performance owing to the axial velocity ratio assumed in the design and the method used to select the representative values for the design. This indicated that the axial velocity ratio was more affected by the blockage ratio in the duct than the maximum duct area ratio of the duct.
The pressure difference between the front and rear of the turbine and the torque was different for different duct geometries, even though the flow rate through the turbine did not differ. This means that the inflow energy into the duct depends on the maximum diameter of the duct. When the flow turns around the outside of the duct, the kinetic energy is converted to the pressure energy. In order to improve the accuracy of design methods in the future, it is important to incorporate the effect of duct geometry on inflow energy into the design method.
In this design, although the theoretical equation used is suitable for internal flow, variables related to duct geometry are not included in the design equation. In the future, the accuracy of the design method can be improved by considering the duct shape, incorporating the flow not only inside but also outside the duct, and reviewing the method for estimating the axial velocity ratio and selecting the design representative value.
In the large tip speed ratio region, ducts with larger maximum duct area ratios have larger torque and output coefficients and are more effective for tidal velocity fluctuations. Furthermore, the thrust coefficient is large for ducts with larger maximum duct area ratios; therefore, the optimum angle should be investigated in the future. By improving the design method to include the duct section, and by designing ducts to capture more energy and high-power turbines, tidal current energy generation could be a leading candidate for renewable energy. In addition, this design method targets complex flow fields with both internal and external flow characteristics. Further investigation of the flow mechanisms and their implementation into the design method could contribute not only to tidal turbines, but also to a wide range of other fields with similar characteristics.
Footnotes
Appendix
Handling Editor: Chenhui Liang
Declaration of conflicting interests
The author(s) declared no potential conflicts of interest with respect to the research, authorship, and/or publication of this article.
Funding
The author(s) disclosed receipt of the following financial support for the research, authorship, and/or publication of this article: This work was supported by the Hatakeyama Research Grant from the Turbomachinery Society of Japan.