
Abstract
Actual testing and prototyping costs make up a significant portion of engineering budgets. Virtual demonstration mainly relies on fast and accurate models with robust performance prediction capability as a cost-effective solution. In this manuscript, GT-Suite, a one-dimensional simulation tool is preferred for developing an isothermal battery model. The developed battery model is implemented to a Light Commercial Vehicle model to run Worldwide Harmonized Light Vehicles Test Cycle. The critical outputs such as state of charge, energy depletion, heat rejection, and generated power are reported. Histograms such as pack current, charge, and discharge current with respect to its nominal capacity (C-rate) are also created to examine the operation capability of battery. In the results, it is seen that the state of charge diminishes from 90% to 82%, as an expected behavior. It is also found that the Parallel Sparse Direct and Multi-Recursive Iterative Linear Solvers methodology reduces the simulation duration by approximately 100 times, in comparison with Singular Value Decomposition Electrical Inversion Scheme. The runtime of the battery pack modeled with the cellular approach combined with the SVD method is more than 90 h. However, the runtime drops to 0.75 h when the PARDISO technique is applied. The method developed within this study can be used for rapid and accurate development of batteries. The verification can be completed in virtual environment and a vital reduction in engineering/prototype/test costs can be guaranteed. The innovation the developed methodology propose is ensuring a fast and reliable performance assessment via taking the holistic effect of integrated models into consideration. Hence it is possible for original equipment manufacturer to completely or gradually eliminate the actual tests and hence prototype costs, test system, and engineer allocations.
Keywords
Introduction
Humankind is facing the most critical problem that she has ever encountered. The global warming problem is currently a global warning for every individual living on earth. Therefore, humanity needs to drastically reduce CO2 emissions and change their future policy about the technological portfolio.
Although emission regulations are getting stricter continuously, it is clear that an enhanced action list must be developed. Paris Agreement had defined a target of keeping global temperature rise under 2°C (1.5°C) above the pre-industrial era level. Besides, the World Health Organization’s local air quality limit for human health is 40 µg/m3 for NOx. Lowering the limit to 20 µg/m3 is currently under discussion.
Besides, “The Sustainable Europe Investment Plan” declared by European Commission will secure 1 trillion euros of investment over the next decade. The plan will make OEMs focus on pristine areas such as electrification, hydrogen, and synthetic fuels from renewable energy sources using carbon capture. It is also clear that some other regulatory precautions -such as Carbon Border Tax- will be taken to avoid carbon leakage and keep sustainable companies competitive.
Today, European Council has the primary responsibility of controlling the environmental measures, such as emissions. In May 2018, the council declared the new emission regulations valid for different vehicle variants. For heavy-duty trucks, OEMs must lower fleet-based CO2 values by 15% in 2025 and 30% in 2030; with respect to 2019 report-out values. Furthermore, the EU Commission President Ursula von der Leyen has introduced a “Green Deal” campaign which targets to reduce CO2 at least 50% ILO 40% for 2030 in Europe and guarantee that Europe will be the very first CO2-neutral continent before 2050.1,2 Last but not least, many discussions are ongoing for increasing the regulatory targets.
Heavy-duty diesel engine performance development studies will continue within the next three decades. There is still hope to lower the diesel engine related emissions significantly, as it is stated in different studies: Özgül et al., 3 Aldawood et al., 4 Smallbone et al., 5 Kim et al., 6 and Warnatz et al. 7 On the other hand, it can be easily anticipated that the strict fuel consumption reduction targets cannot be fulfilled by only developing conventional technologies. OEMs are currently focusing on creating a bundle of products, including conventional technologies and advanced ones such as electrification and alternative fuels.
Hydrogen is one of the most popular options to focus on. However, it is still not a mature technology and is not frequently encountered in serial production.
As a result, the electrification of vehicles is a clear obligation to fulfill the emission requirements. In the electrification of vehicles, there are many options to prefer, such as mild hybrid, strong hybrid, or alternative fuels. Implementing battery electric vehicles (BEV) to the product portfolio is also another strong alternative for further CO2 reduction. However, battery product development processes are pretty complex and costly. Creating prototypes and performing the tests in an actual test environment requires significant amount of budget, engineering effort, and duration. However, the virtual product development methodologies generated for battery product development processes are critical to obtaining the best designs within the lowest budget and project timings.
In this paper, the authors have generated a robust methodology for the virtual product development of batteries. First, several studies in the literature are described in Section 2. The methodology traced throughout the paper is briefly summarized in Section 3. Then, in Section 4, one-dimensional modeling fundamentals and techniques of battery equivalent circuit model are described. Next, basic definitions and formulas that are used in electrical circuits are presented in Section 5. Sample post-processing for an electric vehicle model to interpret the battery output results are provided in Section 6.
Literature survey
There are many studies focusing on battery development of battery electric vehicles. Thanagasundram et al. 8 worked on a second-order equivalent circuit in MATLAB/Simscape, and the parameters identification method by Hybrid Power Pulse Characterization (HPPC) testing is described. Since one of the studies aims to combine cell behavior’s electrical and thermal properties, a multi-domain physical modeling tool like Simscape was chosen. Lithium-ion cells of three different chemistries considered for the study are lithium cobalt oxide (LCO), lithium manganese oxide (LMO), and lithium iron phosphate (LFP). Multiple methods and techniques have been studied to calculate the internal resistance of the cell. To validate the second-order equivalent circuit model, comparisons were made between measurement and simulation outputs. Results indicate that the dynamic voltage response of the cell can be captured with less than 3% modeling error when the SOC value is between 10% and 90% in the second-order equivalent circuit model. Since EV and HEV vehicles operate in the 10% and 90% SOC range, this Second Order Equivalent Circuit model is sufficient to capture the dynamics of most lithium-ion cells. Dubarry et al. 9 also performed a study which is using an equivalent circuit model built with parameters from the cell test and showed that such high accuracy in the single-cell model is required for a high-fidelity packet simulation.
In their study, Jackey et al. 10 optimized the measurement and simulated results for the development of the lithium polymer battery (LiPB) cell model. The error between the measured and simulated results was minimized using an iterative numerical optimization algorithm. As a result, the optimized battery model has accurately completed many UDDS (urban dynamometer driving schedule) with an average voltage error of 1%.
Lei and Han 11 also studied the charging and discharging characteristics of Lithium-ion batteries. The relationship between open-circuit voltage and model parameters is analyzed based on RC equivalent circuit model. In this study, the factors related to the open-circuit voltage are analyzed by combining the lithium-ion battery’s equivalent circuit model with the lithium-ion battery’s charge and discharge characteristics. The measurement method of the open-circuit voltage is given. To verify the relationship between the measured terminal voltage and the actual open-circuit voltage, the fitting curve of the terminal voltage is compared with the actual open-circuit voltage curve. The results showed that the fitting curve of terminal voltage and open-circuit voltage curve are almost the same. They also showed that the terminal voltage can be used to predict SOC.
Mousavi and Nikdel 12 worked on battery models in six different categories as they required an accurate model of a battery that for obtaining appropriate analyses and simulation results. These models are; simple models, Thevenin-based models, impedance-based models, runtime-based circuit models, combined electrical circuit-based models, and generic-based models. Electrical circuit models were used in dynamic simulation studies such as wind energy conversion systems, photovoltaic systems, and electric/hybrid vehicle systems. The results showed that a generic-based model is an accurate and easy-to-use general model applied in modeling different battery technologies.
Gao et al. 13 has modelled a lithium-ion battery cell that is used in a smart battery power system. In this work, they propose an empirical electrical model for a lithium-ion battery based on a Simscape platform as it contains simpler algorithm. After the created model was verified at different SOC values, a comparison is made with the actual battery results. The results showed that the margin of error was relatively low. In addition, they have proven that another advantage of the developed model is the low amount of resources required for an application in a microprocessor for subsequent control.
Abulifa et al. 14 examined the battery of the electric vehicle components, and the simulation was analyzed using MATLAB-Simulink. The BEV components are transmission, electric motor, battery charge controller, driving Cycle, driver model, and longitudinal vehicle dynamic model. The model was created by mathematical equations applied for these six components. At the end of the MATLAB-Simulink results, data such as Battery Voltage, Current, Power, and the SOC were collected to determine energy flow, performance, and efficiency. The results showed that the simulation was running in good condition. Also, Tran et al. 15 conducted modeling studies on MATLAB to see the negative effects of early-degraded cells on the package. The results show that the cell replacement concept can be implemented if certain criteria are met, and these criteria have high costs.
Ju et al. 16 worked on a virtual battery model for battery simulation in electric vehicles. The virtual battery simulation framework is developed to predict the battery performance, investigate the effects of the manufacturing process, and obtain feedback for improving the battery design, control, and manufacturing processes. The model is based on combined kinetic, electrical control circuits, design, and thermal analysis by taking internal and external parameters into account. In order to represent the actual behavior of the investigated battery, eight different input signals were simulated. They have also shown that the model outputs are in good alignment with test results.
Since most of the electrical and thermal hazards encountered in the ion battery are related to short circuits, Zhao et al. 17 examined this situation by performing both external and internal short circuit tests. The results show that external short-circuit is harmful for small-size batteries and internal short-circuit is harmful for large-capacity batteries. Furthermore, a successful hydrogel- based thermal model has been proposed to show temperature changes in batteries. In addition, external and internal short tests on batteries and battery packs validate the effectiveness of a hydrogel-based thermal management system in suppressing thermal abuse and preventing thermal runaway propagation.
Gao et al. 18 investigated the studies on optimal charging algorithms for Li-ion batteries. The advantages and disadvantages of the examined studies were discussed, and suggestions were made to overcome the deficiencies. In this study, active and passive charging strategies were divided into two groups and compared among themselves. Comparisons are made in terms of battery type and charging methods. They have demonstrated that while passive charging strategies are simple to implement, they do not provide an optimal solution for maximizing charging speed and minimizing degradation. On the other hand, the active charging algorithm will increase the performance of the battery and the efficiency of the charger.
Li et al. 19 investigated the effect of the layout and channel design of cooling plates for a battery module. This study was carried out according to six different designs, with variable cooling plate position and cooling plate channel geometry. After the analysis and numerical modules, it was observed that the case with small size channels between the flow channels and cooling plates sandwiching battery module showed the best cooling performance. Also, Akkaldevi et al. 20 performed validation of a prismatic battery and two mini-channel cold plates with a single U-turn distributed flow. The predicted temperatures were compared with the measured data and found in close agreement, thereby validating the model.
Li and Mazzola 21 studied an advanced battery pack modeling method for automotive applications. In their study, an analog battery model with fixed parameters represents the entire battery pack. A new level of fast dynamic battery pack simulation was achieved by working on bandwidths. Kojima et al. 22 worked on an elliptical single cell, 4-cell module, and application-specific integrated circuit to monitor and control the cells. Lam and Louey 23 worked on the development of ultra-battery that is a hybrid energy-storage device, which combines an asymmetric supercapacitor, and a lead-acid battery in one unit cell taking the best from both technologies without the need for extra electronic controls. Wang et al. 24 conducted a study on battery thermal model development and thermal management strategies. The thermal effects of lithium-ion batteries and heat generation methods are investigated to make an accurate battery thermal analysis. Astaneh et al. 25 investigated thermal improvements in battery packs for electric vehicle applications using a two-step optimization methodology. In the first stage, a genetic algorithm is optimized for the cells according to their specific energy and maximum temperature.
It is obvious that, the main challenge with the examination of battery performance is the very slow product development phases ongoing in the market due to 3D CFD Models, or non-physical calculations obtained with semi-empirical, empirical, or 0D like models. Besides, component-based examinations are shadowing the proper examination of holistic effects or interactions between the vehicle, powertrain, thermal management, and battery structures. So, any examinations that will be performed without taking these interactions into consideration would be inappropriate.
In the second stage, cell-packet interactions are examined under realistic operating scenarios. Kanbur et al. 26 studied the heat distribution on the battery surface. In this study, a new method is proposed to predict the thermal performance of battery operation utilizing an infrared thermographic camera, based on surface temperature gradients and heat and exergy losses, using the data-driven dynamic mode decomposition method. Zhang et al. 27 examine the thermal management methods used in lithium-ion batteries and compare the advantages and disadvantages since the temperature of the battery has become one of the most critical parameters to be handled properly for the development.
Methodology
The study includes nine different methodological steps. By implementing these steps, it is possible to proceed with the virtual demonstration in battery development.
Define the minimum data requirement for battery modeling, collect the related data to initiate the modeling studies.
Develop a one-dimensional battery model in a proper software. In this paper, GT-Suite is used.
Collect the related data for the selected vehicle variant and finish the one-dimensional vehicle model.
Develop an integrated model by coupling the battery and vehicle models.
Select the correct vehicle cycle and related input set after calculating PMR value.
Investigate the best simulation options including the solver type and ODE control.
Run initial simulations.
Check the system stability by examining the controller outputs, ensure that a robust simulation is run.
Report out the main outputs in form of histograms and transient graphs to examine the performance of the battery within predefined limitations and assumptions.
The advantages of the proposed methodology can be listed as:
The methodology is fast and robust in comparison with any 3D CFD based solutions.
The methodology is based on completely physical calculations. No map-based or zero dimension based calculations are employed as it is in phenomenological models.
It ensures that different system models including battery and vehicle models operate in a harmony. Hence, the methodology ensures taking the combined physical effects that could be only understood via integrated models.
The methodological steps are universal and can be adapted by any OEM to eliminate the need for actual tests.
The methodology defines the minimum data requirement and hence abolish the need for excessive data to have a proper examination.
One-dimensional modeling
Electrical circuit convention
Theoretically, in a DC circuit, electrical current tends to flow from positive to negative. Therefore, the negative terminal is grounded to read positive voltage at the battery object. This convention is used throughout the study.
Building an eectrical circuit
Below listed systems are used for developing the one-dimensional model:
Electrical nodes, which are electrical components having a common voltage values with the connected objects.
Ground
Battery
Sources (power, voltage, and current)
Electric motor
In the one-dimensional model, the ground is connected to a single node. The ground position determines the nodal voltage sign convention and current flow direction. The battery is also connected to the nodes so that it has a proper sign convention.
A consumer or generator such as an electric motor, power source, voltage, or current source is also added to the circuit while keeping the proper sign convention.
By practicing the above guidance, a battery-electric vehicle is created.
Battery data requirement
Even if the selected software is mainly a one-dimensional one; some critical inputs must be collected before the model development. The data requirement items are listed in Table 1. Parameters that are noted as essential should be implemented into the model, representing the minimum data requirements. Optional parameters are required for improving the cell electrical and thermal behavior, but not essential to run the simulation.
Requirements for electrical-equivalent circuit battery modeling.

C-rate is the charge and discharge current with respect to its nominal capacity. If there is no HPPC test data available, the Thevenin parameters may be neglected. The assumption will reduce the accuracy of cell dynamics.
If the model is intended to be built isothermally, and cell dynamics are not important, the Thevenin parameters and temperature dependent parameters can be neglected. The results will show a general insight into the battery pack performance of the vehicle in return of decreased accuracy. Yet, it is still logical to interpret the results for the comparison of different batteries.
Battery modeling techniques
Electrical-Equivalent Battery Circuit can be modeled in three ways;
Single battery object: the whole battery pack can be modeled as a single battery object. It has the advantage of significantly reduced runtime.
Modular: Modular modeling can provide more information from module to module in terms of temperature than the single battery object. However, the runtime is more significant.
Cellular: Cellular modeling is the most precise method. It is possible to evaluate the cell-to-cell variations voltage, current, and temperature. The main drawback is the significantly reduced runtime.
In this study, authors excluded the heat transfer effects and the simulation is run at isothermal (25°C) conditions. Isothermal assumption will reduce the simulation accuracy. Optional data requirements are also neglected, only taking essential requirements into consideration. In addition, single object and cellular modeling methods are compared in terms of runtime.
The 90S2P battery pack of the vehicle is represented by using a single battery object and cellular approaches in Figure 1

A basic battery-electric vehicle model in GT-Suite.
Building a battery electric vehicle model
A battery-electric vehicle is created in GT-Suite to interpret the battery pack outputs, shown in Figures 2 and 3. The battery pack is modeled as a single object because of its simplicity. Thevenin parameters and Coulombic efficiencies are neglected since there wasn’t enough test done on the test for these parameters. Along with the battery, vehicle, and electric motor objects, a battery controlling module that limits the battery output is present. Current limitation is present in the cells. The vehicle is allowed to run between 90% and 10% SOC. The target speed is given to the vehicle using a robust driver controller object. This controller senses the actual speed and sends the pedal position to the electric motor as an electrical signal input. The only electrical consumer is the electric motor, including heat and bearing losses. Battery pack also loses heat due to internal resistance. However, it should be noted that system is assumed isothermal. The electric motor drives the vehicle through a differential. The vehicle has no gear reduction except differential. All of the mechanical properties such as moment of inertia, weight, friction, and surface area of the vehicle are implemented into the model to account for mechanical and aerodynamical losses. The model has a basic brake controlling system, which takes inputs from the driver controller object. For the energy balance and consumption calculations, a sub-model is developed. Considering the supplied and depleted energies, calculation of the energy balance is conducted.

A basic battery-electric vehicle model in GT-Suite.
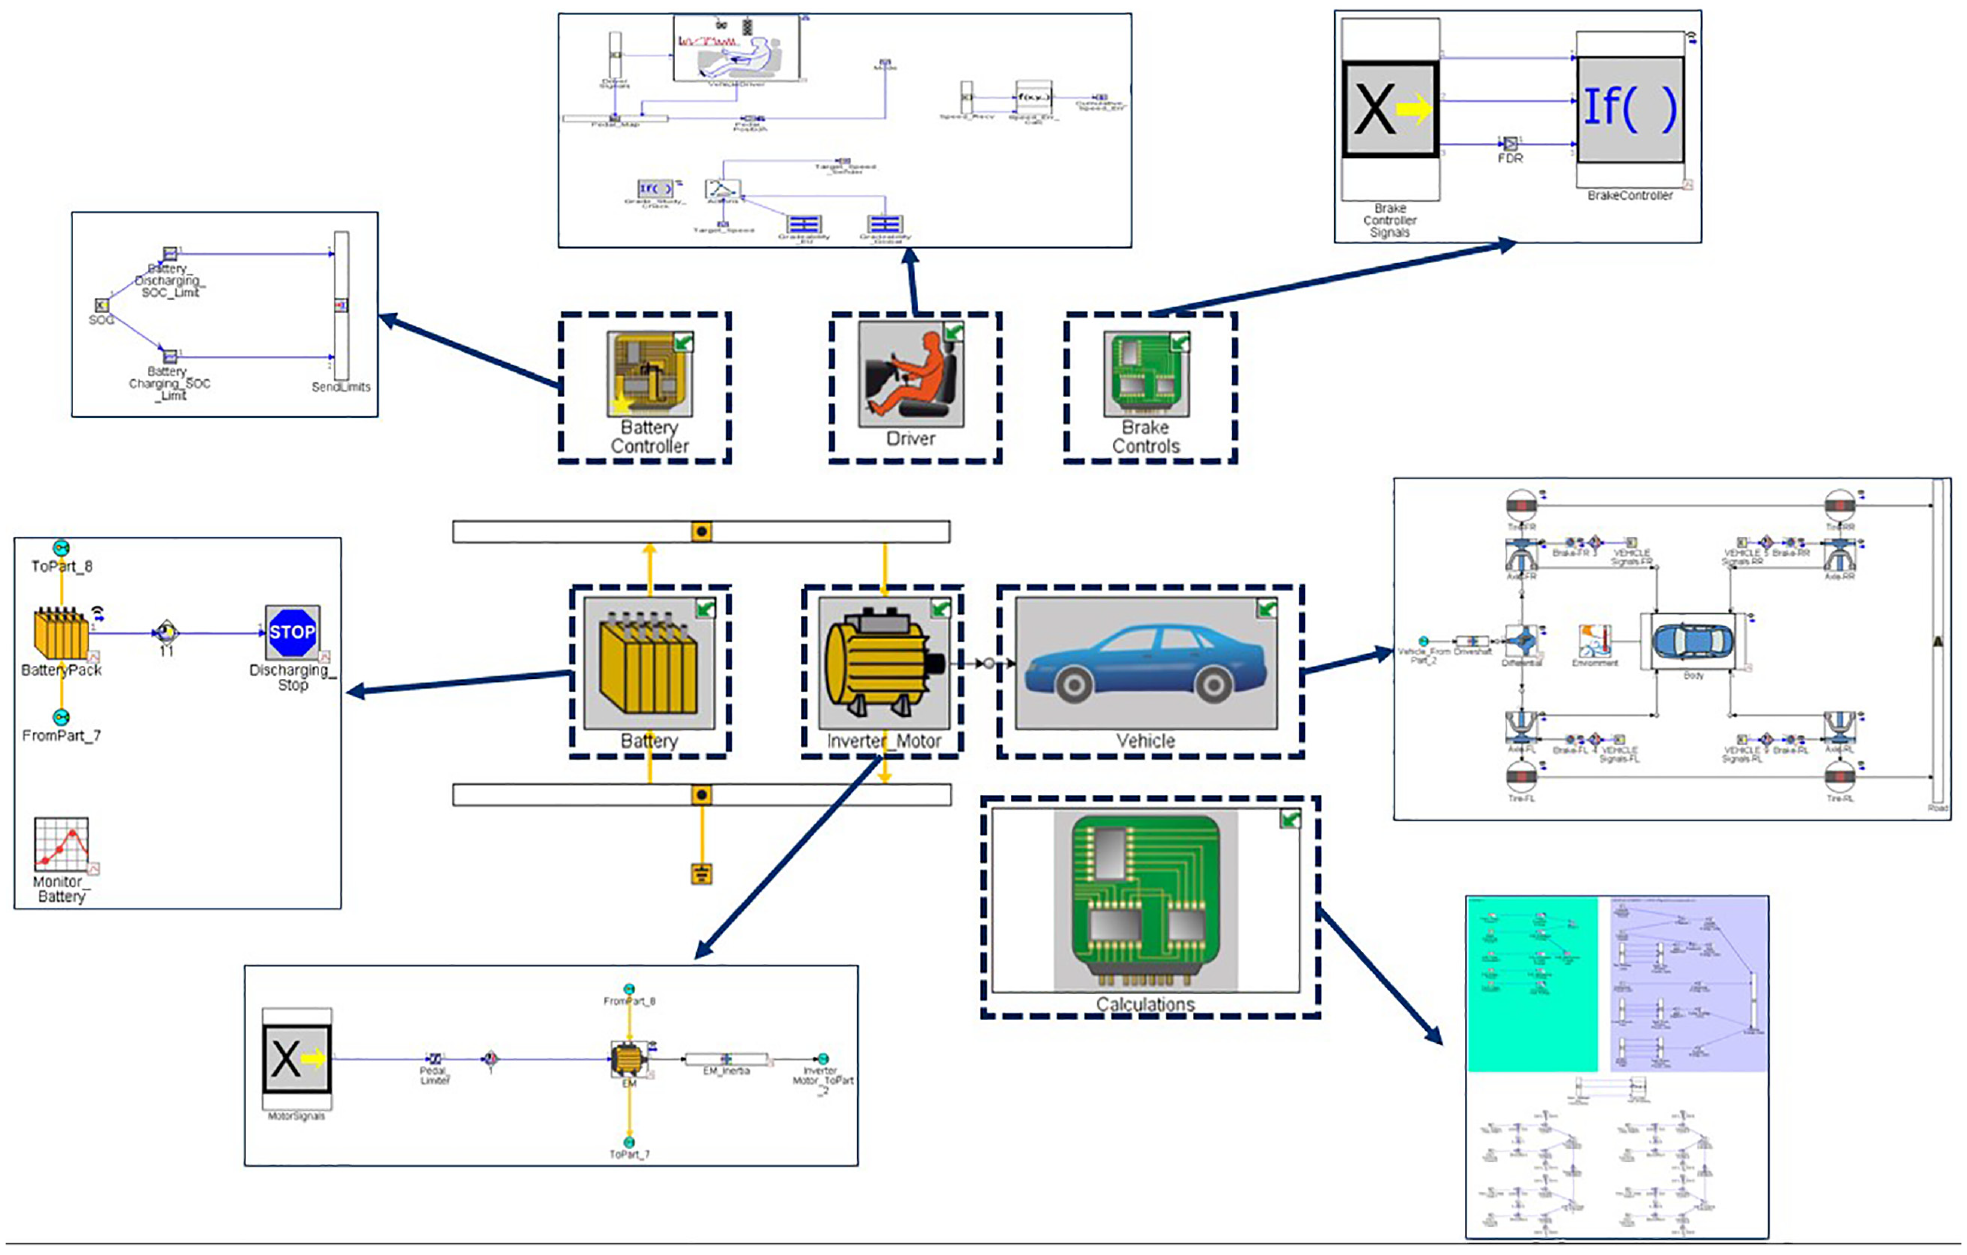
A basic battery-electric vehicle model in GT-Suite (detailed).
The vehicle properties are listed in Table 2.
Vehicle properties.

The cell properties are listed in Table 3.
Cell properties.

Standardized test procedures are recommended to specify the consumption and emission of a vehicle and check if they are within the accepted limits. They are created with the guidance of EU laws. This way, the same conditions are applied in every automotive company. In the EU, new light-duty vehicles will be approved by only WLTP (Worldwide Harmonized Light Vehicles Test Procedure) results. (September 2018 onwards). WLTP includes the effects of weight, aerodynamics, and rolling resistance. WLTC is branched under WLTP. So, the vehicle-based energy consumption and emission evaluations are conducted under WLTC conditions.
WLTC classes are categorized as;
Class 1: PMR ≤ 22 kW/t
Class 2: 22 < PMR ≤ 34 kW/t
Class 3: PMR > 34 kW/t
Details of the main properties for WLTC classes 28 are listed in Table 4.
Definition of WLTC test cycle.

According to the PMR of the simulated vehicle, the WLTC Class-3 cycle is initiated with an initial value of SOC: 90%.
Model boundary conditions and assumptions are listed in Table 5.
Boundary conditions and assumptions.

Run setup
For a successful virtual demonstration, the run set-up must be set by taking the trade-off between the accuracy and runtime into consideration. In this study integrator type, matrix optimization method, matrix storage format, and electrical matrix inversion scheme are specified to achieve that goal. 29
Integrator methods lead the running process of mechanical, electrical, and magnetic ODE’s. Matrix optimization methods determine the solution matrix optimization algorithm which is mainly improving the runtime and efficiency. Matrix storage format methods control the mechanical matrices and are categorized as Skyline and Compressed Sparse Row methods. Ten integrator and three matrix optimization options are present. Electrical schemes are divided into SVD and PARDISO solver methods. The selected methodologies are shown in Table 6.
Run setup options used in the model.

Regarding the integrator methods, the most widely used solver is the Explicit Runge-Kutta Integrator, which is recommended for non-stiff problems. Non-stiff problems exclude spring and damping systems, chemical kinetics, and control systems. If there are both low and high frequencies present, the system is considered to be stiff. The maximum timestep is tuned by considering the trade-off between the accuracy and simulation duration.
There are three possible matrix optimization methods, which are Cuthill-McKee, The Sloan method, and Cuthill-McKee and Sloan mixture. Generally, the Sloan method is preferred for large finite element models and the Cuthill-McKee and Sloan mixture option is recommended for large, non-finite element, and long simulations. By also considering the significant runtime advantage, the Cuthill-McKee option is selected for general mechanical simulations.
The Skyline method stores banded matrices, regarding the matrix storage format methods. If there are 1000+ degrees of freedom, the Compressed Sparse Row option is selected. This option takes out the zeroes inside the matrix and compresses it, and reduces the memory need.
The SVD scheme uses the logic of generalizing the Eigen decomposition of a square (mxm) matrix to any (mxn) matrix. It is a robust solver scheme, but in case there are many electrical components, run time significantly increases. Therefore, this option is selected when there are small numbers of electrical components.
Parallel Sparse Direct and Multi-Recursive Iterative Linear Solvers (PARDISO) is a new experimental robust and high-performance option that solves large sparse symmetric and unsymmetric linear systems. Although the SVD scheme is more accurate, PARDISO is significantly faster if the model contains many electrical components.
Post processing
After finalizing the run set-up, the initial simulation are performed to guarantee that the controllers do not oscillate and voltage/current senses are correct.
System stability is also investigated by checking the component limits and outputs such as SOC, energy depletion, heat rejection, and the generated power. Components generally should work on their continuous state and also should reach peak power when necessary. Besides, histograms are created to evaluate the time residencies of the operating modes of components. It is guaranteed that the conservation of energy is checked by considering the battery supplied electrical energy, depleted heat energy, and converted mechanical energy.
Battery calculations
In this study, the SOC is defined as the ratio of the available capacity to the maximum possible capacity, as shown in Equation 1.
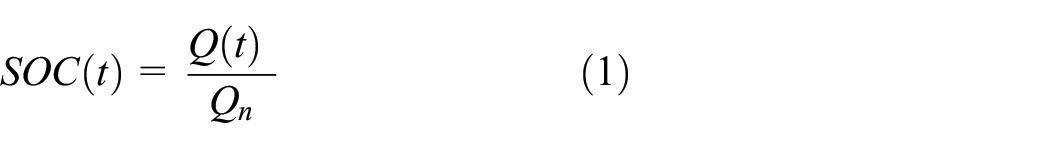
(where Qn: nominal or max capacity, Q(t): instantaneous capacity)
The coulomb counting method can also be used to determine the SOC. It is estimated from the discharge current I(t). Other factors that affect the prediction of the Coulomb counting method are battery aging, C-rate, and temperature, as shown in equation (2).

Results and discussion
It is concluded from the results that the model built can mimic the real-life conditions, which can be seen from the battery pack and electric motor outputs. If the vehicle mechanical properties, electric motor and battery input data, and power consumers are entered correctly, the results will more likely be realistic, reducing the need of tests. During this study, parameters are entered precisely, except the dynamic behaviors of the cells (Thevenin parameters) and thermal effects. From Figure 4, it is evident that the vehicle model could follow the target speed during the cycle. The electrical energy consumption causes the decrease in SOC. As it is shown in Figure 5, the SOC diminished from 90% to 82% at the end of the WLTC cycle.

Instantaneous vehicle speed during the cycle.
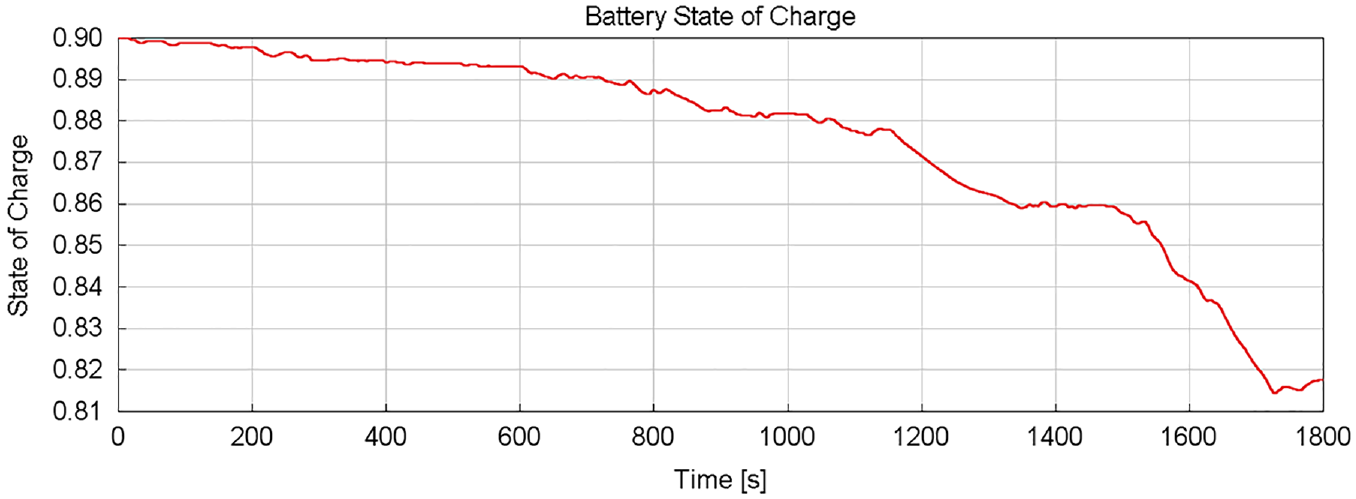
Change of SOC with respect to time.
Another two critical outouts to be investigated are Open Circuit Voltage (OCV) and Pack OCV values. When no load is present in a battery circuit, the measured voltage is OCV. It shows the maximum potential difference in the battery. If a load is connected to the battery terminals, resistance to current flow occurs. The measured voltage is named terminal voltage. It differs from the OCV since resistance to current flow causes a voltage drop across the terminals. Pack OCV is directly related to the SOC; hence the trend is always expected to be the same. OCV and SOC are reduced in the same manner, as expected in Figure 6.
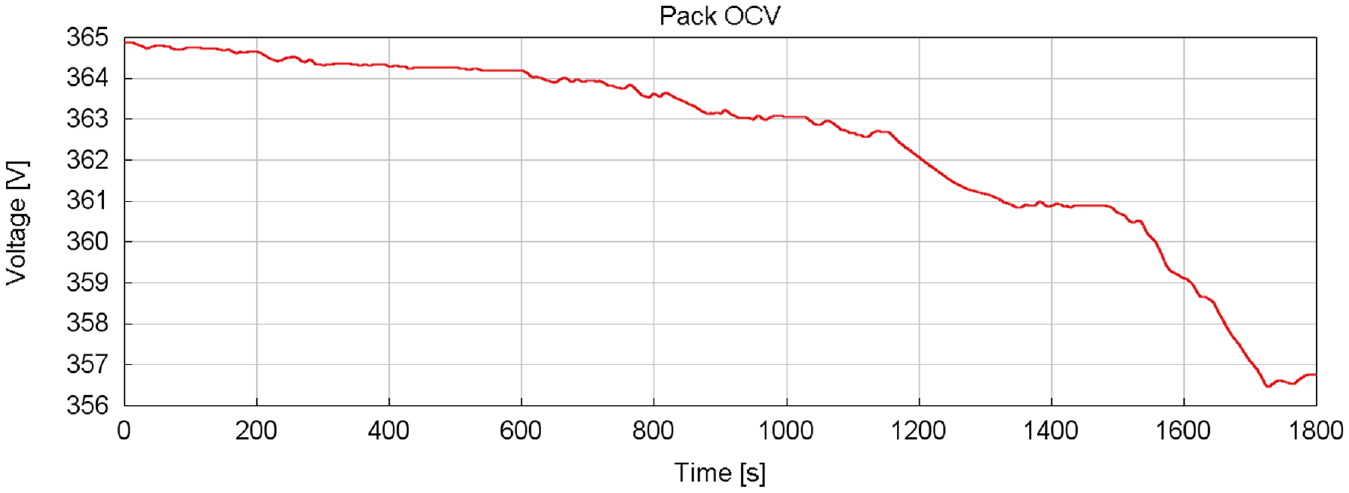
Change of pack OCV with respect to time.
The terminal voltage has a different characteristic compared to the OCV, as it is seen in Figure 7. Because, the applied load causes a voltage drop across the terminals. These two figures show the effects of the battery characteristics and voltage drop caused by the resistance to current flow. The distinction between the two allows investigating the internal resistance effect of the batteries. The value can be utilized for the back-to-back comparison of different cells.
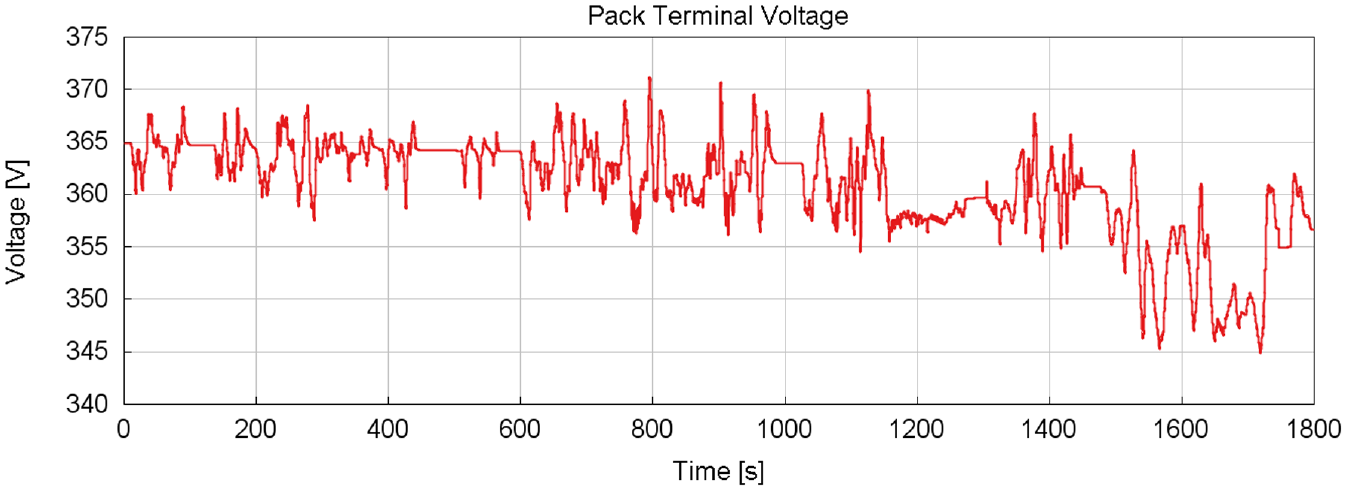
Change of pack terminal voltage with respect to time.
In Figure 8 the electric motor brake power distribution can be seen as a function of time. The maximum brake power of the electric motor is 61 kW, which exceeds the continuous power of 60 kW by 1% and lasts only 0.5% (intermittently 9 s) of the whole cycle. The peak power duration of electric motors generally ranges from 5 to 60 s, depending on the cooling capacity and operating temperature. This histogram is helpful for future torque and energy residency estimations.

Electric motor brake power histogram.
In Figure 9 the terminal power distribution is demonstrated as a function of time. The maximum discharge power in the system is 64 kW and lasts only 0.5% (intermittently 9 s) in the whole cycle. It is the required power to achieve the 61 kW peak cycle power. The peak terminal power is lower than the peak brake power during regeneration, as expected. The difference between discharge power and brake power is essential for judging the losses between the battery and the motor.

Pack current histogram.
The C-rate limit during the charge and discharge is −0.5°C and 2.7°C; respectively. The simulation yielded a minimum of −0.82°C during the charge. During discharge, C-rate limitation isn’t exceeded and is on the safe side. As it is seen in Figure 10, the time residency of the maximum charging currents that exceed the charging current limit is approximately 2% (intermittently 36 s) of the cycle. The histogram is helpful to look for the time residencies of battery usage and abuse, therefore can be utilized for the aging studies.

C-rate histogram.
Energy balance calculation is another important output of the study. Electrical energy is supplied from the battery. The energy is lost via heat rejection from battery, motor, driveline, aerodynamics, and tires. The component loss distributions are then investigated to take action on improving the component efficiency.
The energy source is the battery. When the battery is used, a portion of the energy is lost via heat rejection. The remaining electrical energy is converted to mechanical energy in the electrical motor, with conversion losses dissipate as heat. The efficiencies of the battery pack and electric motor are calculated and shown in Table 7.
Supplied energy efficiencies of battery pack and electric motor.

A similar calculation is also completed for electric motor. Several factors dissipate the mechanical energy supplied from the e-motor. The majority of the losses are arisen from aerodynamics (by 55%) and tires (by 21%). Although a basic braking system is present in the model, it is not in-use. Because, the use of recuperation algorithm may cause to the undesired decelerations of the vehicle to follow the speed profile. The loss shares of different factors are represented in Figure 11.
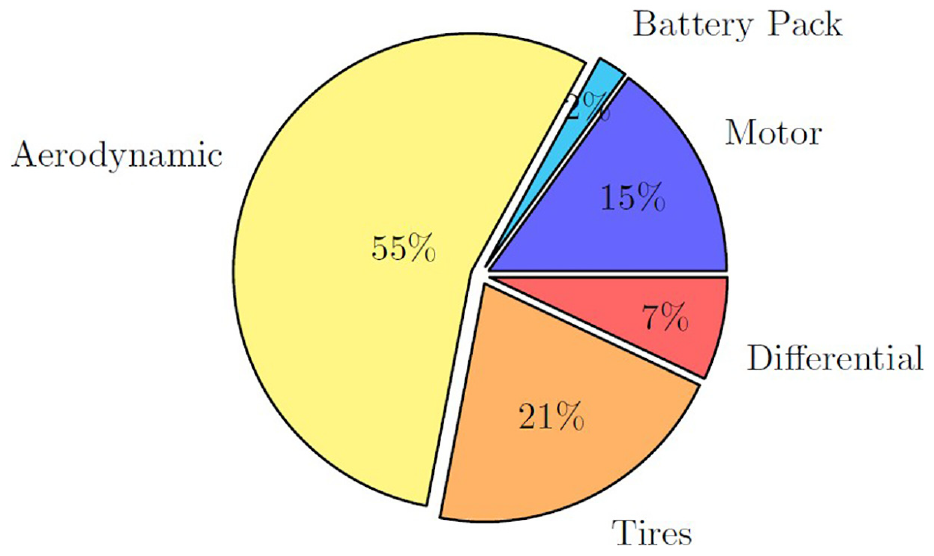
Loss shares.
The runtime of the battery pack modeled with the cellular approach combined with the SVD method is more than 90 h. However, when PARDISO method is used, the runtime reduces to 0.75 h.
Conclusion
The strict emission regulations obviously make OEMs focus on the new technologies such as alternative fuel and electrification. It is clear that keeping the battery electric vehicles within the future product portfolio is an obligation for OEMs, rather than a preference. However, the conventional product development cycle of battery electric vehicles with early-stage prototypes and actual tests is very complex and require long project timings and costly budgets. On the other hand, the virtual product development methodologies can easily lower the needs for a successful product development.
Virtual product development tools are replacing the actual test need significantly. The need for eliminating the actual tests with an improved pace is a requirement for OEMs. The innovation which the developed methodology propose is ensuring a fast and reliable performance assessment via taking the hollistic effect of integrated models into consideration. Hence it is possible for OEMs to completely or gradually eliminate the actual tests and hence prototype costs, test system, and engineer allocations.
In this manuscript, a fast and robust methodology for battery development is generated. First of all a one-dimensional model of battery is developed. Then the vehicle model is generated for a Light Commercial Vehicle variant. The proper test cycle is selected by examining the emission regulations and by calculating the PMR value of the selected vehicle variant. According to the PMR of the simulated vehicle, the WLTC Class-3 cycle is initiated with an initial value of SOC: 90%. The robustness of the model is checked via initial simulations. After ensuring that there is no instability in the results, WLTC-based cycle simulations are completed.
Effect of different solver schemes are also investigated. It is found that the PARDISO solver is significantly faster than its alternatives. For example, the battery pack modeled with the cellular approach combined with the SVD method lasts 90 h, while this time is 0.75 h with the PARADISO technique. Finally, by utilizing from the histograms and transient graphs; the physical condition of battery is reported out. The time residency of the maximum charging currents can be utilized for the aging studies. As seen in Figure 10, the time residency of the maximum charging currents that exceed the charging current limit is approximately 2% of the cycle. It is detected that the model mimics the physical changes realistically and can be used for further iterations to lower the product development period.
The developed methodology enables the fast and physical examination of battery performance via eliminating the need for 3D CFD models, empirical models, or phenomenological models. It facilitates obtaining a thorough understanding of whole vehicle performance via employing integrated models. The methodological steps are clearly defined to guarantee that any OEM can implement to their own virtual product development processes.
Last but not least, it can be stated that the methodological steps developed within this paper is not limited with a specific vehicle variant. It can also be implemented to battery development related studies of passenger cars or heavy-duty trucks.
Footnotes
Appendix
Acknowledgements
The authors would like to thank to Cem Demirkesen, Sinan Göktepe, Ayhan Çınarköok, Can Avcıoğlu, and Emrah Kınav for their valuable feedbacks.
Handling Editor: Chenhui Liang
Declaration of conflicting interests
The author(s) declared no potential conflicts of interest with respect to the research, authorship, and/or publication of this article.
Funding
The author(s) disclosed receipt of the following financial support for the research, authorship, and/or publication of this article: This study is accomplished within the content of the EU Horizon 2020: H2020-LC-BAT-10-2020 Albatros Project.