
Abstract
To build a synchronization error prediction model for the machine tool efficiently, a robust whale optimization algorithm (RWOA) method proposed in this study is applied to the hyperparameter optimization of its model. The proposed RWOA method integrated a non-linear time-invariant inertia weighting (NTIW) method and a Taguchi-based adaptive parameter exploration (ATPE) to improve the performance of WOA and promote robustness. The NTIW method can improve the performance of other algorithms, so this study used the NTIW method in the WOA. In addition, the Taguchi method can get an excellent combination of variables with optimal values and stable performance, making the WOA robust. First, to verify the validity of the proposed RWOA method, 13 benchmark functions were used in this study. The results of the benchmark function tests include the mean, standard deviation, and p-value of the t-distribution test. The results show that 11 of the 13 functions differ significantly. In other non-significant difference functions, the means and standard deviations obtained by the proposed RWOA are considerably better than those obtained by WOA. Since the product cost of machine tools is higher, if a prediction model can be built effectively, it can reduce the cost. Therefore, in this study, the proposed RWOA was used to explore the best hyperparameter combination for the model. From the results, the model’s average MAPE (mean absolute percentage error) was 7.2604% for training data and 9.2603% for the testing data under 30 modeling runs. For the best one in 30 models, the MAPE was 6.8384% for the training data and 6.7372% for the testing data. This model was also introduced into the actual machine in this study, and the experimental results showed the MAPE 6.3447%. The proposed RWOA method effectively explores a suitable synchronization error model for the tool machine.
Keywords
Introduction
Currently, Taiwan is actively promoting smart machinery, and the machine tool development industry is a vital focus. 1 In the application of machine tools, the high-speed tapping process is one of the main evolutions. Whether in the 3C electronic or mold industries, internal threads are processed by a rigid tapping process using machine tools. This process is expected to be carried out with high speed and accuracy, and the synchronization error is the quality observation index. If an effective synchronization error model can be constructed for rigid tapping, quality and accuracy can be improved; through the resulting model, an effective prediction model can be established, and parameters can be adjusted through this secondary model. The parameters that affect the synchronization error include the time constant for acceleration and deceleration of rigid tap, the proportional gain of the rigid tapping speed ring, the motor excitation delay time, the rigid tapping speed loop integral gain, the position feedforward coefficient, and the tapping axis position gain. At present, however, most of these parameters are adjusted based on the experience of human engineers or industry specialists. The results may not always be satisfactory. If the parameters or factors that affect the synchronization error can be effectively explored, the quality of rigid tapping (synchronization error) can be improved, and it is clear that parameter adjustment technology is a core issue that is crucial to upgrading the tooling industry. One of the most critical aspects of parameter tuning is creating a valid and suitable model. By using the model, the target value can be effectively understood without costing material.
In addition, because of the high cost of materials and tools in the machine tools industry, a model can be built at a lower cost if the data is appropriately collected. Therefore, in order to construct an effective quality prediction model for a machine tool, this study used experimental design methodology to collect representative machine process data. In this study, the Yeong Chin Machinery Industries Co. Ltd. NDV series machine tool 2 and the FANUC 31iMA controller were used to collecting the modeling data. Artificial neural networks were used to construct the model effectively. In most cases, when building a model, the hyperparameters are always tuned by trial-and-error or randomization. However, trial-and-error or randomization is not a systematic approach, so it often takes a lot of time to try or many attempts and experiences to obtain a suitable set of hyperparameters. Therefore, to systematize and automatize the process of tuning hyperparameters, this study proposes a robust whale optimization algorithm (RWOA) to optimize parameters in order to explore suitable hyperparameters for neural network models. The proposed RWOA is a systematic and effective parameter optimization method suitable for optimal hyperparameter exploration and meets the requirements of hyperparameter tuning techniques. Therefore, the proposed RWOA as developed in this study is used to optimize the model’s hyperparameters for the high-speed tapping process.
Swarm intelligence optimization (SIO) techniques are used to simulate organisms’ food exploration or foraging behavior to optimize parameters or variables; common approaches include particle swarm optimizer (PSO),3–6 glowworm swarm optimization,7,8 ant colony optimization, 9 bee colony algorithm, 10 group search optimizer, 11 grey wolf optimization algorithm, 12 and whale optimization algorithm (WOA). 13 In SIO, every individual has a location; the updated location should have more food for the individual, so that the swarm can find such a location. Different SIO techniques adapt or explore the environment through different group interactions. Because of their simplicity and intuitiveness, SIO techniques have long attracted researchers’ attention internationally in many related fields. Over the years, academic papers on SIO techniques have been published with increasing frequency, and the industry has often applied SIO techniques in parameter optimization. 14 Ding et al. 15 used a support vector machine (SVM) and PSO algorithm to model the prediction of the output voltage for supercapacitors. Kulkarni and Ghawghawe 16 exploited the dragonfly algorithm (DA) and PSO to build a hybridized model for the power system’s thyristor-controlled series compensator configuration. Tsai et al. 17 proposed an adaptive network-based fuzzy inference system and a sliding-level particle swarm optimization to optimize the parameters for a chemical-mechanical process for polishing a color filter. Jawad et al. 18 integrated exponential and polynomial functions into PSO for a path-loss model in agriculture. Zhao et al. 19 proposed a Q-learning-based cooperative meta-heuristic algorithm to solve the energy-efficient distributed no-wait flow-shop scheduling problem with sequence-dependent setup time to minimize makespan and total energy consumption. Pan et al. 20 proposed a knowledge-based two-population optimization algorithm based on NSGA-II and DE to solve the distributed energy-efficient parallel machines scheduling problem and simultaneously minimize total tardiness and energy consumption. Wang and Wang 21 proposed a mathematical formulation and a cooperative memetic algorithm with feedback to solve the energy-aware distributed flow-shop with a flexible assembly scheduling problem, simultaneously minimizing total tardiness and energy consumption. Zhao et al., 22 Zhao et al., 23 and Zhao et al. 24 used different SIO methods to flow-shop scheduling problem. Specifically, the WOA explores the solution space’s optimal parameter values by simulating humpback whales’ foraging behavior to explore the optimal parameters of the solution space by humpback whale encircling prey, exploitation, and exploration. Zhao et al. 25 have introduced inertial weights into the WOA so that the current or randomly selected search whale positions are not fully learned but still retain some influence. Yang et al. 26 introduced a nonlinear time-varying inertia weight method into the fractional-order particle swarm optimizer and showed that it could effectively improve its performance. Therefore, this study’s first improvement is introducing the nonlinear time-varying inertia weight (NTIW) method into the WOA. In addition, as the whales enter the latter-search period, they gather in a particular solution space. Therefore, to effectively explore the optimal value in the latter-search stage, the whales are first updated through the encircling prey and exploration phases. Then, these two updated whale locations are used to figure out the best solution using the adaptive Taguchi-based parameter exploration (ATPE) method. Tsai et al.17,27 and Chou et al. 28 introduced the Taguchi method into a genetic algorithm (GA) and PSO, proposing Hybrid Taguchi GA (HTGA), and Hybrid Taguchi PSO (HTPSO), respectively. From their results, the Taguchi method can assist with obtaining optimal performance in both GA and PSO. To find the most suitable model for the synchronization error of the tool machine, this study first collected data on the synchronization error of rigid tapping in the tool machine and then used the proposed RWOA to explore the model’s hyperparameters. Based on the experimental results, the proposed RWOA can be used to search for an effective model.
This paper is arranged as follows. The next section describes the problem. The third section describes the proposed method of this study. The fourth section presents the experimental results, while the conclusion is presented in Section 5.
Problem description
Machine tools are used as power devices to assist in processing workpieces. From 3C electronics to the mold industry, machine tools are required to assist in the machining of internal threads, and doing so effectively is a critical process for manufacturing mechanical parts. Since threaded holes are generally made in the latter stages of manufacturing processes, the quality and performance of the machine seriously affect the product quality and performance of the part, so equipment manufacturers in related industries require fast and reliable manufacturing of internally threaded holes. Generally speaking, tapping is used to produce internally threaded holes, and can be divided into flex tapping and rigid tapping. The difference between the two forms of tapping lies in the different clamping tooling devices used; therefore, the synchronization requirements between the spindle and tapping axis are different.
Rigid tapping is the primary processing method because the tapping position does not change when tapping is repeated, making it difficult to produce a messy tooth. At the same time, the tapping speed can be taken into account so that the processing time can be significantly reduced. However, because the tool is fixed, the synchronization between the spindle and the tapping axis is more stringent to avoid the tool breaking if care is not taken. If internal threads are made by rigid tapping, it is necessary to pay attention to the synchronization error between the tapping axis and the spindle movement.
In the rigid tapping process, the spindle speed and the tapping axis feed speed need to be regulated and maintained in a specific ratio according to the required intercept distance. In this study, the Yeong Chin Machinery Industries Co. Ltd. NDV series machine tool and the FANUC 31iMA controller are used as the experimental machine (shown in Figure 1). The FANUC controller controls the tapping axis by following the spindle so that the synchronization error of the spindle and the tapping axis can be observed. The phenomenon of the tapping axis following the spindle is well understood; the larger the synchronization error, the higher the risk of machining accuracy, chipping, or tool breakage. Factors that affect the synchronization error include the time constant for acceleration and deceleration in rigid tap, the proportional gain of the rigid tapping speed ring, the motor excitation delay time, the rigid tapping speed loop integral gain, the position feedforward coefficient, and the tapping axis position gain. If these factors can be effectively adjusted, this can improve the quality of rigid tapping by reducing the synchronization error. Therefore, the parameter adjustment technology is crucial, and can enhance the machine tool technology in order to improve the added value of the machine tool industry and help lift the overall technology level of the industry. Therefore, a suitable model is needed to assist before exploring the parameters of the machine tool. If a suitable model can be found beforehand, it can effectively reduce the waste of consumables, so this study will explore this model using artificial neural networks. To find the hyperparameters of the neural-like network so that the model can fit the actual machine, this study will use the proposed RWOA to explore it.

Machine tool equipment used in this study.
Hyperparameter optimization for machine tool model using the proposed WOA
In order to collect data effectively and systematically on the synchronization error of machine tool rigid tapping, a uniform design29–31 was used for data collection. The data collected from the rigid tapping is not time-series, so the model is built using an artificial neural network. For efficient, systematic exploration of hyperparameter combinations for the model, this study will use the proposed RWOA for finding.
WOA was proposed by Mirjalili and Lewis 13 to explore optimal solution combinations in the solution space by mimicking humpback whale predation behavior. Each humpback whale, considered as a search agent, explores the optimal solution using three phases: the encircling prey phase, the exploitation phase (or bubble-net attacking method), and the exploration phase (or search for prey). One improvement in this paper is introducing a nonlinear time-varying inertia weight (NTIW) method so that the update is not fully learned but still retains some influence. The NTIW method updates weights according to the following equation:
where w is current inertia weight, wmin and wmax are the minimum and maximum of the inertia weight range, respectively, and in general, wmin = 0 and wmax = 2; t and tmax are the current and maximum numbers of function calls, respectively.
Since the NTIW method has been introduced, the update functions of the prey-encircling, exploitation, and exploration phases are modified as shown in equations (2)–(4):


where

where

When the whales enter the latter-search period, they gather in a particular solution space. In order to improve stability and accelerate the optimum finding, the other improvement in this study is to adopt adaptive Taguchi-based parameter exploration (ATPE). The ATPE method selects the whales obtained by the encircling prey phase as in equation (2) and obtained by the exploration phase, per equation (4), as the first and second levels in the orthogonal table (OT) constructed to explore the best solution for the combination, with the first-level (L1) and second-level (L2) functions defined as in equations (8) and (9):


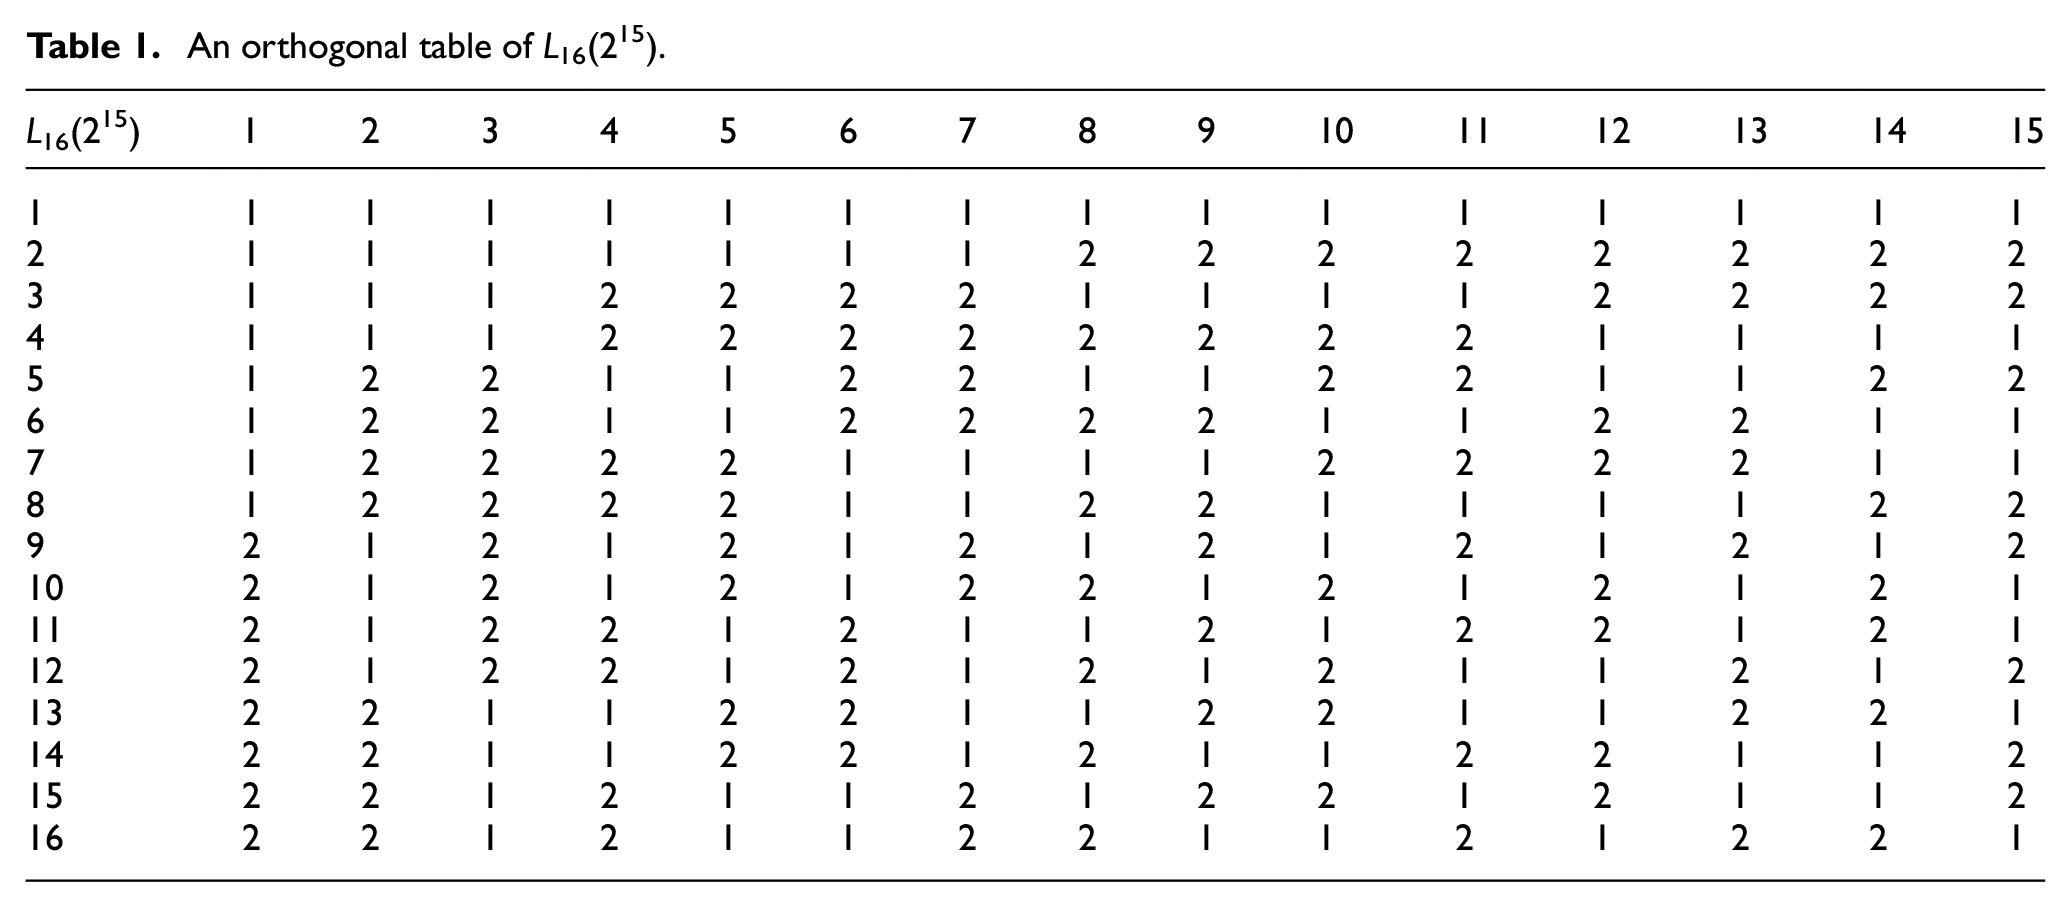
This study uses the two-level OT Ln(2n − 1) from the above discussion for the ATPE method, where n− 1 is the number of configurable parameters (column), n is the corresponding number of experiments (row), n = 2k where k is a positive integer greater than 1, and D is the number of variables (i.e. dimensions) to be configured, where D ≤ n − 1. In this example, the proposed RWOA with dimension D = 15 has fifteen variables for each of the two selected vector positions and can be configured using the L16(215) OT in Table 1, 32 where the fifteen variables of the two vector positions are configured in columns 1–15 according to their horizontal positions. For example, suppose E is the contribution (or parameter influence) level and pa1 and pa2 are the first and second levels of parameter pa, respectively; if Epa1 is smaller than Epa2 (Epa1 < Epa2), this means that the second level is the best level in the parameter pa; conversely if Epa1 is larger than Epa2 (Epa1 > Epa2), the first level is best. Finally, once the optimal levels of all parameters are determined, a new position vector is obtained. In the case of the proposed RWOA in this study, L1(t + 1) and L2(t + 1) are first identified and configured in an OT according to their variable positions, and each parameter is experimentally combined into a function or model to obtain the fitness value and calculate the response value to obtain the proposed RWOA position vector. However, since the OT is used to calculate the new best whale, there will be extra function call generation. For example, in the case of the L16(215) OT, 16 extra function calls will be generated. For the fairness of the calculation, the stopping condition is set to the number of function calls in this study. The proposed RWOA flowchart is shown in Figure 2. According to Figure 2, the detail steps of the proposed RWOA are as follows.
(1) Initialization: set the stop condition, the number of whales, the dimension, the boundary of each parameter, the activation point of the ATPE method, and the initial whales’ generation.
(2) Fitness calculation based according to the whales’ parameters.
(3) Activate the ATPE method if it reaches the activation point, that is, the latter-search stage start point; it can assume that 70%, 75%, 80%, 85%, 90%, and 95% of the maximum of the function calls.
(4) If the ATPE method doesn’t activate, then according to p and |A|, whales’ position update based on equations (2), (3), or (4).
(5) If the ATPE activates, a two-level OT is selected, and the parameters are put into this OT based on equations (8) and (9).
(6) Based on Steps (4) or (5), a current best whale is obtained.
(7) If the stop condition is not reached, go to Step (2).
An orthogonal table of L16(215).

The flowchart of the proposed RWOA.
This study develops a synchronization error model of rigid tapping for a machine tool, applying the proposed RWOA to explore the best combination of hyperparameters for the model via the following steps:
(1) Before experimenting, adjust the tool machine to ensure the dynamic response is good.
(2) Determine the tapping process factors and plan the experiment for data collection. It is known that the time constant for acceleration and deceleration in rigid tap (x1), the proportional gain of the rigid tapping speed ring (x2, unit: As), the motor excitation delay time (x3, unit: ms), the rigid tapping speed loop integral gain (x4, unit: ms), the position feedforward coefficient (x5, unit:0.01%), and the tapping axis position gain (x6, unit: 0.01 s−1) are the crucial factors affecting the primary tapping process.33–35 The ranges of these factors (x1–x6) are 320–640, 10–31, 300–400, 40–180, 5000–9900, and 3000–8000, respectively. In order to collect data effectively, this study adopted the uniform design29–31 with six factors, which is more in line with the needs of the industry than the full-factor experimental method.
(3) Use the artificial neural network to construct the model: The structure of the model defined in this study is shown in Figure 3. It consists of one input layer, two hidden layers (each hidden layer including batch normalization, activation function, and dropout), and one output layer. The explorable hyperparameters include the number of neurons in the hidden layer, the batch size, the maximum number of iterations, the dropout rate, and the learning rate.
(4) Use the proposed RWOA in this study to explore the optimal combination of hyperparameters of the model: The model structure described in Step 3 is used to model the simultaneous errors of rigid tapping, while the robust whale optimization algorithm is used to search for the optimal combination of hyperparameters.

Structure diagram of model constructed with artificial neural network.
Experimental results
Benchmark functions
For initial verification of the effectiveness of the proposed RWOA, the benchmark functions were tested; the functions used are shown in Table 2, where n is the dimension, s is the search space, and fmin is the global minimum. The benchmark functions include unimodal, multimodal, and fixed-dimensional multimodal functions to understand the ability of the proposed RWOA and WOA to solve the benchmark functions for different types. For each benchmark function, 30 independent runs were conducted to collect the best value, mean, and standard deviation (SD), and the t-distribution test was used to validate the significance. The parameters of the proposed RWOA and WOA are set as follows: the number of whales is 50 and the maximum function call value is 15,000. Since the proposed RWOA is used to improve WOA by using NTIW and ATPE methods, to understand the differences between them, this study will discuss them. In this study, 70%, 75%, 80%, 85%, 90%, and 95% of the maximum function call values were used as the activation points in order to understand which stage of ATPE is better to be activated in the latter stage.
Benchmark functions tested in this study.

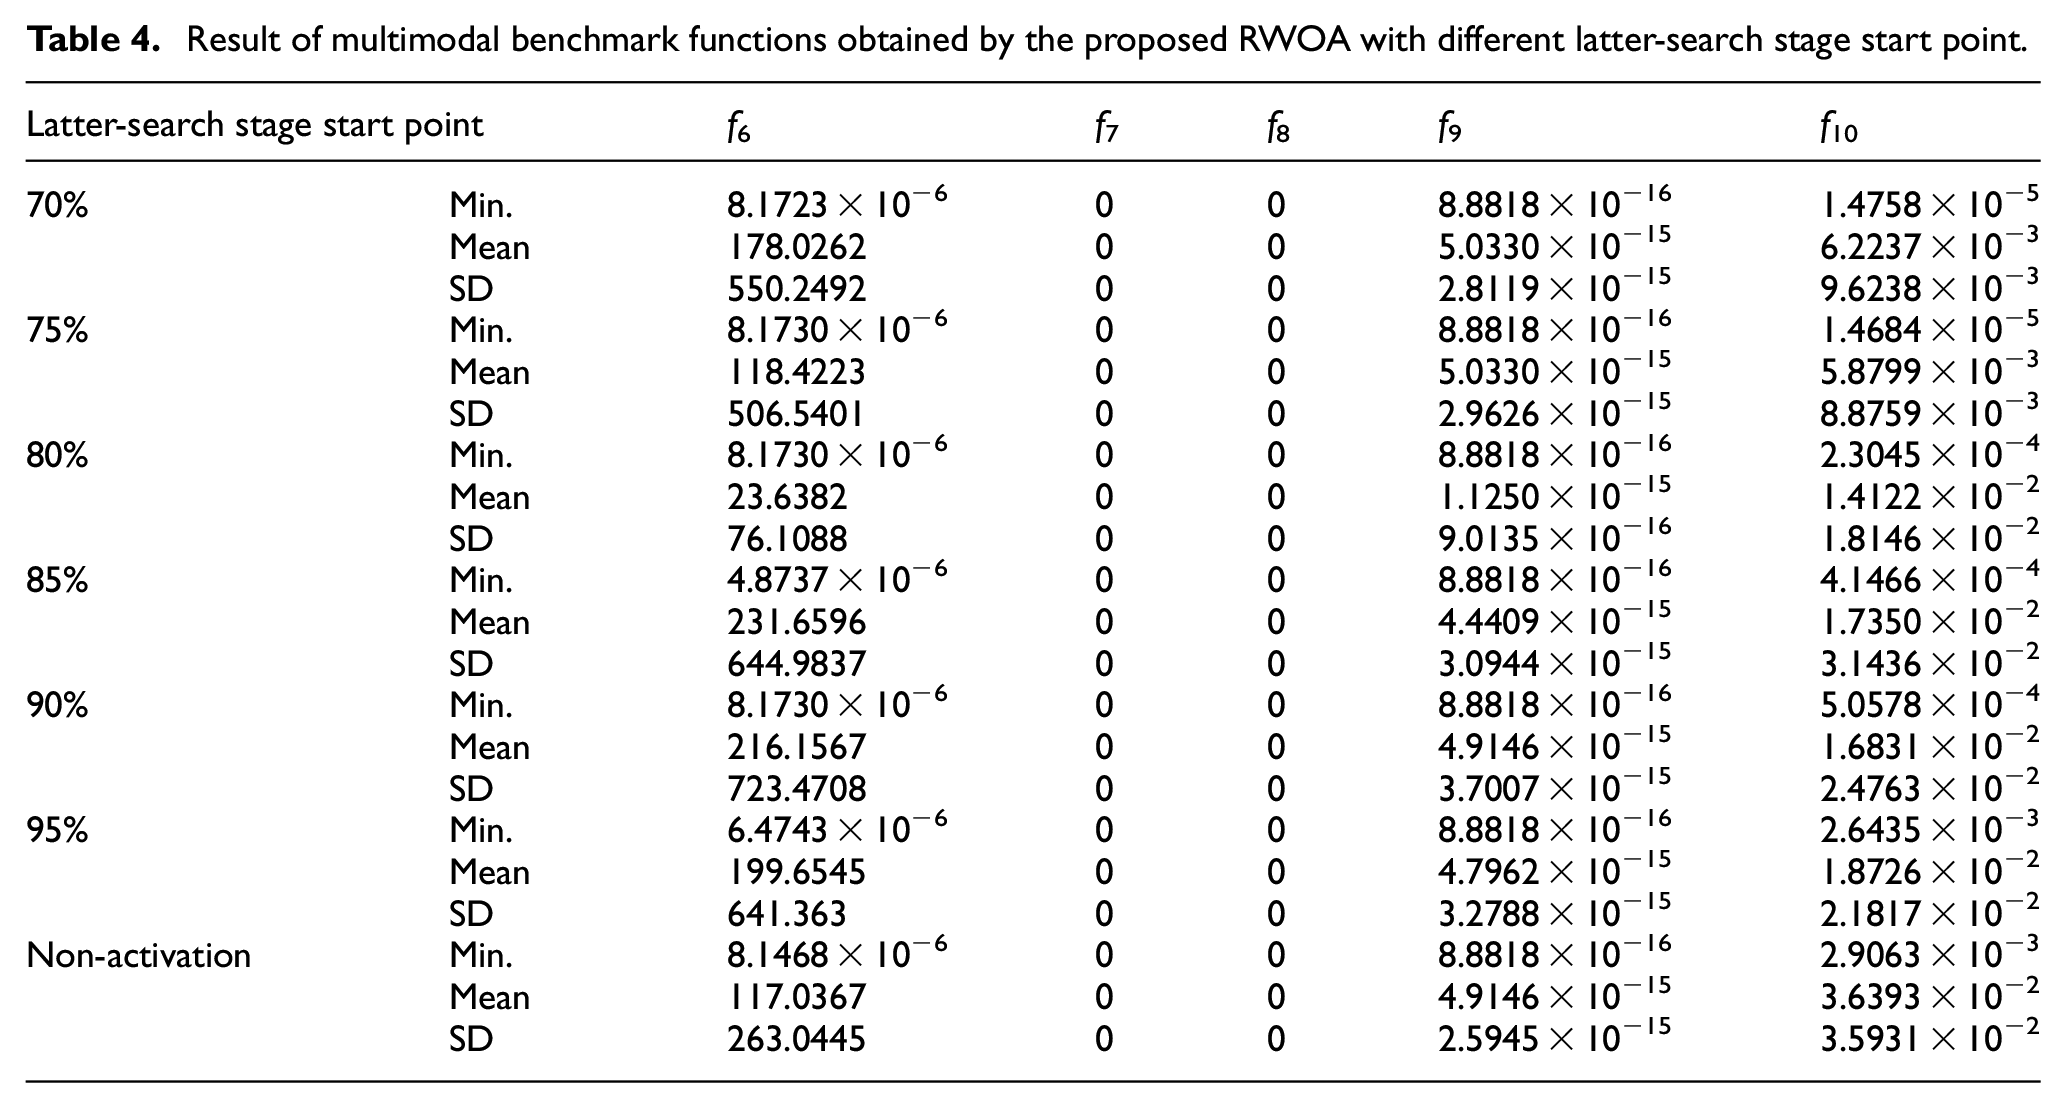
The experimental results for the unimodal, multimodal, and fixed-dimensional multimodal benchmark functions are shown in Tables 3 to 5, respectively. Table 3 shows that the ATPE method does not need to be enabled at f1 and f2 to obtain a better solution only using the NTIW method. In contrast, at f3, f4, and f5, the activation points of the ATPE method are enabled at 70%, 75%, and 90% of the maximum function calls to explore the best solution, respectively. From Table 4, the ATPE method is enabled at 80% and 80% of the maximum function calls for f6 and f9, respectively, to explore the best solution. In particular, in functions f7, and f8, the ATPE method is enabled at 70% to explore the optimal solution. In function f10, the ATPE method is enabled at 75%. Table 5 shows that in functions f11–f13, enabling the ATPE method at 70%, 70%, and 75% of the maximum function calls, respectively, leads to an optimal solution. The best solutions obtained by the proposed RWOA mentioned above and the results obtained by WOA were organized into Tables 6 to 8 for unimodal, multimodal, and fixed-dimension multimodal functions, respectively. Tables 6 to 8 used the t-distribution test to check the significant difference simultaneously.
Result of unimodal benchmark functions obtained by the proposed RWOA with different latter-search stage start point.

Result of multimodal benchmark functions obtained by the proposed RWOA with different latter-search stage start point.
Result of fixed-dimensional multimodal benchmark functions obtained by the proposed RWOA with different latter-search stage start point.

Comparison between the best value obtained by the proposed RWOA and the results obtained by WOA in unimodal benchmark functions.

Comparison between the best value obtained by the proposed RWOA and the results obtained by WOA in multimodal benchmark functions.

Comparison between the best value obtained by the proposed RWOA and the results obtained by WOA in fixed-dimensional multimodal benchmark functions.

Table 6 shows that regarding the p-value of the t-distribution test, the proposed RWOA performs significantly in f3–f5 but not in f1 and f2; however, the proposed RWOA explores more precise and robust solutions than WOA. Table 7 shows that among the five multimodal functions, the proposed RWOA performs significantly better than WOA regarding the p-value of the t-distribution test; the solutions explored by the proposed RWOA are better than WOA regarding the minimum, mean, and SD The results in Table 8 show that the results obtained by the proposed RWOA differ significantly compared to those obtained by WOA in terms of the p-value of the t-distribution test. In terms of mean and SD, the results obtained by the proposed RWOA is also better than WOA. Overall, the proposed RWOA has always received better results compared to WOA.
Hyperparameter optimization of synchronization error model for machine tool rigid tapping using the proposed RWOA
To construct an effective synchronization error model for the machine tool, this study used the uniform design29–31 to arrange and collect training and testing data; the collected contents were extracted, as shown in Tables 9 and 10.
Training data obtained by the U41(416) uniform layout.

Testing data obtained by the U19(196) uniform layout.
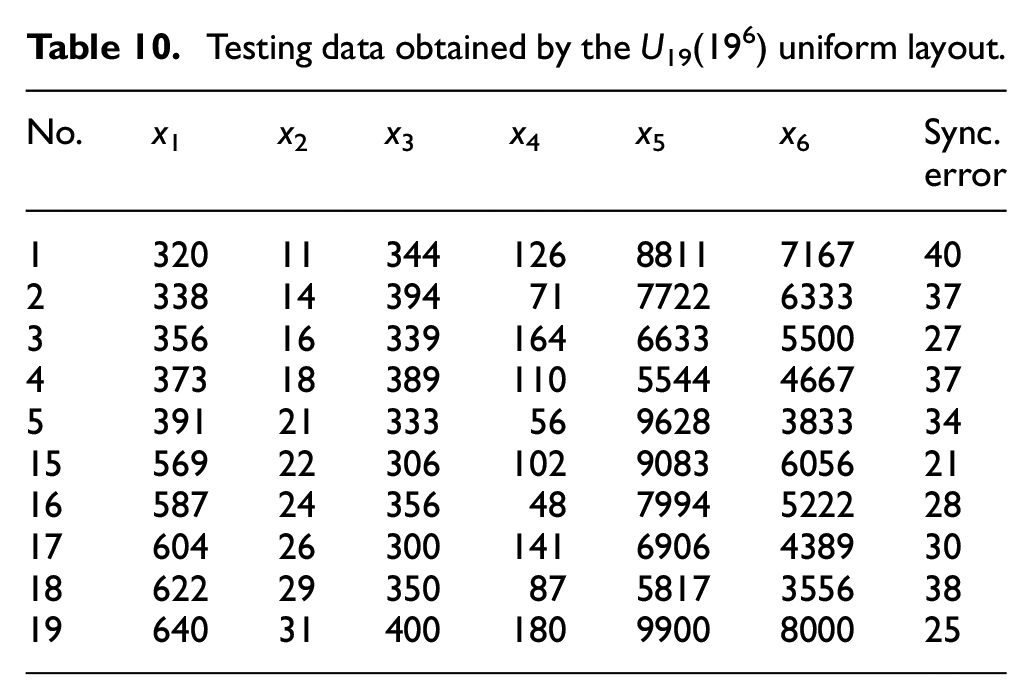
Tables 9 and 10 were generated from U41(416) and U19(196) uniform layouts, respectively. First, the data has a representative based on the characteristic of the uniform design, so these small amounts of data could be the representative data. Then, the factors that influenced the synchronization error for the machine tool include time constant for acceleration and deceleration in rigid tap (x1), the proportional gain of the rigid tapping speed ring (x2, unit: As), the motor excitation delay time (x3, unit: ms), the rigid tapping speed loop integral gain (x4, unit: ms), the position feedforward coefficient (x5, unit:0.01%), and the tapping axis position gain (x6, unit: 0.01 s−1) and their ranges are 320–640 (x1), 10–31 (x2), 300–400 (x3), 40–180 (x4), 5000–9900 (x5), and 3000–8000 (x6), respectively. Next, according to the experimental layout from U41(416) and U19(196) uniform layouts, the ranges of these factors were divided into levels. Then these levels were put into uniform layouts to obtain the experimental configurations. Last, the synchronization error from the actual machine tool could be received based on the experimental configurations.
In order to build a practical model, an artificial neural network (ANN) was then used to construct the model. The neural layers are defined first for effective exploration of each hyperparameter. The architecture framework of ANN is shown in Figure 3, including an input layer, two hidden layers, and an output layer, where the activation function is the sigmoid function, and the optimizer is Adam; in addition, the hyperparameter that must be tuned includes the number of neurons in the first hidden layer (the range is 10–100), the number of neurons in the second one (half of the first ones), the batch size (2, 4, 8, 16, and 32), the iterations (100–500), the dropout ratio (0–0.9), and the learning ratio (10−4–0.1). Because multiple attempts can obtain the hyperparameter combination, this study used the proposed RWOA to search for the best combination and figure out the best model. The parameters of the proposed RWOA are set as follows: the number of whales is 15, and the maximum function call value is 300.
From the hyperparameters explored by the proposed RWOA, the hyperparameter combination for the model is (35, 16, 141, 0.3, and 0.0788). The training data’s average MAPE (mean absolute percentage error) is 6.2454% with an SD of 0.5283%. The average MAPE of the testing data is 9.3501% with an SD of 0.9253% for the 30 times of modeling using this hyperparameter. For the best model from the 30 times, the MAPEs for training and testing data were 6.8384% and 6.7372%, respectively. To understand the difference between the model and practical machine tools, this study used U10(106) uniform layout to generate validation data. From the result shown in Table 11, the MAPE is 6.1723%, so this model can effectively predict the synchronization error. It can be seen that the model developed in this study is valid and close to the actual value from the machine tool.
Validation results between predictive model and the machine tool by using the U10(106) uniform layout.

Conclusion
This paper used the proposed RWOA method to explore the hyperparameters combination for machine tool synchronization error. Compared to WOA, the proposed RWOA has two improved strategies. The first improvement is integrating the NTIW method into the proposed RWOA by retaining the influence of the current or randomly selected whale appropriately without thoroughly learning them. Since the WOA concentrates on a specific solution space in the latter-search stage of the algorithm process, this study proposed the second improvement by using the ATPE method in the latter-search stage of the algorithm’s strategy to explore the suitable solution effectively. In the latter-search stage, the ATPE method can accelerate to search for the solution by using the Taguchi method. From the result of the benchmark functions, the performance obtained by the proposed RWOA is significantly improved than WOA. From the t-distribution test, the benchmark functions tested in this study, the results obtained by the proposed RWOA in most of them have significant performance, receive better fitness values, and are robust. To model for synchronization error of the machine tool rigid tapping, the results of the best hyperparameter combination show that the proposed RWOA method is more effective and systematic than the randomized exploration (manual adjustment) method and could obtain excellent model results. Based on the best hyperparameter combination for the model, the MAPEs in the training and testing data were 6.8384% and 6.7372%, respectively, indicating an excellent hyperparameter combination for the model obtained by the proposed RWOA. In addition, to verify the model’s practicality, this study compared the predicted value obtained by the model to the data obtained from the machine tool, and the MAPE is 6.1723%. Thus, it can be seen that the model built by this study can predict synchronization errors effectively. However, this study only discussed a synchronization error model for machine tools, but the machining time is also one of the critical observations. If the machining time can be considered and modeled simultaneously, the cost of processing can be estimated effectively and efficiently. The above discussion shows that the proposed RWOA method can improve performance and search for solutions effectively and efficiently.
Footnotes
Handling Editor: Chenhui Liang
Declaration of conflicting interests
The author(s) declared no potential conflicts of interest with respect to the research, authorship, and/or publication of this article.
Funding
The author(s) disclosed receipt of the following financial support for the research, authorship, and/or publication of this article: This work was supported in part by the Ministry of Science and Technology, Taiwan, R.O.C., under Grant Numbers MOST 110-2221-E-153-010 and MOST 111-2221-E-153-006.