
Abstract
The precise identification of faults is vital for ensuring the reliability of the bearing’s performance, and thus, the functionality of rotary machinery. The focus of our study is on the role that feature selection plays in improving the accuracy of predictive models used for diagnosis. The study combined the Standard Deviation (STD) parameter with the Random Forest (RF) classifier to select relevant features from vibration signals obtained from bearings operating under various conditions. We utilized three databases with different bearings’ health states operating under distinct conditions. The results of the study were promising, indicating that the proposed method was not only effective but also consistent, even under time-varying conditions.
Keywords
Introduction
In recent decades, machine learning (ML) has been extensively involved in fault detection and classification problems. 1 However, the robustness of the trained model depends essentially on the quality and the quantity of the input features. 2 Therefore the optimization step becomes of tremendous potential accurately determine the perilous conditions. 3
Feature selection (FS) arises as an essential step for the effectiveness of ML application, 4 the speed of the diagnosis process, 5 as well as for the enhancement of the predictive accuracy. 6
Feature selection techniques fall into three main classes. 7 The first class is the filter method, which uses statistical methods to rank the features, and then removes the elements under a determined threshold. 8 This class provides a fast and efficient selection. 6 The second class, called the wrapper class, treats the predictors as the unknown and the predictors’ performance as the objective function, 8 the problem is reduced to the search algorithm. 9 Many subsets are randomly selected and then evaluated by a classifier, and the one with the maximum accuracy is picked. 8 The wrapper class is better than the filter class in terms of performance and accuracy. However, for exhaustive searching algorithms, it becomes computationally expensive.8,10 The third type is the hybrid or embedded class. It is a combination of the advantages of both filter and wrapper classes. 11
Many feature selection methods are applied to the bearing fault diagnosis; provided good performances. In Peña et al., 4 the analysis of variance (ANOVA) is used as a filter method to rank the features based on their relevance, then select the subset that yields the best accuracy through cluster validation assessment. This method provides a good classification, but it has some limitations that can be found in any real data. For example, it requires the number of samples from all classes to be equal, 12 which, whether by accident or necessity, is not always met. ANOVA requires a tiny variance within samples of the same class to be efficient. 12 However, in some cases, such as in Imane et al., 13 the data used was collected under variable speed conditions, resulting in sparse samples of the same class. In addition to these constraints, ANOVA necessitates specific knowledge in order to interpret its results.
In Rajeswari et al., 14 they used particle swarm optimization (PSO) for the feature selection. In Ma et al., 15 ant colony optimization (ACO) performed the selection step. Both PSO and ACO added strength to the process of bearings’ diagnosis by discarding the redundant features and preserving the relevant ones for the model training. However, PSO suffers from dimensionality issues and the demand for numerous evaluations to attain accurate results. 16 While the ACO suffers from local optimization problems. 17 In Imane et al., 13 the cultural clan-based algorithm could select the relevant features efficiently within speed variability conditions and enhance classification accuracy. Yet its time complexities can represent a limitation for large datasets. 18 All listed algorithms belong to the wrapper class and ensure high accuracy. However, the trade-off between the high performance and the slow execution is inescapable. 2
In this paper, we propose a simple and efficient method for selecting the most relevant features to pave the way for a robust bearing diagnosis process. The idea came from the importance of the centroids to determine the classes. In our method, we aim to select the coordinates (the features) that cause the centroids spacing, and this can be verified by the standard deviation parameter, unlike ANOVA our method is based on the geometrical perspective and has no restrictions on the data in terms of quality or quantity. After ranking the coordinates of the centroids, random forest classifier (RF) selects the optimal subset that delivers the highest accuracy, to not rely on a distance-based classifier and ensures that the selected features are suitable for any classifier type.
The rest of the article is organized as follows: The second section describes our proposed method for using the SDT-RF selection method, and the third section represents the datasets used for testing as well as the results obtained. The final section serves as a general conclusion.
The proposed method
The flowchart in Figure 1 elucidates the method suggested for features selection used in the bearing diagnosis process. The following steps outline the proposed method.
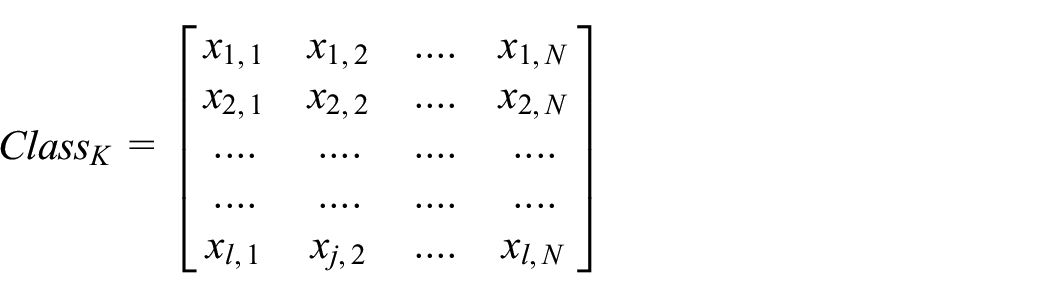
1. Determine the number of classes and their corresponding number of samples.
2. Calculate the centroid’s coordinates for each class.


Flowchart of the proposed method.
Where:
we expand equation (1) into:

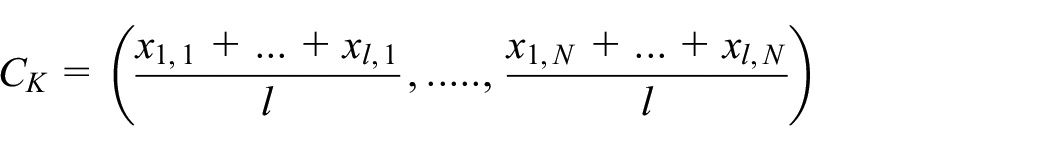

Then, the centroid’s coordinates are equal to the means of the corresponding class’s columns as shown in Figure 2.
3. Compute the standard deviation using equation (2) for each column of the centroids matrix.


The calculation of the centroids’ coordinates.
Where

And,

We obtain a vector

4. Sort the vector
5. Execute a sequential forward selection on the indices’ vector
‘start’ is the initial index for the sequential selection. It helps to preserve time by considering the indices from 1 to start highly significant features.

In our application, we set the coef = 5%, assuming that the first 5% are relevant features.
Target is initially equal to 100%, it is used as a termination criterion in the selection process. If the intended accuracy is not reached with less than half of the features, the Target is adjusted using equation (4) to provide the highest possible accuracy.

Experimental part
Datasets
In order to demonstrate the effectiveness of our suggested method, we conduct thorough experiments using three different databases The results of these experiments will provide valuable insights into the effectiveness of our proposed method and help us determine its potential.
Database 1
The database is called “Bearing vibration data collected under time-varying rotational speed,” it contains three bearing health states:
Healthy
Inner race defect
Outer race defect.
Operating under four rotational speed conditions to cover all possible cases of variations:
Increasing speed
Decreasing speed
Increasing then decreasing speed
Decreasing then increasing speed.
Figure 3 illustrates the data for the vibration signals that were collected while the speed varied continuously.

Vibration signals of inner race defected bearings collected under four speed conditions.
The bearing used is of type ER16K with pitch diameter equals 38.52 mm, and nine balls with diameters equal 7.9 mm. The data is collected at a sampling rate of 200,000 Hz for 10 s for each health state under the four operating speed conditions. Three trials are repeated for each case to ensure authenticity. 19
Database 2
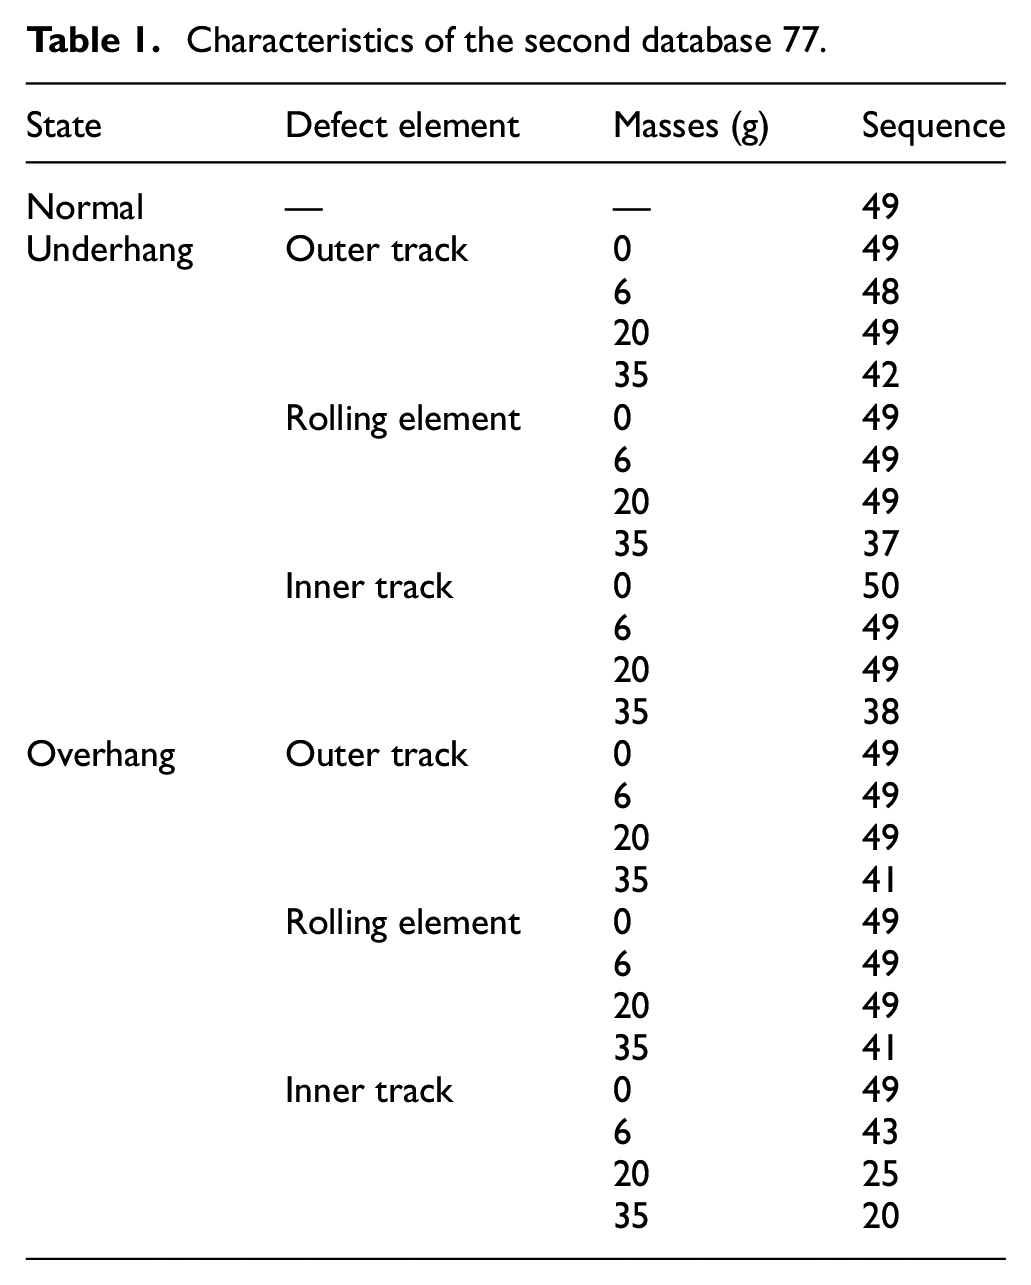
MaFaulDa (machinery fault data) is from a spectraQuest’s machinery fault simulator (MFS) Alignment-balance-vibration (ABVT). ABVT provides vibration signals along the three axes in addition to the acoustic signal for three faulty bearings with different defective parts (outer track, rolling element, inner track).
The table below resumes the sequences for each bearing separately in two distinct positions:
having the bearing between the rotor and the motor (underhang).
having the rotor between the bearing and the motor (overhang).
The bearing used is of eight balls with diameters equal to 7.145 mm. Sampling rate is 50 kHz, and each sequence takes 5 s while the operating frequency ranges from 737 to 3686 rpm with steps of approximately 60 rpm. Table 1 lists all masses used for the measurements besides the number of trials for each situation.
Characteristics of the second database 77.
Database 3
The data is from the Case Western Reserve University Bearing Data Center website. 21 It consists of vibration signals collected from the drive end bearing of type 6205-2RS JEM SKF, deep groove ball bearing with an inside diameter of 0.9843 in and an outside diameter of 2.0472 in. The data contains four health state:
Healthy
Outer race defect
Rolling element defect
Inner race defect.
The defects are of three fault degrees 7, 14, 21 mils.The sampling rate equals 48 kHz for motor speed varies from 1797 to 1730 rpm with steps of approximately 20 rpm.
Data preprocessing
The bearing diagnosis procedure consists of three major stages: signal decomposition and feature extraction, feature selection, and classification.
we start by processing the Data. For each dataset, we followed these steps:
Splitting the waveform of each case into segments based on the calculated period
Decomposing each segment using signal decomposition technique
Computing the features in Table 2 for each mode of the decomposed segment
Repeating the steps for all segments of the signal
Performing the same process for all cases
Preserving the order and number of samples of each state.
Table of extracted features.

The proposed STD-RF selection method is evaluated for its validity through a series of tests. These tests are conducted by using different signal decomposition techniques and classification methods. Moreover, the proposed STD-RF selection method is also compared to five strong optimization algorithms.
Results and discussions
On three datasets of rolling bearings collected under different conditions, we apply three signal processing techniques: Empirical Wavelet Transform (EWT), Empirical Mode Decomposition (EMD), and Maximal Overlap Discrete Wavelet Packet Transform (MODWPT). For the resulting signals, we compute the features listed in Table 2.
Then, we apply the STD-RF selection method to the obtained feature set. We consider the execution time, the number of features opted for, and the obtained accuracy.
We decompose the signal into 10 Amplitude Modulation-Frequency Modulation (AM-FM) modes for the EWT technique.
The number of intrinsic modes functions (IMF) for the EMD technique varies between 12 and 16 for the three databases. We choose 16 as the maximum value to adjust the features matrix without losing any information.
For the three datasets, the MODWPT technique extracts 16 terminal nodes.
Tables 3 to 5 present the features selected by the STD-RF method for three databases processed by EWT, EMD and MODWPT, respectively.
Depicting the performance of the STD-RF algorithm with EWT.

Table depicting the performance of the STD-RF algorithm with EMD.

Table depicting the performance of the STD-RF algorithm with MODWPT.
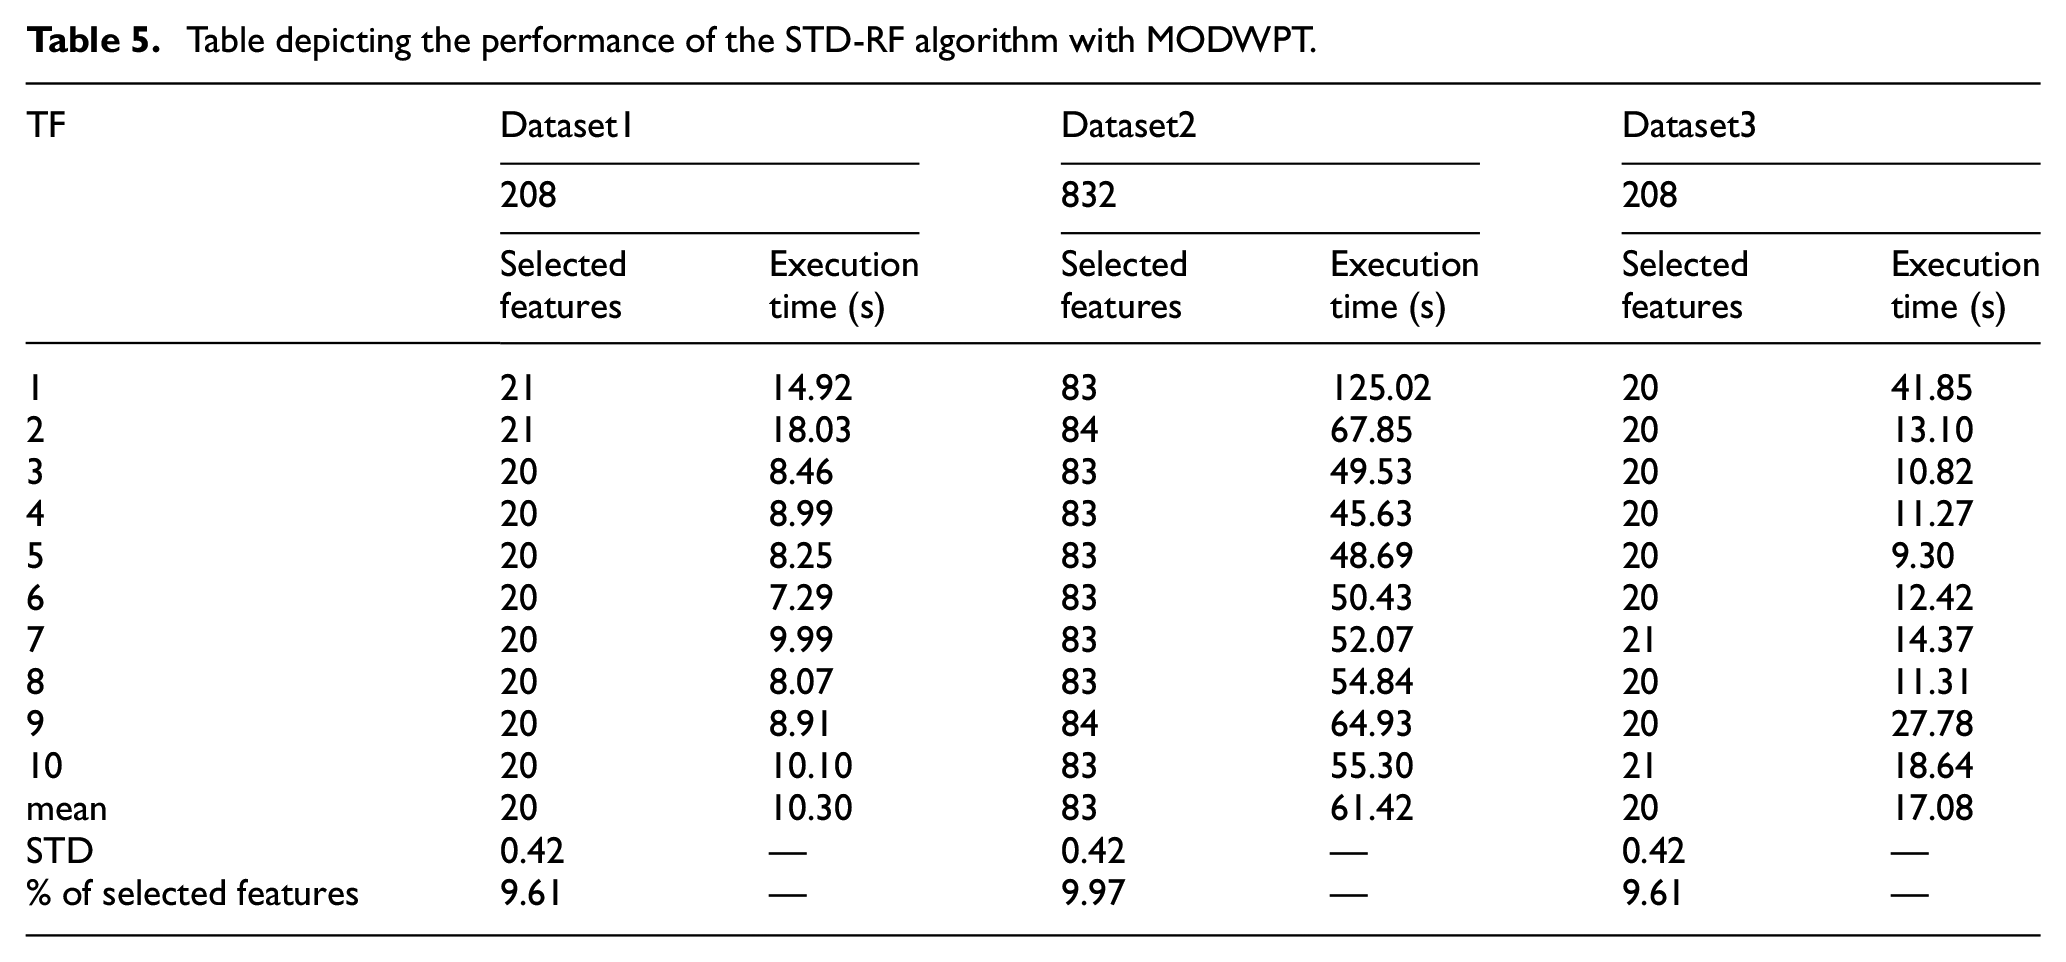
The tables contain the results of 10 simulations using the STD-RF selection method and the execution time for each case. As we can see, our proposed method could reduce the sets of features to less than 15% using the EWT, less than 16% using EMD and less than 10% while using MODWPT and hence help to boost the diagnosis process speed.
From Tables 3 to 5, we observe that the STD-RF’s results remain in the same scope despite the signal decomposition technique tool involved in the data processing. Also, the number of selected features for the 10 simulations affirms the stability of our method in both quantity and quality terms because of the features’ ordering at the beginning of the process.
Selection techniques comparison
We put our method in a comparison with five robust optimization algorithms in bearing diagnosis field. Our method was compared to squirrel search algorithm, 21 gray wolf optimization algorithm, 22 binary coded differential evolution (BDE), Grasshopper optimization algorithm (GOA), 23 and simulated annealing (SA). 24
Table 6 demonstrates that the STD-RF selection method exhibits superior performance compared to the other algorithms with respect to both accuracy and the number of selected features. Additionally, the table reveals that for the same dataset, if n simulations yield the same number of selected features, this implies that the n sets are identical, as the vector of indices
Number of features selected and accuracies obtained by different optimization algorithms.
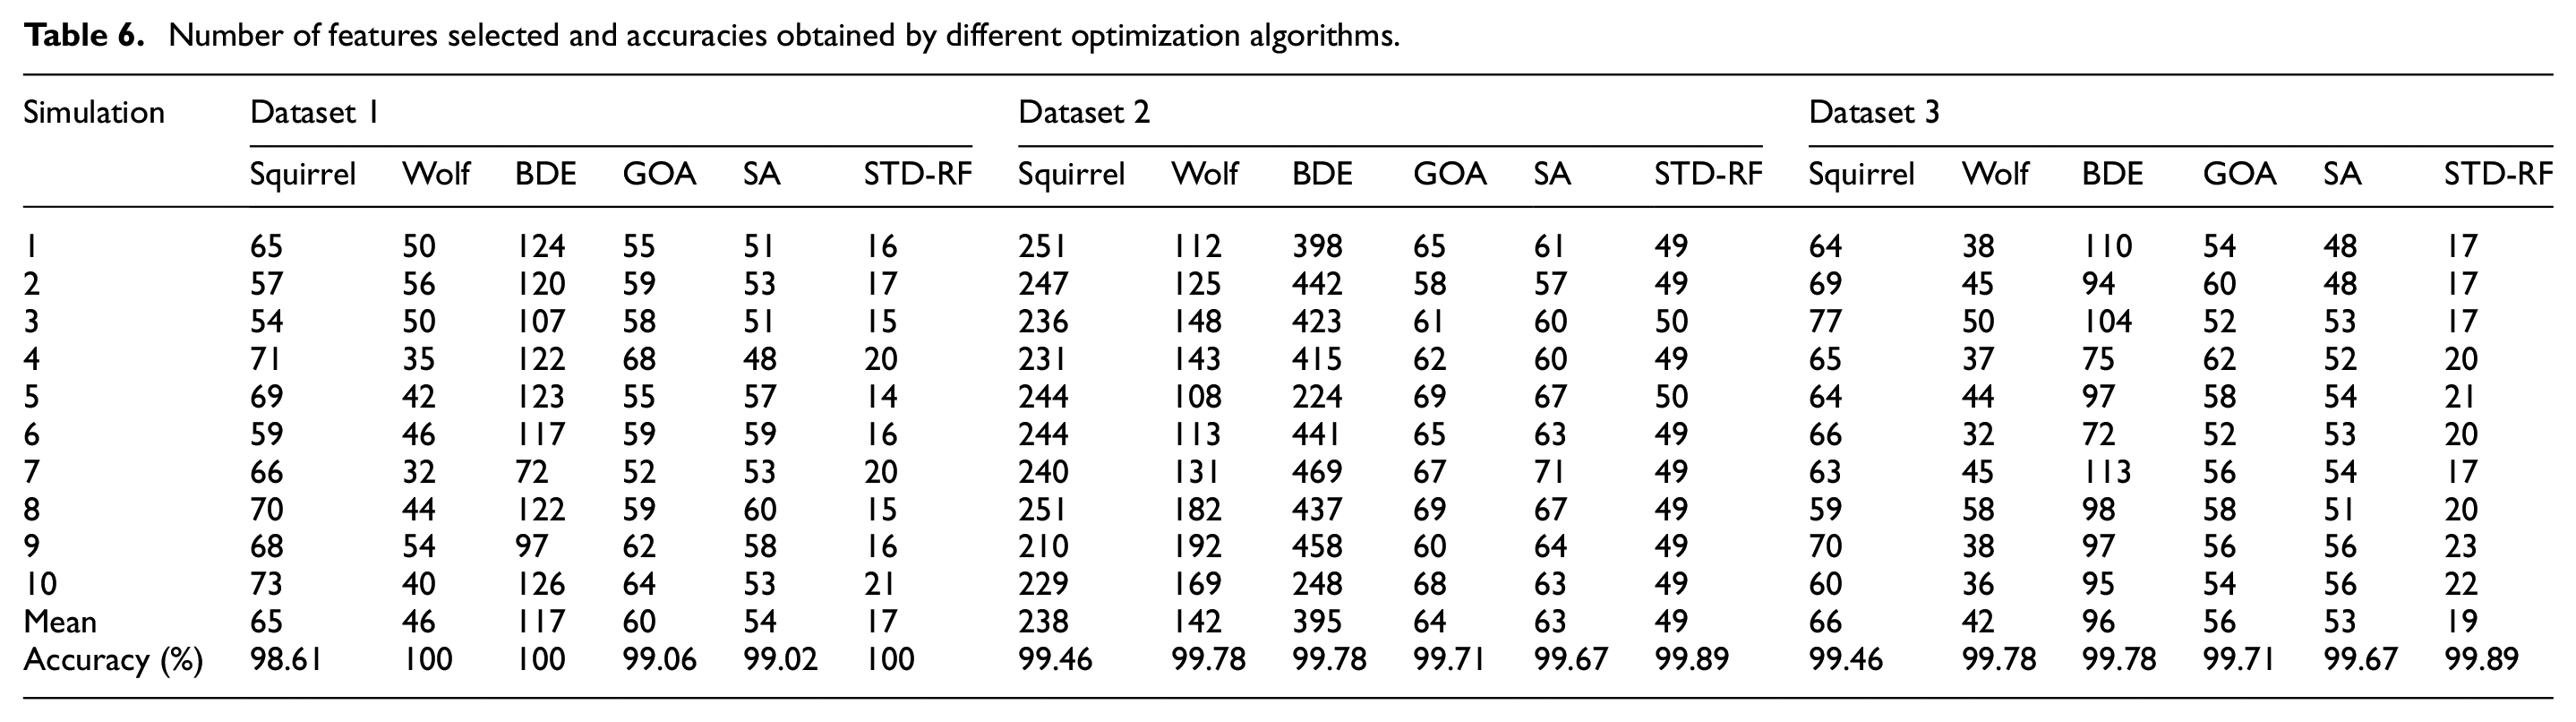
Figure 4 provides a clear representation of the power of our proposed method in feature selection using the first dataset processed by the EWT technique. It reduces number of parameters involved in the classification process to just 12% without affecting the classification’s accuracy.

pie chart depicting the percentages of the selected features by different optimization algorithms.
The accuracies listed in Table 6 were assessed using the RF classifier,we have tested our proposed method using the holdout cross validation and we repeated it 10 times as an explicit 10-fold cross validation to detect any hidden variance between the 10-folds, and this because the k-fold cross validation provides the average of the k simulations without giving an idea about the stability of the system. We spilt the data randomly into 80:20 to have larger amount of data for testing, and we repeated the process for 10 times then we calculated both the average and the STD.
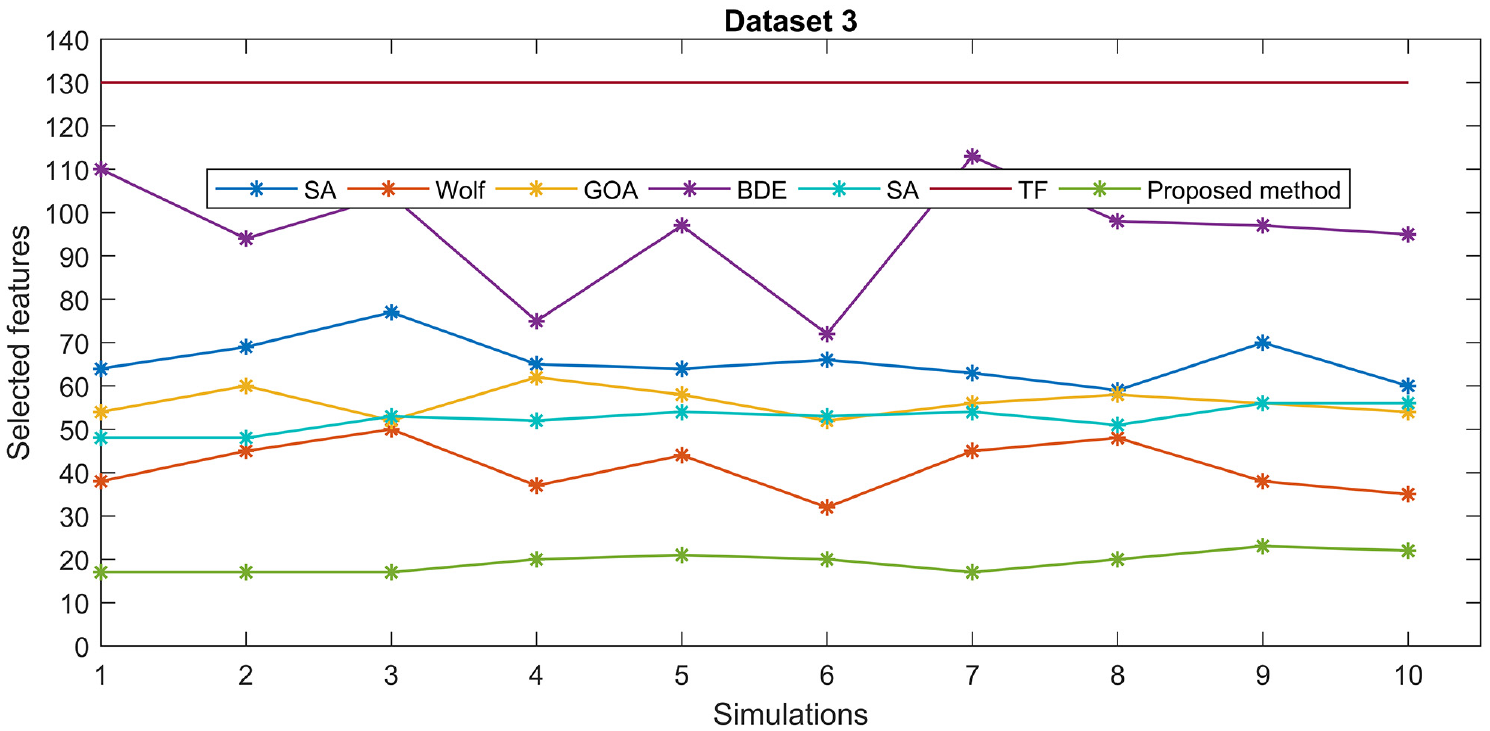
Figures 5 to 7 illustrate clearly the strength of our proposed method in reducing the size of the features set compared to the total features(TF) and the outputs of strong optimization algorithms as the squirrel, gray wolf, BDE, and others, without affecting the accuracy of classification as seen in Table 6.

Comparison graph illustrating the number of selected features by different optimization methods for the first dataset.

Comparison graph illustrating the number of selected features by different optimization methods for the second dataset.

Comparison graph illustrating the number of selected features by different optimization methods for the third dataset.
The accuracy of fault diagnosis can be notably enhanced by utilizing feature ranking. 25 The Figure 8 represents a histogram, which illustrates the selected features in the three datasets processed by EWT. These features are arranged in a particular order that corresponds to their importance, which is determined based on their standard deviation (STD). The histogram provides a visual depiction of the distribution of the selected features and their relative significance.
STD values of the selected features for the three databases processed by EWT.
Classifiers
To determine the effectiveness of our feature selection method, we perform a thorough evaluation by testing its output with five well-established classifiers. These classifiers include K-Nearest Neighbors, Random Forest, Least-Squares Support Vector Machines, Decision Tree, and Extra-Trees. This evaluation is crucial in verifying the accuracy of the selected features and ensuring that they are capable of providing reliable results when used in the diagnosis of bearings.
Table 7 summarizes the evaluation results of the selected features by the STD-RF method from the three databases processed with the Empirical Wavelet Transform and decomposed into 10 modes.
Classification results of different classifiers using the selected features from the three databases.

The obtained accuracies are very promising even with a relatively weak classifier as the Decision tree, where the mean accuracies for the three cases are 98.25%, 98.63%, and 95.64% respectively. For KNN, the accuracy approaches 100% while the rest of the classifiers could reach 100%.
Also, we notice the role of our method to retain the system’s stability, where the maximum value of the STD is lower than 0.98, which is a low value and determines the robustness of the fault classification.
Conclusion
The diagnosis of bearings has gained a lot of attention due to the potential harm caused by faulty bearings. However, the accuracy of the diagnosis relies heavily on the quality of the input features used by the classifier. This is where the feature selection method comes into play. In this article, we propose an STD-RF-based feature selection method with a high ability to extract the blurred discriminative parameters for the diagnosis. We tested the selection method on three distinct databases, processed by empirical wavelet transform, empirical mode decomposition, and maximal overlap discrete wavelet packet transform. We assessed the opted set of parameters by many classifiers, such as KNN, RF, LSSVM, and others. The obtained results demonstrate the high performance of our proposed method regardless of both the signal processing technique and classifier adopted. Compared to a bunch of robust optimization techniques, the STD-RF method outperforms them in terms of accuracy, execution time, and the number of features selected. The results reveal the ability of the STD-RF-based selection method to control the time variability issue and to ensure the stability of the predictive system.
Footnotes
Appendix
Handling Editor: Chenhui Liang
Declaration of conflicting interests
The author(s) declared no potential conflicts of interest with respect to the research, authorship, and/or publication of this article.
Funding
The author(s) received no financial support for the research, authorship, and/or publication of this article.