
Abstract
Researchers are increasingly coming up with creative solutions to reduce fuel consumption and harmful emissions due to the political unrest around crude oil and harsher environmental legislation around the globe. Using gasoline and ethanol blends as substitutes in SI engines is thought to be a promising approach. To lower the cost of experimental test, it is still necessary to provide a model to explore the emissions, performance and combustion of ethanol mixtures in petrol engine under various operating situations. A comprehensive quasi dimensional two zone model was used. This mathematical model could predict and analyze the engine combustion, emissions and performance parameters using MATLAB. The thermal efficiency was improved for E20 by 3%. Ethanol addition decreased SFC value by average 7.2% for E20 with respect to gasoline. In comparison to gasoline, the increases in output power were 1.1%, 3%, 4%, and 5.5% are obtained with E5, E10, E15, and E20. and 45% The highest increases in peak cylinder pressure and cylinder temperature for E20 about gasoline are 14 and 11%, respectively about gasoline. At 2500 rpm, the greatest percentage declines in NOx, CO, and HC emissions for E20 are 3.3, 23.5 and 45% about gasoline. The results of comparing the mathematical model’s validity to those acquired from experimental data and diesel RK software demonstrate that the MATLAB code is appropriate. The mathematical model proved that ethanol blending can be used up to 20% as alternative fuels to improve the gasoline engine performance, combustion and emissions.
Introduction
Spark ignition engine models estimate the engine’s combustion, performance and emissions without the need for testing that saves time and money. Modeling uses mathematical equations to explain physical occurrences while making acceptable assumptions and solving them to gain a deep understanding of the phenomenon. As zero, quasi, and multi-dimensional models, the various engine combustion models can be divided into three types. 1 The simplest and best models study how empirical changes in engine operating parameters affect cylinder pressure and heat release rates are zero-dimensional models. Single, two, and multi zone models are subcategories of dimensional models. In single zone models, it is assumed that the working fluid is a thermodynamic system that exchanges energy and/or mass with the environment. Alternative fuels can be used as substitute fuels, as well as blends of those fuels with gasoline. At engine speed variation, compression ratios, and equivalence ratios, the engine performance running on ethanol and gasoline mixtures was examined. 1 The thermal efficiency, output power and fuel consumption were increased when the ethanol is blended with unleaded gasoline, while the specific fuel consumption was declined. CO2 concentration was increased but HC and CO emissions were decreased. Petrol fuel blend with a volume percentage of 20% ethanol produced the improved performance and decreased emissions. 2
Alcohols are oxygenated, have high octane number and high latent heat of vaporization. Alcohol-gasoline mixtures are used in petrol engines as substitute fuels to reduce knocking. 3 Engine performance and emissions are influenced by the energy content and C / H ratio. Using ethanol instead of gasoline was proven to boost the engine thermal efficiency, produces less nitric oxide and carbon monoxide concentrations. 4 All blending fuels showed noticeable rise in octane number, however they have lower calorific value about gasoline. While E40 mixture’s thermal efficiency increased by 25.8%, its maximum specific fuel consumption reduction over gasoline was 17.21%. The highest decrease of CO emission for E30 was 26.33%. The maximum declines in HC and NOx emissions were 31.05 and 20.91% for E40, respectively. 5 Higher thermal efficiency is shown for hydrous ethanol about ethanol addition to gasoline. E10W produced lower NOx and HC concentrations but the CO emission was greater than E20W. 6 Exhaust emissions and engine performance were predicted using Artificial Neural Network (ANN) at different percentages of alcohol. The accuracy of the proposed model was evaluated. 7 When ethanol and petrol fuels were mixed, the vapor pressure was increased. The water solubility was increased with the content increase of ethanol. Bioethanol can be added up to 5 vol.% as a good cosolvent. Bioethanol addition decreased the vapor pressure and temperature of phase separation. 8
Ethanol is a substitute fuel for SI engines because of its higher heat of evaporation and higher oxygen content, which improve engine performance and emissions. 9 HC emission was increased with the decrease percentage of fuel injection distribution, but NOX emission was declined. 10 The highest brake thermal efficiency was shown at 1.3 equivalence ratio for gasoline and ethanol blends and higher than gasoline. HC emission was decreased from 4 to 2.3 g/kWh and NOx emission was decreased from 9 to 4 g/kWh for ethanol using. 11 The ignition timing of maximum torque in ethanol burning is smaller than gasoline. Carbon monoxide and hydrocarbon emissions reach the decreased value at G25 but NOx was increased.12,13 Hydrous ethanol reduced the maximum cylinder pressure while extending the time for flame development and propagation. 14 Ethanol addition to gasoline produced the lowest CO, CO2 emissions and output power about gasoline. Higher volumetric efficiency was shown for gasoline-ethanol blends. 15 Engine torque of E20 was enhanced by 1.87% but the engine power was increased by 2.02% compared to petrol. Related to pure gasoline, SFC was increased by 5.02%. Carbon monoxide and hydrocarbon concentrations of E20 were decreased about gasoline but CO2 and NOx emissions were increased. 16 Combined injection of ethanol and gasoline under lean burn condition was shown. 17 The decrease of NOx emissions was employed by hydrous ethanol-gasoline mixtures. The engine’s thermal efficiency was enhanced, and NOx emissions were declined, by adding recommended ratio of 4% water to the gasoline-hydrous mixture. 18 The increase of TE was 4.39% and the decrease in specific fuel consumption was 2.27% about gasoline for E15. The decreases in CO and HC emissions were 17.2 and 16% than gasoline. NOx emission was higher than gasoline for E15. 19
CO and HC concentrations were declined by 80% and 50%, respectively, when ethanol-gasoline mixtures were utilized, but the CO2 emission was increased by 20% about gasoline.20,21 The considerable reduction in SFC was about 15% for E40 than gasoline but the highest improvement in TE was 14.5% for E60. The peak decline in hydrocarbon emission for E60 was 16.45% about gasoline.22,23 The ignition timing was advanced as the ethanol ratio rose. The addition of ethanol decreased the thermal efficiency because the engine was run at the same spark timing as gasoline. 24 Using gasoline with ethanol blending of E5, E10 and E20 leads to the increments in output power as 2.31%, 2.77%, and 4.16% compared to gasoline. 25 When ethanol percentages of 20%, 25%, 30%, 75%, and 100% were used, the brake specific fuel consumption rose by 5.17%, 10%, 20%, 37%, and 56%, respectively. 26 Ethanol and gasoline blends in the proportions of 10%, 15%, 20%, and 25% were used. The mixing of ethanol led to the increase of in heat release rate and cylinder pressure. Volumetric efficiency was increased by adding ethanol from15 and 25%. The highest TE was 28.33% for E25 but 26.41% about gasoline. The maximum adiabatic flame temperature, oxygen percentage, timing of injection, and fuel characteristics of E25 contribute to higher NOx emissions.27,28 Due to ethanol’s lower calorific value (27,000 kJ/kg) compared to gasoline’s higher calorific value (44,300 kJ/kg), ethanol has higher fuel consumption. Ethanol ratio increase leads to the fuel specific fuel consumption increase.29–31 The maximum thermal efficiency was 28.33% for blending with 15% ethanol. Increased proportion of ethanol resulted in the increase of CO2 and NOx emissions. Blending gasoline with 15% ethanol has the lowest HC emissions. 32 Double-Wiebe function can determine the MFB profile and characterize the combustion.33,34 Due to their increased knock resistance, alcohol mixtures could be introduced to help alleviate knock concerns. 35 In comparison to pure gasoline, the blends of 5%, 10%, and 15% methanol showed decreased emissions and knock. Richer blends had higher NOx emissions than regular gasoline. 36 The largest reduction in emissions was predicted for E10 fuel. 37 When employing alcohol-gasoline blends, combustion efficiency has been increased, which results in decreases in HC and CO emissions. 38 Blending of sugarcane and corn based ethanol is effective method for achieving the lower CO2 emission. 39
Difficulties including greater viscosity, less calorific value, and greater NOx emission pose a significant obstacle for using biodiesel. Diesel is combined with 20% pine oil, 10% EGR and 10 ml of a 1, 4-dioxane additive are added. The use of pine oil greatly reduced the emissions of CO, HC, and smoke (15.94%, 17.04%, and 2.47%, respectively). This reductions were improved (32.61%, 28.15%, and 4.36%, respectively by using 10 ml of 1, 4, dioxane. NOx emission was greatly decreased by 11.53%) using 10% EGR. 40 Performance was negatively impacted by an increase in plastic oil, especially at 40% addition. Methanol and diethyl ether (DEE) were added to P40 mixture. Brake thermal efficiency was increased by 31.25%, and the levels of hydrocarbons, nitrogen oxides, carbon monoxide, and smoke were reduced by 2.3, 20.28, and 34.61 g/h at full load, respectively. A maximum of 40% of plastic oil can be utilized, and the negative consequences of using plastic oil can be minimized by using methanol and a diethyl ether additive. 41 Biodiesel was made from used orange peels and mixed with diesel oil in 25%–50% by volume. In the intake manifold, water electrolysis produced at a rate of 2 LPM hydroxy gas (HHO). When compared to diesel oil at full load, the increase in brake thermal efficiency is 1.54%, and the decrease in fuel consumption is 11.1%. CO, smoke, and HC emissions were reduced by 17.6%, 29.5%, and 12.1%, respectively. NOx emission was increased by 9.67%. 42 The ideal values of 2% of di tert-butyl peroxide (DTBP) and 150 ppm of rice husk were chosen. The best additive ratio for lemon peel oil produced 30.69% BTE, 4.7% less than diesel fuel. Combination of rice husk and DTBP, NOx emissions rise by 17.3%. Along with the intake air, 2% of water was fed into the intake manifold. Reduced BTE value of 8.9% indicates that 2% water influences other outputs and reduces NOx emission by 11%. 43
There are several papers studied the effect of ethanol addition in gasoline engines. This paper covers the gab by investigation of ethanol blending with ethanol in mathematical model describing the combustion, performance and emissions of petrol engine. Improved ignition advance and compression ratio leads to the enhancement in engine performance with low rate up to 20%. It is more economical and easy engine run in cold start to use these lower values of ethanol. Low ethanol ratios can be utilized without the requirement for engine modification. Improved physical properties encourage the addition of ethanol in petrol engines. The simulation study reduces the cost applied in experimental tests. The current work’s goal is to create quasi dimensional and two-zone thermodynamic mathematical model to simulate the spark-ignition engine’s combustion process. The first law of thermodynamics, equations of energy, mass conservation, equation of state, and mass fraction burned were used to construct the model using the computer’s MATLAB software, taking into account both gasoline and ethanol mixtures at different engine speeds. Because of its higher heat of evaporation and higher oxygen content, which enhance engine performance and emissions, ethanol is an alternative fuel for SI engines. The oxygen content in ethanol improves the combustion efficiency and reduces the exhaust emissions. The models predict engine performance as well as combustion and emission characteristics using ethanol and gasoline mixtures at different engine speeds. The model is tested against experimental data from literature, anticipated simulation results from Diesel-RK software, and simulation results from literature. The mathematical model was compared with the experimental literature work and was validated and accepted.
Engine combustion modeling
For the four-stroke cycle of SI engine running on gasoline, ethanol, and their mixtures, a quasi-dimensional, two-zone model for the combustion was built in the current work. The working fluid is separated into unburned and burned zones. The cylinder walls serve as the shared environment for these zones, which are actually two distinct thermodynamic systems with interactions in terms of mass and energy. 1 The fuel mass-burning rate is then calculated numerically by resolving the first law of thermodynamics for the two zones. The model had been utilized to forecast the in-cylinder pressure related to the crank angle. The unburned zone is premixed fuel-air mixture, and the two zones are perfect gases with different properties. The gas constant of the mixture in the burned and unburned zones is constant. 33 The burned zone does not transfer heat to the unburned and vice versa. Enthalpy related to fuel injection is typically insignificant and is therefore disregarded. Losses from crevices could be substantial but are not counted. The instantaneous pressure in the two zones is the same because the flame is a deflagration combustion wave. The transfer work from the unburned zone to the burned zone is neglected. 35
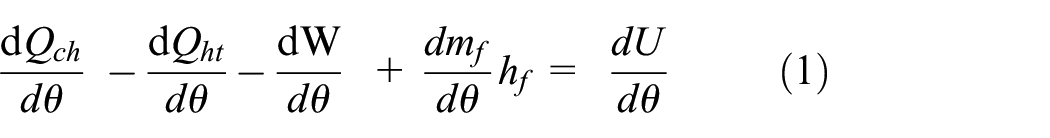
Applying the First Law of Thermodynamics 1 :
Where:
The crank angle is used to express the energy rate. The working fluid sum internal energy change and the work transfer can be represented as follows 33 using only P and V:

Where:
m: In-cylinder total mass of gases in kg.
From the ideal gas equation,

Where:
R: Cylinder gases constant in kJ/kg. K

However, assuming that the gas constant stays fixed and the mass in the control volume stays constant (while disregarding crevice losses and the amount of fuel injected) we obtain:


Rearranging and simplifying,

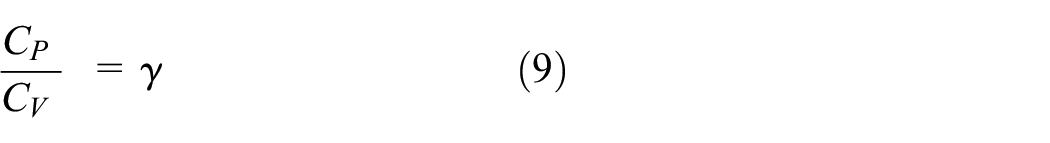
Now for an ideal gas,

Where:
γ: Specific heats ratio.


Where:
The conservation of mass is calculated as:

Where:
m: Total charge mass

Since the combined volume of the burned and unburned zones makes up the entire cylinder charge at any one time.

Where:
V: The charge total volume inside the cylinder,


The energy terms with crank angle, for unburned zone.


Equations (10)–(14) and are the model governing equations (16) and (17). The parameters Tu, Tb, Vu, Vb, mu, mb, and heat release rate are derived from the cylinder pressure P and total volume V, these equations are simultaneously solved for each crank angle (time). 35
Fuel and engine characteristics
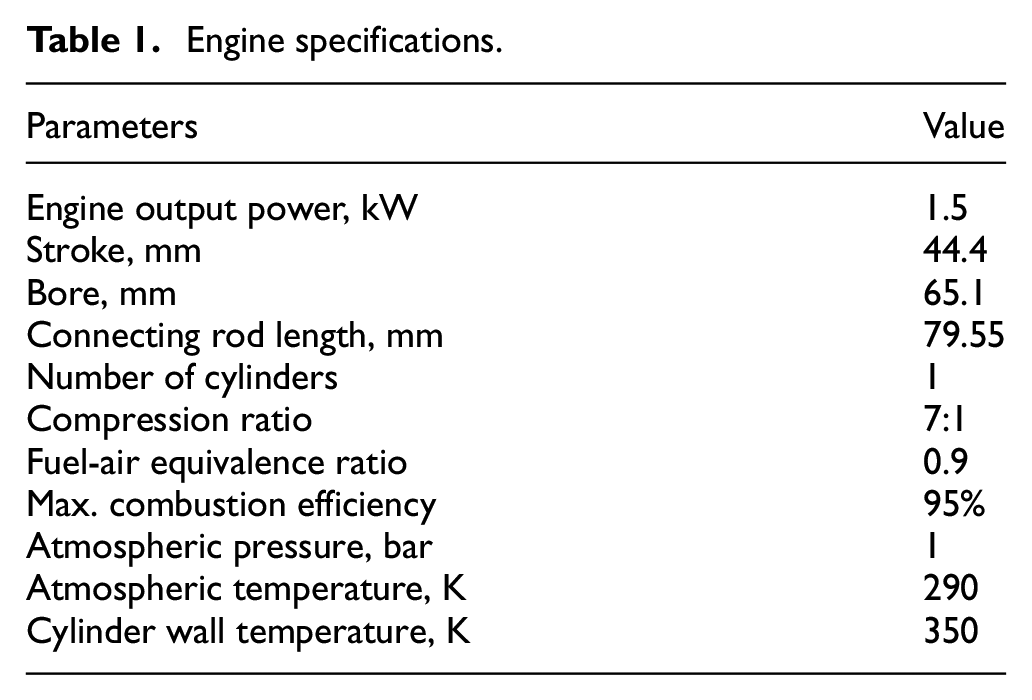
The used petrol engine specifications in mathematical modeling were described in Table 1. The fuel characteristics of ethanol-gasoline blend fuels were evaluated using the ASTM standards. Unleaded gasoline of 95 octane number was chosen and combined with various concentrations of ethanol (99.9% pure). Ethanol is indicated by the letter “E,” and the following number to it indicates the ratio % of ethanol. E10 designation denotes a volumetric combination of 90% pure gasoline and 10% ethanol (99.9% purity). All of the attributes of the fuel blends are altered as ethanol is added to gasoline. Gasoline and ethanol blends were used with percentages of 5%, 10%, 15%, and 20% by volume as E5, E10, E15 and E20. Table 2 demonstrates the impact of ethanol addition on density, viscosity, distillation temperature, and octane number (RON).
Engine specifications.
Gasoline and ethanol blends characteristics.

Results and discussion
Influence of ethanol mixing on engine performance
MATLAB program was used to simulate the combustion in petrol engine at spark timing of 35 BTDC and stoichiometric fuel- air mixture projected the impact of ethanol on engine performance, emissions, and combustion characteristics as a function of engine speeds from 2000 to 2800 rpm at various percentages of ethanol as E5, E10, E15, and E20.
Effect of ethanol ratio on indicated output power
Figure 1 shows the influence of ethanol introduction on output power at different engine speeds from 2000 to 2800 rpm. Output power also marginally was raised as the ethanol content of the mixture rises. The engine power was increased related to the engine speed due to the fuel consumption increase. The greater flame speed of ethanol about gasoline allows the more fuel and burned effectively, which increases the output power, torque, and mean effective pressure. The output power improvements were 1.18, 2.6, 4, and 5.5% are shown with E5, E10, E15, and E20 fuels, respectively at 2500 rpm engine speed about gasoline.

Output power versus engine speed range at gasoline and ethanol blends variation.
Effect of ethanol ratio on indicated output torque
Figure 2 depicts the influence of ethanol addition on torque for ethanol-gasoline blends at various engine speeds. In spark ignition on engines, the octane number is a critical component impacting on engine performance. Because the latent heat of the mixed fuel is greater than the heat of evaporation, the air-fuel mixing was improved, which boosts the engine’s output power. Gasoline-ethanol mixtures had higher output power and torque about gasoline. Because ethanol burns more quickly than gasoline, more fuel may be consumed and burned efficiently, increasing output power, torque, and mean effective pressure. At 2500 rpm engine speed, the engine torque are 4.57, 4.62, 4.69, 4.76, and 4.84 N.m for gasoline, E5, E10, E15, and E20, respectively. The findings corroborated the previous research. 20

Influence of gasoline-ethanol mixtures on output torque.
Impact of ethanol mixing on indicated mean effective pressure
The impact of ethanol addition on mean effective pressure at various engine speeds is depicted in Figure 3. MEP also marginally increases as the ethanol content of the mixture rises. Due to the rise in fuel consumption, the engine output power was increased with respect to engine speed. Ethanol burns more efficiently than gasoline because of faster flame speed which improves the output power and mean effective pressure. At an engine speed of 2500 rpm, E5, E10, E15, and E20 fuels produced MEP improvements of 2.5%, 4.1%, 6.8%, and 8.9% when compared to basic gasoline, respectively.
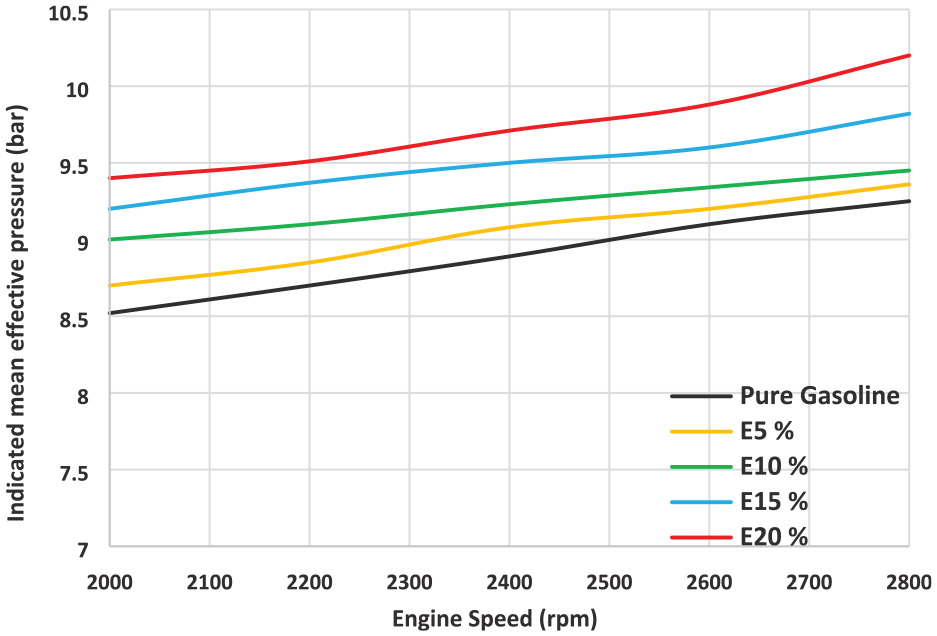
Indicated mean effective pressure at different gasoline ethanol blends.
Influence of ethanol blending on indicated specific fuel consumption and thermal efficiency
The impact of ethanol injection on SFC and TE at different engine speeds is shown in Figure 4. Lower calorific value of ethanol in comparison to gasoline accounts for the increase in specific fuel consumption for ethanol-gasoline mixtures. Ethanol addition has increased SFC values by average 1.9%, 3.7%, 5.5%, and 7.2% for ethanol ratios of 5%, 10%, 15%, and 20%, respectively according to gasoline at engine speed of 2500 rpm.44–46 Ethanol inclusion has increased TE values by 1%, 1.5%, 2.2%, and 3% for ethanol percentages of 5%, 10%, 15%, and 20%, respectively about gasoline at engine speed of 2500 rpm. The increase of engine speed to 2300 rpm, specific fuel consumption starts to decline and thermal efficiency orients to increase because more output power is needed to overcome the frictional resistance. Additional fuel is needed to enable continued engine operation because the friction power is matched to engine speed. The specific fuel consumption and thermal efficiency are controlled by the fuel calorific value and oxygen content. Because gasoline-ethanol mixtures have lower calorific values, they need more SFC and less inferior thermal efficiency. Specific fuel consumptions values were 0.707, 0.694, 0.720, and 0.735 kg/kW/h, respectively for gasoline, 5%, 10%, 15%, and 20% of ethanol at 2500 rpm engine speed. The highest decrease in SFC of 20% ethanol was 7.2% about gasoline. The maximum increase in TE of 20% ethanol was 3% about gasoline. The results were agreed with literature.22,23

Specific fuel consumption and thermal efficiency versus engine speed at different gasoline-ethanol blends.
Influence of ethanol mixing on volumetric efficiency
Figure 5 indicates the impact of ethanol introduction on volumetric efficiency at different engine speeds. As the engine speed in the mixture increases, the induction air mass and volumetric efficiency increase. As the proportion of ethanol in gasoline - ethanol blends rises, the volumetric efficiency rises as well. The heat of evaporation of ethanol is 2.75 times more than gasoline, which lowers the intake manifold temperature and improves the volumetric efficiency. As ethanol concentration is increased, the fuel consumed and volumetric efficiency rise due to lower vapor pressure of ethanol.

Volumetric efficiencies of different gasoline-ethanol blends.
Combustion characteristics
Figure 6 indicates the impact of ethanol blending with gasoline on cylinder pressure, P-V, cumulative work done, cylinder temperature and heat release. The stratified fuel ratio is nearer to the spark plug and the cool cylinder wall, which makes it easier for the flame to spread and ignite the mixture. A broad lean burn limit also tends to speed up flame propagation and increase the combustion temperature, which can increase the cylinder pressure, total work done, heat transfer, and heat release rate in a shorter time at the next combustion phase. The leaner air-fuel mixture was caused by the rise of ethanol in blends. The lean combination was defeated by much faster combustion. When ethanol’s high flammability range and relatively high adiabatic flame speed are taken into account, it becomes clear why the maximum pressure and HRR values are greater and closer to TDC because of faster combustion. Fuel with ethanol added results in less heat being released from the cylinder. High molecular dispersion and rapid flame speed of gasoline-ethanol mixtures led to the higher cylinder temperature. The increases in cumulative work done, heat transfer and cylinder temperature were shown for gasoline and ethanol blends. The ratio of ethanol with low carbon content, oxygen content, high flammability and faster combustion compared to gasoline can be used to explain the higher cylinder pressure and temperature values. The highest cylinder pressures were 28 and 32 bar for gasoline and E20, respectively. The highest value of cumulative work done was 209.6 J for E20. The highest value of cylinder temperature is 2265 K for blending of 20% compared to 2047 K for gasoline. The highest value of heat transfer is 554.5 J for E20.

Variations of cylinder pressure, cumulative work done, cylinder temperature and heat transfer versus crank angles for different gasoline ethanol blends.
Ethanol blending impact on exhaust emissions
Influence of ethanol inclusion on NOx emission
Figure 7 depicts the impact of the introduction of ethanol on NOx concentration. The amount of nitrogen oxides is determined by the temperature and oxygen content in the combustion chamber. As ethanol concentrations rise, combustion is delayed and flame temperature drops, resulting in low NOx emissions. As engine speed is raised, NOx emissions increase due to an increase of fuel consumption. NOx emissions of gasoline and ethanol mixtures are lower for the same engine speed at all engine speeds than for gasoline alone. Thus, the NOx emission is reduced due to the reduction of adiabatic flame temperature during combustion. In this stoichiometric condition, more fuel is used due to rising volumetric efficiency brought on by a decline in the stoichiometric rate in tandem with rising ethanol rate, high vapor density, and evaporation heat. Air-fuel ratio and combustion cylinder temperature are the two main causes of NOx emission. When the temperature within the cylinder rises above 1800 K, the oxygen and nitrogen in the air combine to produce NOx. The E20 blended fuel produced the least NOx emission. When fuels with high oxygen content are burned, NOx emissions from fuels containing alcohol are reduced. The combustion duration and cylinder gas pressure are reduced by the increase of cooling energy flow. The delay of ignition timing can help to support the low NOx emissions. The highest variation in NOx emission percentage for E20 is 3.3% at engine speed of 2500 rpm. The findings corroborated previous research.14,16,18
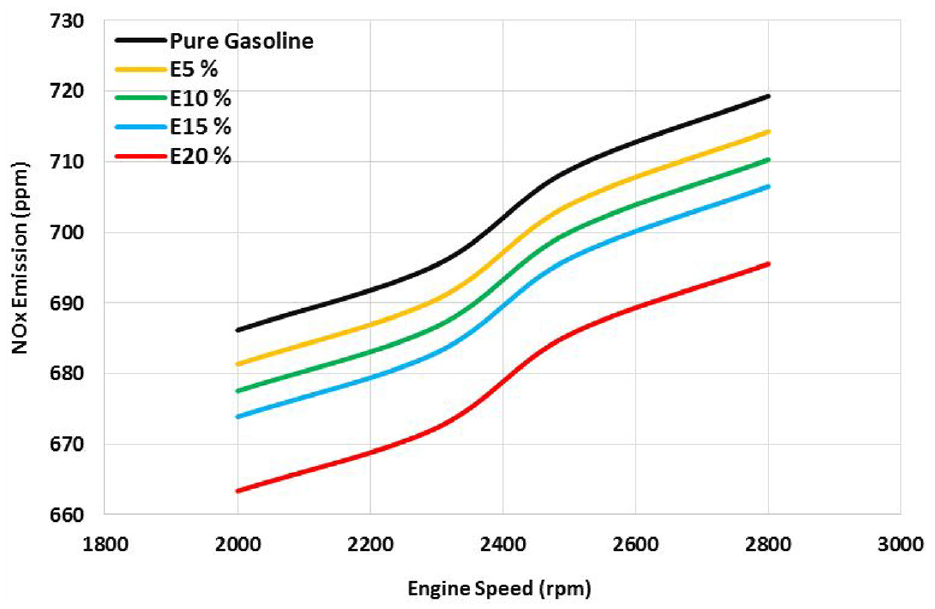
Values of NOx concentration of different gasoline-ethanol mixtures.
Impact of ethanol addition on CO emission
Figure 8 illustrates how CO emissions rise as engine speed rises. Due to the rising of cylinder temperature and fuel consumption, CO concentration rose as the engine speed rose. At all engine speeds, CO emissions produced by ethanol are lower than gasoline. The stratified fuel ratio puts the spark plug and the cool cylinder wall closer to each other, allowing the flame to spread farther and ignite the mixture more quickly. Additionally, a broad lean burn limit tends to speed up the flame propagation and improves the cylinder temperature and heat release rate, reducing CO emissions. Because the gasoline-ethanol blends contain hydrogen and oxygen, CO emissions are reduced as the combustion is improved. Due to the leaner air fuel mixture with ethanol blends, CO emissions were reduced. The percentage of CO reduction grew as the blend’s ethanol content did. Higher ethanol content results in the better engine combustion efficiency and higher carbon dioxide emissions. The engine combustion is improved by ethanol-enriched fuel’s ability to mix more oxygen with gasoline. The addition of gasoline improves the combustion and reduces the carbon monoxide by the fuel fine atomization, improved mixing, high molecular dispersion, high flame speed, and improved burning. The ratio of ethanol with low carbon content compared to gasoline can be used to explain the declining trend in CO. A leaner mixture of air and fuel resulted from the increase of ethanol percentage. Leaner mixture failed to compete with faster combustion. However, the combustion became leaner as the ethanol concentration rose. The biggest reduction in CO emission occur at 2500 rpm was 23.5% when 20% of ethanol is blended with gasoline. The findings agreed with the literature.10,15,22,24

Change of CO emission for different gasoline-ethanol blends.
Influence of ethanol addition on HC emission
According to Figure 9, hydrocarbons drop as the engine speed rises. The turbulence intensity, which enhances the air/fuel mixing, fuel consumption increase, and combustion improvement, was demonstrated to produce the decrease in HC concentration with the engine speed. The main reasons for incomplete combustion and the generation of hydrocarbons are oxygen deficiency and mixture heterogeneity. As the ethanol level increased, hydrocarbon emissions fell. With the increased ethanol utilization, the mixture becomes more homogenous, which reduces the HC emissions and improves the combustion. By reducing hydrocarbon emissions, blended fuel helps to more complete combustion and speeds up the wall quenching. HC concentration was decreased as the engine speed climbed because the longer valve overlap gap at low engine speeds and the larger relevance of this reduction at higher engine speeds. Reduction in hydrocarbons results from the improved combustion, which raises the engine cylinder temperature. Alcohol’s structure contains oxygen, which improves the combustion efficiency. Due to the high flammability of ethanol and high flame speed and this leads to the comparatively high in-cylinder pressure and temperature about gasoline. Pure gasoline has higher HC emissions than gasoline-ethanol mixtures. Improved combustion caused by the improved fuel and air combination results in less HC concentrations. This is attributable to the enhanced oxygen content-caused air-fuel mixing. Lower hydrocarbon emissions were produced by the ethanol blends’ better combustion and fuel finer atomization. At 2500 rpm, the greatest reduction of E20 about gasoline fuel was 16%. The findings were consistent with the literature.8,10,20
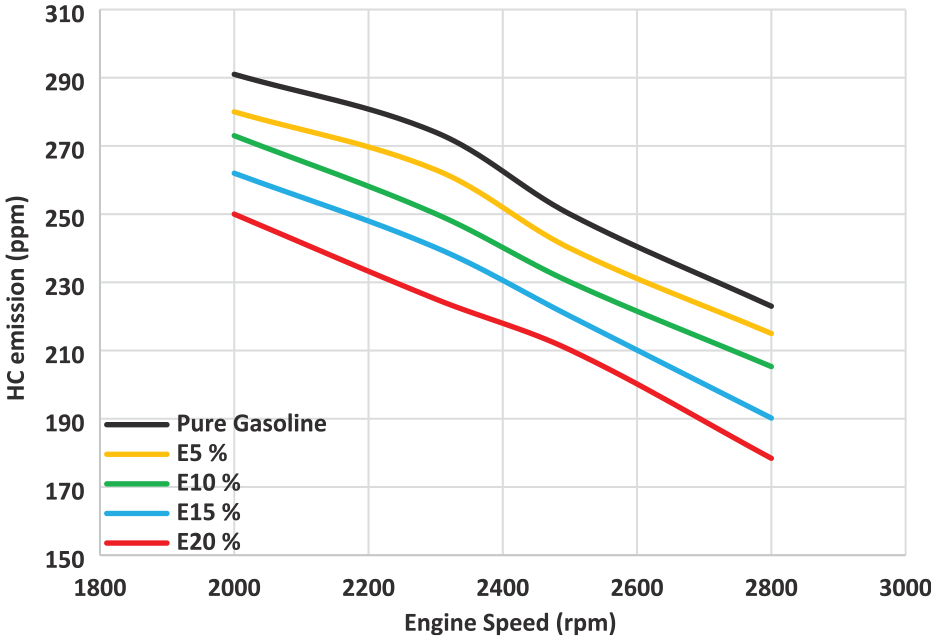
Variation of HC concentration for gasoline-ethanol blends.
Impact of ethanol introduction on CO2 emission
Influence of ethanol inclusion on CO2 emission was shown in Figure 10. This may be because the mixture of ethanol and gasoline guarantees efficient burning of these mixtures inside the cylinder and increasing the overall amount of CO2 in exhaust emissions. Additionally, the blends’ oxygen concentration raises the oxygen-to-fuel ratio in the fuel-rich areas. Additionally, for ethanol-blend fuel, the air-fuel ratio is approaching the lean region, resulting in enhanced and complete combustion and a consequent decrease in the CO concentration. The less carbon content is shown for ethanol compared to gasoline. Improved combustion and high flammability lead to the increase of carbon dioxide and CO decrease. The fixed carbon content in ethanol and gasoline blends and CO reduction leads to the carbon dioxide increase. The maximum increase in CO2 was 23.5% for E20 about gasoline, These findings corroborated the literature.10,12

CO2 values at engine speed variation for different gasoline-ethanol blends.
Impact of ethanol mixing on oxygen concentration
Figure 11 shows the oxygen emission of ethanol and gasoline mixtures at different engine speeds. Amount of oxygen in exhaust gases depends on the fuels’ oxygen content. Oxygen emission is also influenced by how much air is injected into the cylinder during the intake stroke. Additionally, adding alcohol to gasoline leads to the reduction in the stoichiometric air-fuel ratio. High oxygen content and improved combustion efficiency lead to the oxygen concentration increase about gasoline. E20 fuel had the highest oxygen emission because ethanol has a greater oxygen concentration. The highest increase in oxygen emission in relation to the fuel’s oxygen content about gasoline is 18% for E20 fuel.

Oxygen values of gasoline-ethanol blends versus engine speeds.
Model verification
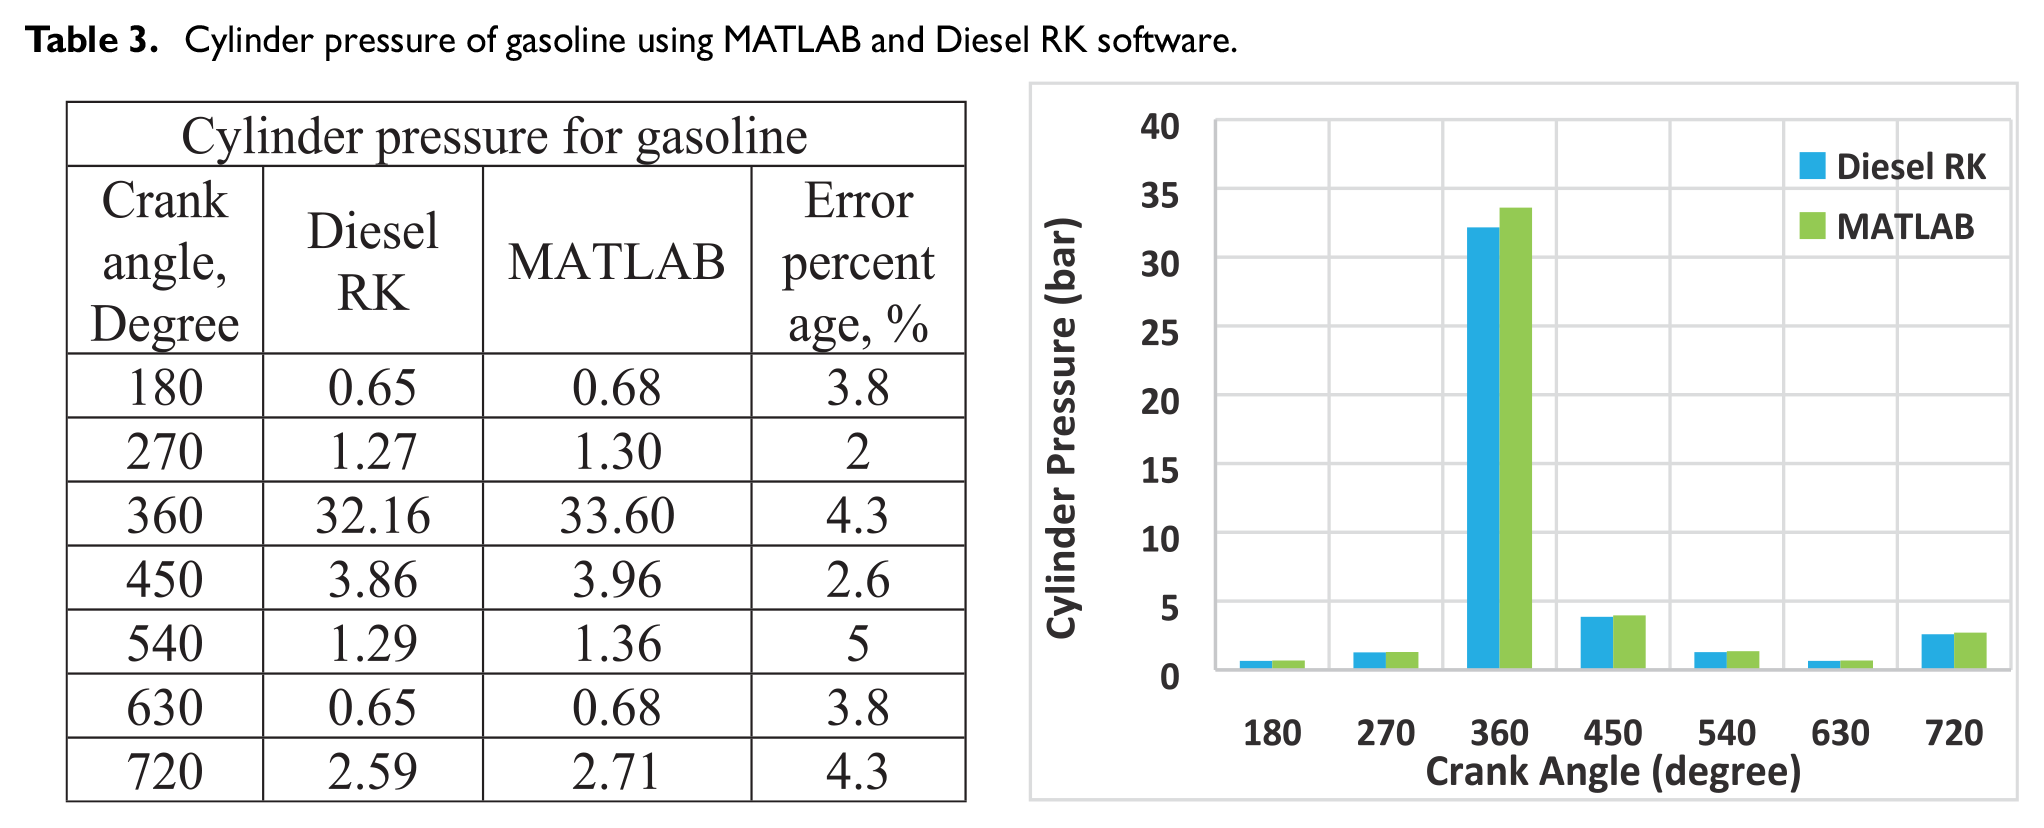
Computer simulation techniques are useful alternative methods and sufficiently precise to create the mathematical model that permits change and the testing of numerous factors. To validate the model, it is favorable to achieve the near results between MATLAB code and Diesel RK software. Tables 3 and 4 shows the error percentages between MATLAB code and Diesel RK software for cylinder pressure at different crank angles and MEP for gasoline. The results showed that the MATLAB code results are near to Diesel RK software with an error approximately up to 4.5 and 5% for cylinder pressure and mean effective pressure, respectively. Thus, it is acceptable for the model verification.
Cylinder pressure of gasoline using MATLAB and Diesel RK software.

Indicated MEP of gasoline fuel using MATLAB and Diesel RK software.


Model validation
The results of MATLAB code are near to the experimental results 45 and agreed with it. Thus, it is a validated model. The error between MATLAB and experimental is shown. The differences between model and Diesel RK results are shown in the following figures. Figure 12 shows the relationship between the output power and torque of petrol engine at engine speed variation for model, diesel RK software and experimental. The comparative results between the impact of adding ethanol to gasoline in volume ratios of 5%, 10%, 15%, and 20% on engine output power at 2500 rpm for diesel RK software, model and experimental were examined as shown in Tables 5 and 6 for engine output power and torque, respectively. The maximum error is roughly up to 5% between the MATLAB code and Diesel RK but it is roughly up to 1% between the MATLAB code and experimental for output power. For output torque, the greatest error is approximately 2% between the MATLAB code and experimental, but it is approximately 3.5% between the MATLAB code and Diesel RK.

Engine power and torque values for gasoline ethanol mixtures.
Error between MATLAB and experimental in output power for ethanol-gasoline blends.

Error between MATLAB and experimental in output torque for different ethanol ratios.

Comparison of specific fuel consumption utilizing various ethanol and gasoline mixtures for diesel RK software, experimental and model is given in Figure 13 and Table 7, respectively for ethanol blends up to 20%. In terms of specific fuel consumption, the difference between the MATLAB code and experimental is roughly 2.5%, but the difference between the MATLAB code and Diesel RK is almost 5.5%. For ethanol blends up to 20%, Figure 14 and Table 8 provide comparisons of HC and NOx emissions values from diesel RK software, experimental and model. Between MATLAB and experimental, the highest error is about 5% for NOx emission but it was up to 1% for HC emission.

Variation of SFC for different gasoline-ethanol blends.
Error between MATLAB and experimental for SFC for ethanol blends.


Impact of gasoline and ethanol blends on HC and NOx emissions.
Error between MATLAB and experimental for HC and NOx emissions for ethanol percentages.

The model validation for heat transfer versus crank angle was confirmed with the literature. 47 Additionally, the literature papers46,47 were agreed with the model for the relationship between cylinder pressure and crank angle. The model validation was compared with the literature. 46 The results show that it is near to this literature as shown in Figure 15. The validation was compared for output power, torque and SFC with literature.26,38 The model validation was compared with literature, 45 for specific fuel consumption, the results show that it is the same behavior for the gasoline-ethanol blends.

Variation of SFC with literature for different ethanol concentrations.
Conclusions
A quasi-dimensional simulation of SI engine was used to examine the combustion, performance, and emissions of ethanol and gasoline blends. The conclusions were summed up as follows:
The engine output power improvements was 5.5% for E20 at engine speed of 2500 rpm about gasoline. Ethanol addition increased the SFC value by average of 7.2% for 20% of ethanol percentage related to gasoline at engine speed at 2500 rpm. Ethanol addition increased the torque of 20% ethanol by 5.9% about gasoline. The engine thermal efficiency is decreased by 3% about gasoline for E20. The highest increases in volumetric efficiency and mean effective pressure were around 1.51 and 8.9% for E20, respectively.
The highest values in peak cylinder pressure and cylinder temperature for E20 are 32 bar and 2265 K, respectively.The highest value of cumulative work done is 186.25 J for E20. The highest value of heat transfer is 554.5 J for E20. The highest deviations in NOx, HC and CO emissions for E20 are 3.3, 45 and 23.5%, respectively about gasoline at engine speed 2500 rpm.
The validity of the mathematical model’s using MATLAB to the experimental work and diesel RK software indicate that the MATLAB code is appropriate. MATLAB code is appropriate, and the mathematical model can be applied to a wide range of alternative hydrocarbon fuels. Petrol engine performance, combustion and exhaust emissions were improved with using up to 20% ethanol blending.
Footnotes
Appendix
Handling Editor: Chenhui Liang
Declaration of conflicting interests
The author(s) declared no potential conflicts of interest with respect to the research, authorship, and/or publication of this article.
Funding
The author(s) received no financial support for the research, authorship, and/or publication of this article.