
Abstract
During RSW, the number of qualified samples is much more than the unqualified ones, forming an unbalanced set, thus affecting the training effect of the model, meanwhile, most samples are unlabeled, and if all the joints are marked, it is more expensive. Based on this, a method of spot welding quality judgment of stainless steel plate based on semi-supervised conditional generation adversarial network is proposed. Firstly, labels are added to the noise to generate labeled data and unlabeled data, which are mixed in a certain proportion to ensure the diversity of generated data. Then, the real data is divided into two parts, in which the unlabeled part plays a game with the generated data to generate samples as close to the real as possible, meanwhile, the data with true discriminant results and labeled data are input into the autoencoder to obtain the feature vectors set of different states. Finally, the training parameters and test samples are input into the classifier to obtain the judgment results. The proposed method was applied to application case, and the results showed that it not only had a good fitting effect, but also had a high classification accuracy. Consequently, the method proposed was effective.
Keywords
Introduction
Spot welding is a high-speed and economic practice for workpiece connection, which is normally used to make lap joints in metal sheets. Since the nugget is formed in a closed state during welding, which cannot be observed directly, post-weld inspection, that is, a tensile-shear test, is usually used to evaluate the performance of spot welding. However, this method has to be based on a large number of welding tests, which will cause a significant increase in the production cost and cannot reflect the production performance in real time.
With the continuous improvement of the standard degree of spot welding process, the number of qualified samples obtained is much more than that of unqualified ones, forming an unbalanced data set. It is difficult to train a high-quality model with a small amount of sample data, thus affecting the classification effect of the model. In this case, it is difficult to train a quality model using a small amount of sample data, which affects the classification effect of the model. Moreover, the spot welding joints of different qualities need to be labeled individually for the tensile-shear test, that is, classifying the spot welding joints. This manual method of adding sample labels increases the joint quality judgment cost. Furthermore, a large number of samples obtained during the test are unlabeled, so it deserves further investigation on the unbalance problem of data samples.
There are many methods available to deal with unbalanced datasets, such as under-sampling, oversampling, and the generative method. For example, to improve the performance of the model on limited and imbalanced data sets, Zhang et al. 1 proposed deep learning and transfer learning methods. Aiming at the class imbalance, Wang et al. 2 proposed a new graph-based method, named anchor-based class-balanced GCN (ACB-GCN). Tsai et al. 3 used a generative adversarial network based model to generate synthetic defect samples from a small set of real defects. To address the problem of feature selection for imbalance welding data, EI-Banna proposed the MGA classifier. 4 The results of the imbalanced data problem in the classification of different types of weld flaws was presented by Liao. 5 Aiming at the data imbalance and the accuracy of defect detection, Guo et al. 6 combined generative adversarial network with transfer learning. Dai et al. 7 used GAN-based data augmentation to improve the performance of spot welding defects classification. Lang 8 proposed a data augmentation method, which was combined the generative adversarial network with the time-frequency graph of magnetic flux leakage (MFL) signals.
Semi-supervised learning and unsupervised learning are two common solutions to the problem of costly labeling of samples. In order to avoid expensive and time-consuming labeling efforts by a domain expert, Zhang and Lang 9 employed semi-supervised learning to simultaneously increase accuracy and robustness. Okaro et al. 10 utilized the semi-supervised approach to detect faults in AM products. Zhou et al. 11 combined the collect the state information in the welding process with the unsupervised learning method to predict the final welding quality. Aiming to make the best use of unannotated image data, Dong et al. 12 described a method, which can often be collected easily. To monitor the milling process and weld wear based on existing data in real production lines, Ibanez et al. 13 presented a method. Nacereddine et al. 14 used the MGGD to consist in an unsupervised classifier.
Deep learning is a broader class of machine learning methods based on data representation. It combines low-level features to form more abstract high-level presentation features to discover distributed characteristics of data. Compared with traditional machine learning methods, deep learning has the following advantages:
• Automatic feature learning: to overcome the dependence on expert experience and the inability to obtain the hidden deep features when extracting features manually.
• Depth of exponential gain: to overcome the traditional machine learning methods in the face of high dimensional data, the problem of difficult to fit.
• Popular learning: to solve the local invariance in machine learning prior assumptions.
• As deep learning enables more applications of machine learning and expands the service scope of artificial intelligence, many deep learning models have emerged.
Autoencoders and their variants. For example, to get better feature representation, Yuan et al. 15 utilized SIAE to deal with the raw input data. Peng et al. 16 used dynamic SAE to deal with the process data, by cooperating learn deep static and dynamic features.
Deep confidence networks and their variants. Yu and Liu 17 combined confidence with classification rules, proposed the knowledge-based deep belief network method. Chao et al. used deep confidence network to improve the operation safety of high voltage power supply. 18
Convolutional neural network and their variants. Wen et al. 19 used Lenet-5 method for fault diagnosis. To deal with the working load, Zhang et al. 20 proposed a new model based on deep learning.
Others. Guo and Liu 21 used GAN to model soft sensor, at the same time, it established an innovative GAN-based hybrid mechanism- and data-driven soft sensor framework.
With the development of deep learning, generative adversarial network and its variants are also increasingly employed to deal with the above two problems. For example, Sricharan et al. 22 combined conditional generative models with semi-supervised setting, to conditionally generate data given attributes by adapting the GAN framework. Xu and Wang 23 presented the semi-supervised conditional generative adversarial network with spectral normalization (SN-SSCGAN). To process the nopulse unknown radar signals, Cao et al. 24 designed density based spatial clustering of applications with noise based on particle swarm optimization and a semi-supervised conditional generation adversarial network. Liu et al. 25 proposed an effective two-stage optic disc and cup segmentation method, named CDR- GANs.
The analysis of existing research findings reveals that,
As a novel data generation method, the generative adversarial network is widely used for the extension of unbalanced datasets.
Semi-supervised or unsupervised learning can be used to solve the problem of costly labeling of samples during model training.
Integrating the semi-supervised learning with the conditional generative adversarial network can solve the unbalance of sample datasets, reduce the labeling cost of samples, and enable classification of samples.
By combining the features of spot welding joints (i.e. the number of qualified joint samples acquired is far more than the number of unqualified ones, and most of the samples are unlabeled) with the established semi-supervised conditional generative adversarial network, a spot welding quality judgment method of stainless steel sheets based on improved semi-supervised conditional generative adversarial network was presented in this paper. The main innovations of this study were as follows:
When generating the sample data, both labeled and unlabeled data were retained and mixed in a certain ratio to ensure the diversity of the generated data.
During discrimination, only the generated data were used to compete with the unlabeled data in the joint sample datasets to ensure that the discriminant network had a large degree of freedom in structure.
The labeled data in the joint sample datasets were used only to guide the model training, while a classifier was added to the output layer to enable the classification of welding joint qualities.
By using the method proposed in this paper, the sample data of unqualified joints acquired from spot welding could be expanded, and a large number of samples with unknown quality state were not necessary to be labeled during model training. The method also came with a classification function as a way to judge the quality of spot welding.
This paper then elaborated on the used models and methods in Section Theoretical Basis, based on which, the model for judging the spot welding quality was established and analyzed in detail. The effectiveness of the proposed method was further verified by practical examples, and the conclusions were presented at the end of this paper.
Theoretical basis
Conditional generative adversarial network
The conditional generative adversarial network (CGAN) is a generative adversarial network (GAN)
26
with additional condition defined to generate data in a guided manner,
27
and its structure is shown in Figure 1. The loss function varies with the condition

CGAN structure.
Semi-supervised generative adversarial network
The discriminator of the semi-supervised generative adversarial network (semi-GAN) adopts soft-max as the output layer to solve the problem of multi-classification.
27
Its network structure is shown in Figure 2. If the number of dataset categories is assumed to be

Semi-GAN structure.
Related work
Overview of models
The existing semi-supervised conditional generative adversarial network has the following two limitations: only the labeled generated samples are considered when generating sample data, which limits the diversity of the generated data; and when discriminating the data, only the labeled real data are used to compete with the generated data to generate data that are very similar to the real data, which limits the degree of freedom of the network structure. Here the “freedom” contains two meanings. On the one hand, the selection of network structure has freedom, because the discriminant network
The basic idea was as follows: First, the label
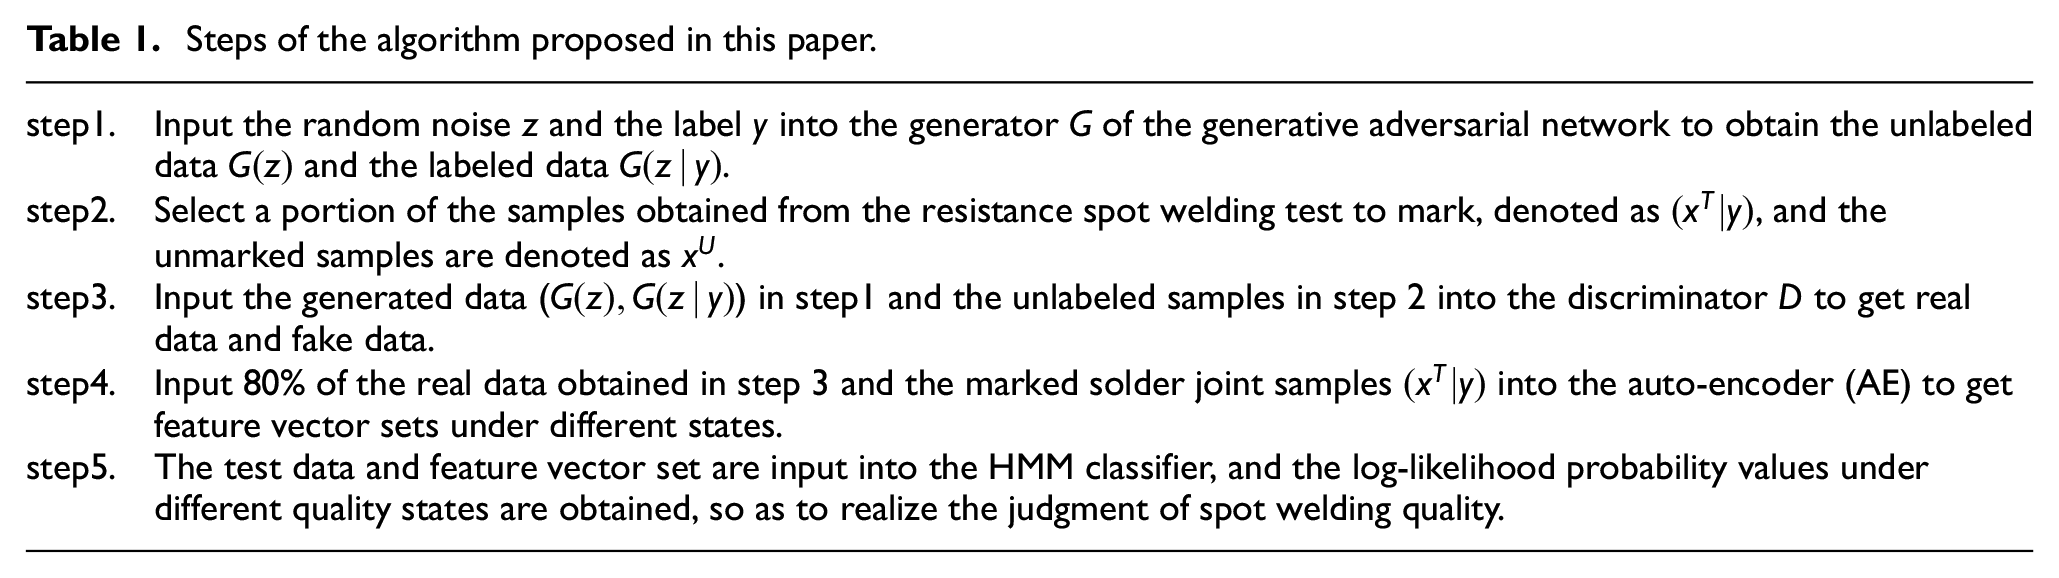
The structure of the algorithm proposed in this paper is shown in Figure 3. This algorithm is realized by the steps listed in Table 1.

The flow chart of the algorithm proposed in this paper.
Steps of the algorithm proposed in this paper.
Design of loss function
The first was to consider the generative network, whose role was to generate data according to the category of the input data, with the distribution similar to the input data, thus making the output “fake data” as close as possible to the real data in the sample database. The algorithm proposed in this paper took into consideration both the labeled generated data
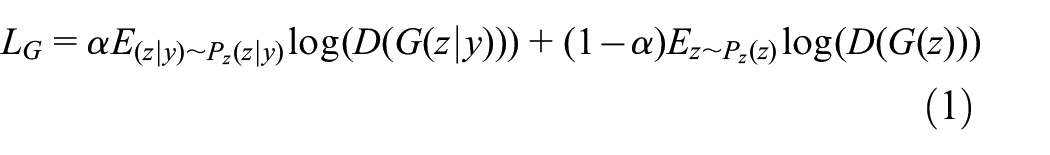
Where,
The next was to consider the discriminant network, whose role was to judge the unlabeled generated data and the unlabeled real weld joint sample data. Through repeated gaming and competing, the purpose of generating data that were very similar to the real data was finally achieved. For the discriminant algorithm proposed in this paper, the generated data was separated into two parts: labeled sample

In the following, the convergence of the proposed algorithm was analyzed. When the algorithm converges, that is, when both the labeled data

Where,

By deriving

The result is:

The discussion on equation (6) is as follows:
When
When
When the value of
Therefore, the algorithm proposed in this paper can be regarded as a combination of the semi-supervised generative adversarial network and the conditional generative adversarial network, which is different from existing semi-supervised conditional adversarial networks, and it can be assured that the algorithm converges.
Experimental investigation
Test materials and methods
Test materials
The test was conducted using 3 mm thick X2CrNiN18-7 cold rolled stainless steel sheets, which are commonly used in railway carriages. The chemical composition and mechanical properties are shown in Tables 2 and 3, respectively.
Chemical composition of X2CrNiN18-7 stainless steel sheets (%).

Mechanical properties of X2CrNiN18-7 stainless steel sheets.

Welding equipment
The spot welding equipment used in this article is SMD-40 medium-frequency DC spot welding produced by Shanghai Yuanlin Technology Co., LTD., as shown in Figure 4, and its technical parameters are shown in Table 4.
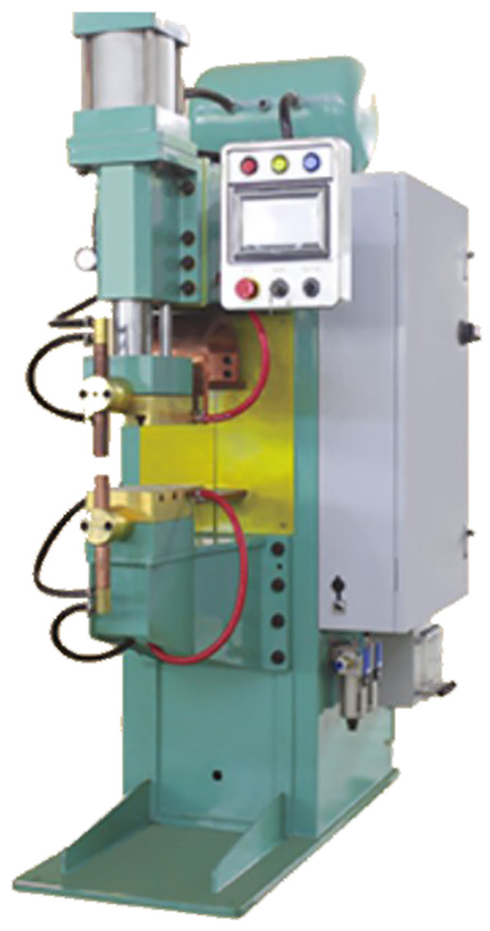
SMD-40 medium frequency spot welding.
Main technical parameters of spot welding.

Spot welding parameters
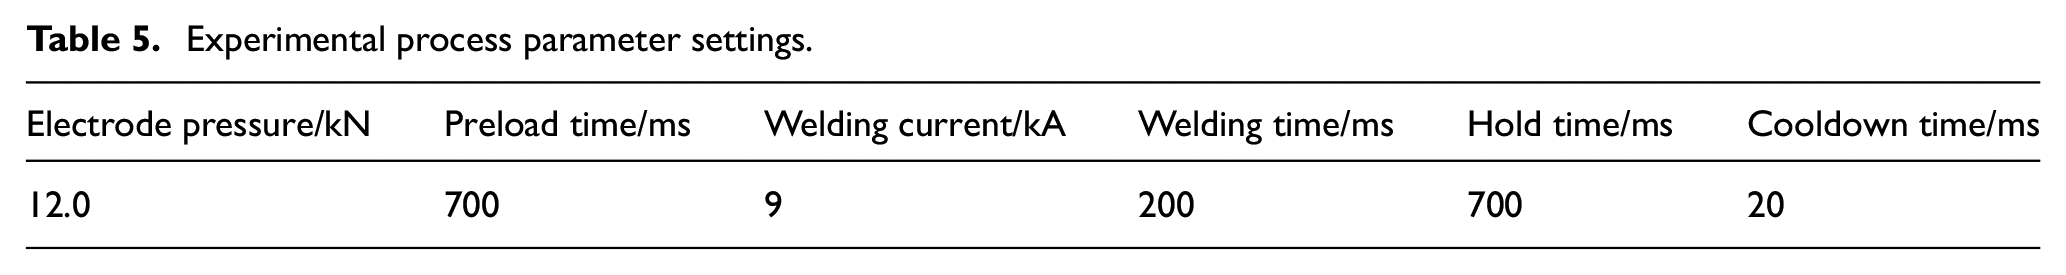
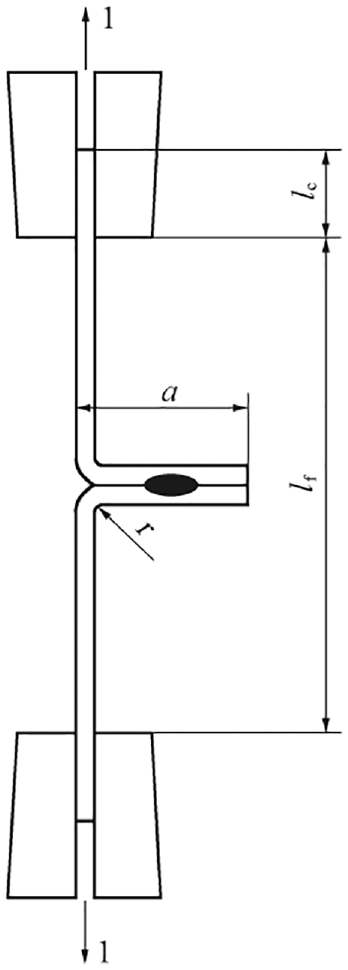
Lap joints were adopted as the welding joints and down-hand welding was employed. The design of welding joints is shown in Figure 5, and the test process parameters are shown in Table 5. The basis for its determination is as follows:
Effect of process parameters on spot welding quality. During the welding process, there are many factors affecting the quality of spot welding joints, among which the main factors include: welding current, welding time, and voltage between electrodes. Due to the short-term fluctuation of process parameters, the quality of spot welding joints will change. Therefore, this article sets the relevant process parameters in Table 5 according to the empirical values, so as to ensure the quality of spot welding joints. At the same time, since the nucleation process is not visible, in order to ensure the quality of spot welding, it is necessary to conduct post-welding destructive detection of spot welding joints.
Basis for selecting the spot welding joint samples: resistance spot welding test. Through tensile shear test and stripping test, can be measured spot welding joint tensile shear and core diameter, according to the requirements of rail vehicles for products, namely: a single joint tensile shear should be ≥17.2 kN, core diameter should be ≥8 mm, can realize the initial division of spot welding joint quality: qualified and unqualified. Further, a macro metallographic test is carried out on the welding, and the unqualified sample is judged again according to whether the welding fusion is good, whether the penetration depth and the limit of deficiency meet the product requirements.

Spot welding joint design.
Experimental process parameter settings.
Tensile-shear test
A tensile-shear test was performed after welding according to related standards. 28 In consideration of the shunting effects and the welding stability, two specimen plates (each 750 mm long and 250 mm wide) were selected and spot welding was performed on the sheets as shown in Figure 6 (the overlapping dimension was 45 mm) and the tensile shear test was carried out as shown in Figure 7.

Specimen size and test piece solder joint location.

Diagram of tensile shear test.
Stripping test
Two test plates with a length of 750 mm and a width of 250 mm were selected for spot welding as shown in Figure 5, with an overlapping size of 45 mm. After welding, 11 chisel and shovel samples were processed, and a stripping test was carried out, as shown in Figure 8. At the same time, the workpiece was cut into 11 tensile-shear specimens and the nugget size was measured. It needs to point out that the judgment of spot welding joint quality is divided into two steps:
“Rough” judgment. The tensile shear test of a single joint during welding fracture is measured through tensile shear test. If the tensile shear is ≥17.2 kN, it is considered qualified, otherwise it is unqualified. At the same time, measure the core diameter of a single joint, if the core diameter is not <8 mm, it is regarded as qualified product, otherwise unqualified. It should be pointed out that the tensile shear force and core diameter must meet the above conditions at the same time, in order to be judged as qualified products. Based on the above methods, the quality of spot welding joints can be initially divided into qualified and unqualified, as shown in Table 6.
“Fine” judgment. On the basis of the “rough” judgment, combined with the macro metallographic test, that is, whether the welding fusion is good, whether the penetration and the limit of the deficiency meet the requirements of the product standard, and whether the heat affected zone is abnormal, in order to achieve the further division of unqualified spot welding joints: incomplete fusion, cracks, shrinkage and spatter.
Stripping test diagram.
Tensile shear test results.

Macro metallographic test
In the test, two specimens with a length of 750 mm and a width of 250 mm were still selected for spot welding as shown in Figure 6, with an overlapping size of 45 mm. The test results are shown in Figure 9. It can be seen from Figure 9,
Qualified spot welding joints: good welding fusion, penetration depth and core diameter meet the requirements of product standards, base metal and heat affected zone no abnormal.
Incomplete fusion spot welding joints: no core or weld, minimal penetration, and plastic bonding.
Cracks spot welding joints: the welding fusion is good, the penetration depth and core diameter do not meet the requirements of the product standard, and there are cracks in the heat affected zone.
Shrinkage spot welding joints: welding fusion is general, the penetration depth is close to the standard value, but the core diameter is less than the standard value, and there are pores at the edge of the core, and cracks associated.
Spatter spot welding joints: the welding core is good, the penetration depth and the core diameter are close to the standard value, but there are shrinkage holes and cracks.

Macro metallographic diagram of five spot welding joints: (a) macro metallographic picture of welding joint (qualified), (b) macro metallographic picture of welding joint (incomplete fusion), (c) macro metallographic picture of welding joint (cracks), (d) macro metallographic picture of welding joint (shrinkage), and (e) macro metallographic picture of welding joint (spatter).
As can be seen from Table 6, the tensile-shear force and the nugget size vary with the quality state of the welding joint, which is illustrated by the following:
The tensile-shear force of qualified joints was similar to that of the joints with spatter, but the nugget size of qualified joints was bigger.
The tensile-shear force and the nugget size of the unfused joints were the smallest among the five quality states.
The tensile-shear force and the nugget size of the joints with cracks were similar to those of the joints with shrinkage, but smaller than those of the qualified joints and the joints with spatter, and greater than those of the unfused joints.
The above analysis manifests the welding test can be used to obtain spot welding samples, and then the tensile-shear test can be used to judge the spot welding quality. By using the results, labeled joint samples can be created.
Further, the number of welding joints of each quality state (i.e. qualified, spatter, incomplete fusion, cracks, shrinkage) can be obtained using the resistance spot welding test platform, as shown in Table 7. In order to achieve accurate division of spot welding joint quality, it follows these steps:
Measurement of tensile shear force and core diameter of spot welding joints. Through the tensile shear test and stripping test of spot welding joint to determine the general range of the two, so as to achieve the initial judgment of spot welding quality, that is, qualified and unqualified.
Macro metallographic test of spot welding joints. The quality of spot welding joint can be accurately judged by judging whether the welding fusion is good, whether the penetration depth and the limit value of the deficiency meet the requirements of the product standard, and whether the heat affected zone is abnormal.
As can be seen from Table 7 that the number of samples obtained by this method is limited, the number of qualified joints is large, and the percentage of labeled samples for each quality state is <20%. It shows that a large number of samples are unlabeled, and it would be costly if these samples are labeled manually at a later stage. Therefore, the method proposed in Section Related Work of this paper will be used to solve the above problem.
Sample number of spot welding joints.

Test results and analysis
The method proposed in this paper (i.e. semi-CGAN) was used to expand the joint sample datasets of the five quality states (Table 7) to bring each number of samples to 500. Meanwhile, to verify the performance of the proposed method, four deep learning models, including semi-CGAN in Xu and Wang, 23 CGAN and semi-GAN in Wang et al., 27 GAN in Goodfellow et al. 26 , and two kinds of shallow learning models, that’s, BPNN and HMM were introduced in the paper. The initial parameters of all models are shown in Table 8.
Initial parameter settings of the proposed method.

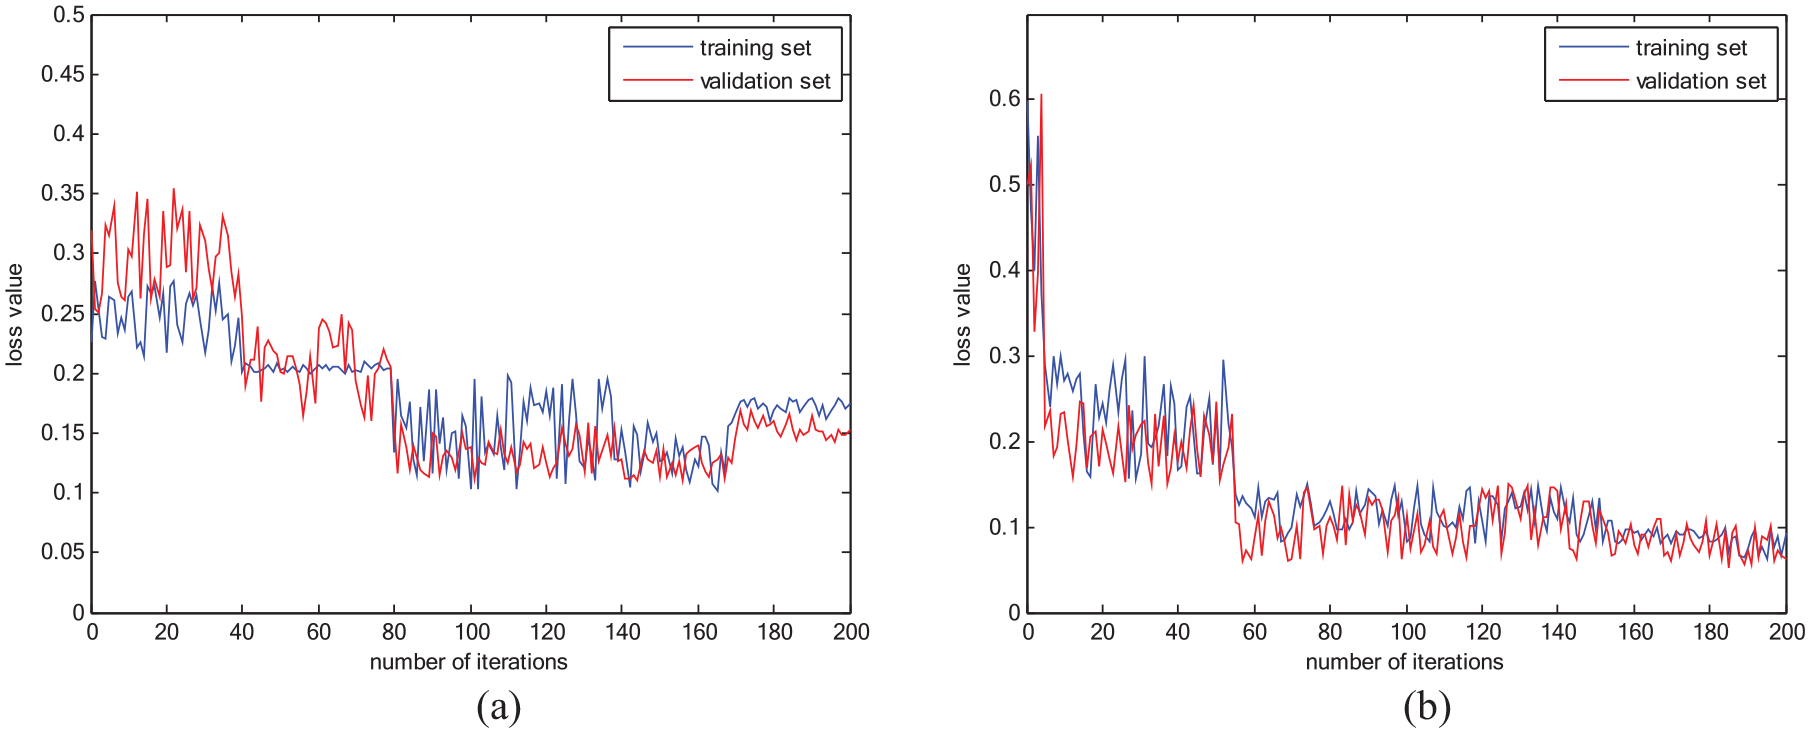
The above five models, namely semi-CGAN, semi-CGAN, 23 semi-GAN, CGAN, GAN, were then trained using the extended sample database, and only qualified joint samples were used in this study as an example for illustration. The variations of the loss function values during the training are shown in Figures 10 to 14.

Semi-CGAN model training situation: (a) discriminant network loss function value change and (b) generative network loss function value change.

Semi-CGAN 23 model training situation: (a) discriminant network loss function value change and (b) generative network loss function value change.
Semi-GAN model training situation: (a) discriminant network loss function value change (b) and generative network loss function value change.

CGAN model training situation: (a) discriminant network loss function value change and (b) generative network loss function value change.

GAN model training situation: (a) discriminant network loss function value change and (b) generative network loss function value change.
As can be seen from Figures 10 to 14, the fitting of each of the five models was satisfactory and no overfitting occurred, but there were differences between models, which are analyzed in Table 9. As can be seen from Table 9,
Semi-CGAN and semi-CGAN 23 have similar fitting effects in the discriminant network, but the former has a better fitting effect in the generative network, showing that the improved method proposed in this paper can better ensure the quality of the generated data.
The fitting effect of semi-GAN model is second to that of the semi-CGAN and the semi-CGAN 23 , but better than that of CGAN, showing that the quality of the generated data can be improved to some extent by adding classification conditions when semi-supervised.
The GAN model shows the worst fitting effect, indicating the traditional GAN has a large degree of freedom when no classification conditions and labels are defined, which makes it difficult to control the quality of the generated data.
During the test, the sample data obtained include welding current, electrode pressure and inter-electrode voltage. It can be seen from Table 7 that too few samples of unqualified spot welding joints will affect the training of model parameters and the classification effect in the later stage. Therefore, this article firstly uses the semi-CGAN to expand the number of unqualified spot welding joint samples. Here, the generate process of welding current sample data of four kinds of unqualified spot welding joints is only taken as an example to illustrate, and the results are shown in Figures 15 to 18.

Incomplete fusion joints data generate: (a) raw data and (b) generate data.

Cracks joint data generate: (a) raw data and (b) generate data.

Shrinkage joint data generate: (a) raw data and (b) generate data.

Spatter joint data generate: (a) raw data and (b) generate data.
Analysis of the fitting effect of the five models.

It can be seen from Figures 15 to 18 that, the similarity between real data and generated data is very high, indicating that the method proposed in this paper can better approximate the real data. By learning the distribution of real data, the method can generate similar data, thus effectively realizing the expansion of the sample data set.
Further, to compare the classification effects of the above five models, the process of generating 500 samples by each model was taken as an example in this paper for illustration. First, a GAN was employed to expand the joint sample datasets in each welding quality state. Next, the feature vector was acquired automatically by AE. The features selected in this paper to characterize the quality of spot welding include: welding current, the first-order difference, and the integral value; electrode pressure and the first-order difference; and inter-electrode voltage and the first-order difference, so the number of HMM model states observed M = 7. The corresponding matrix of observation symbols
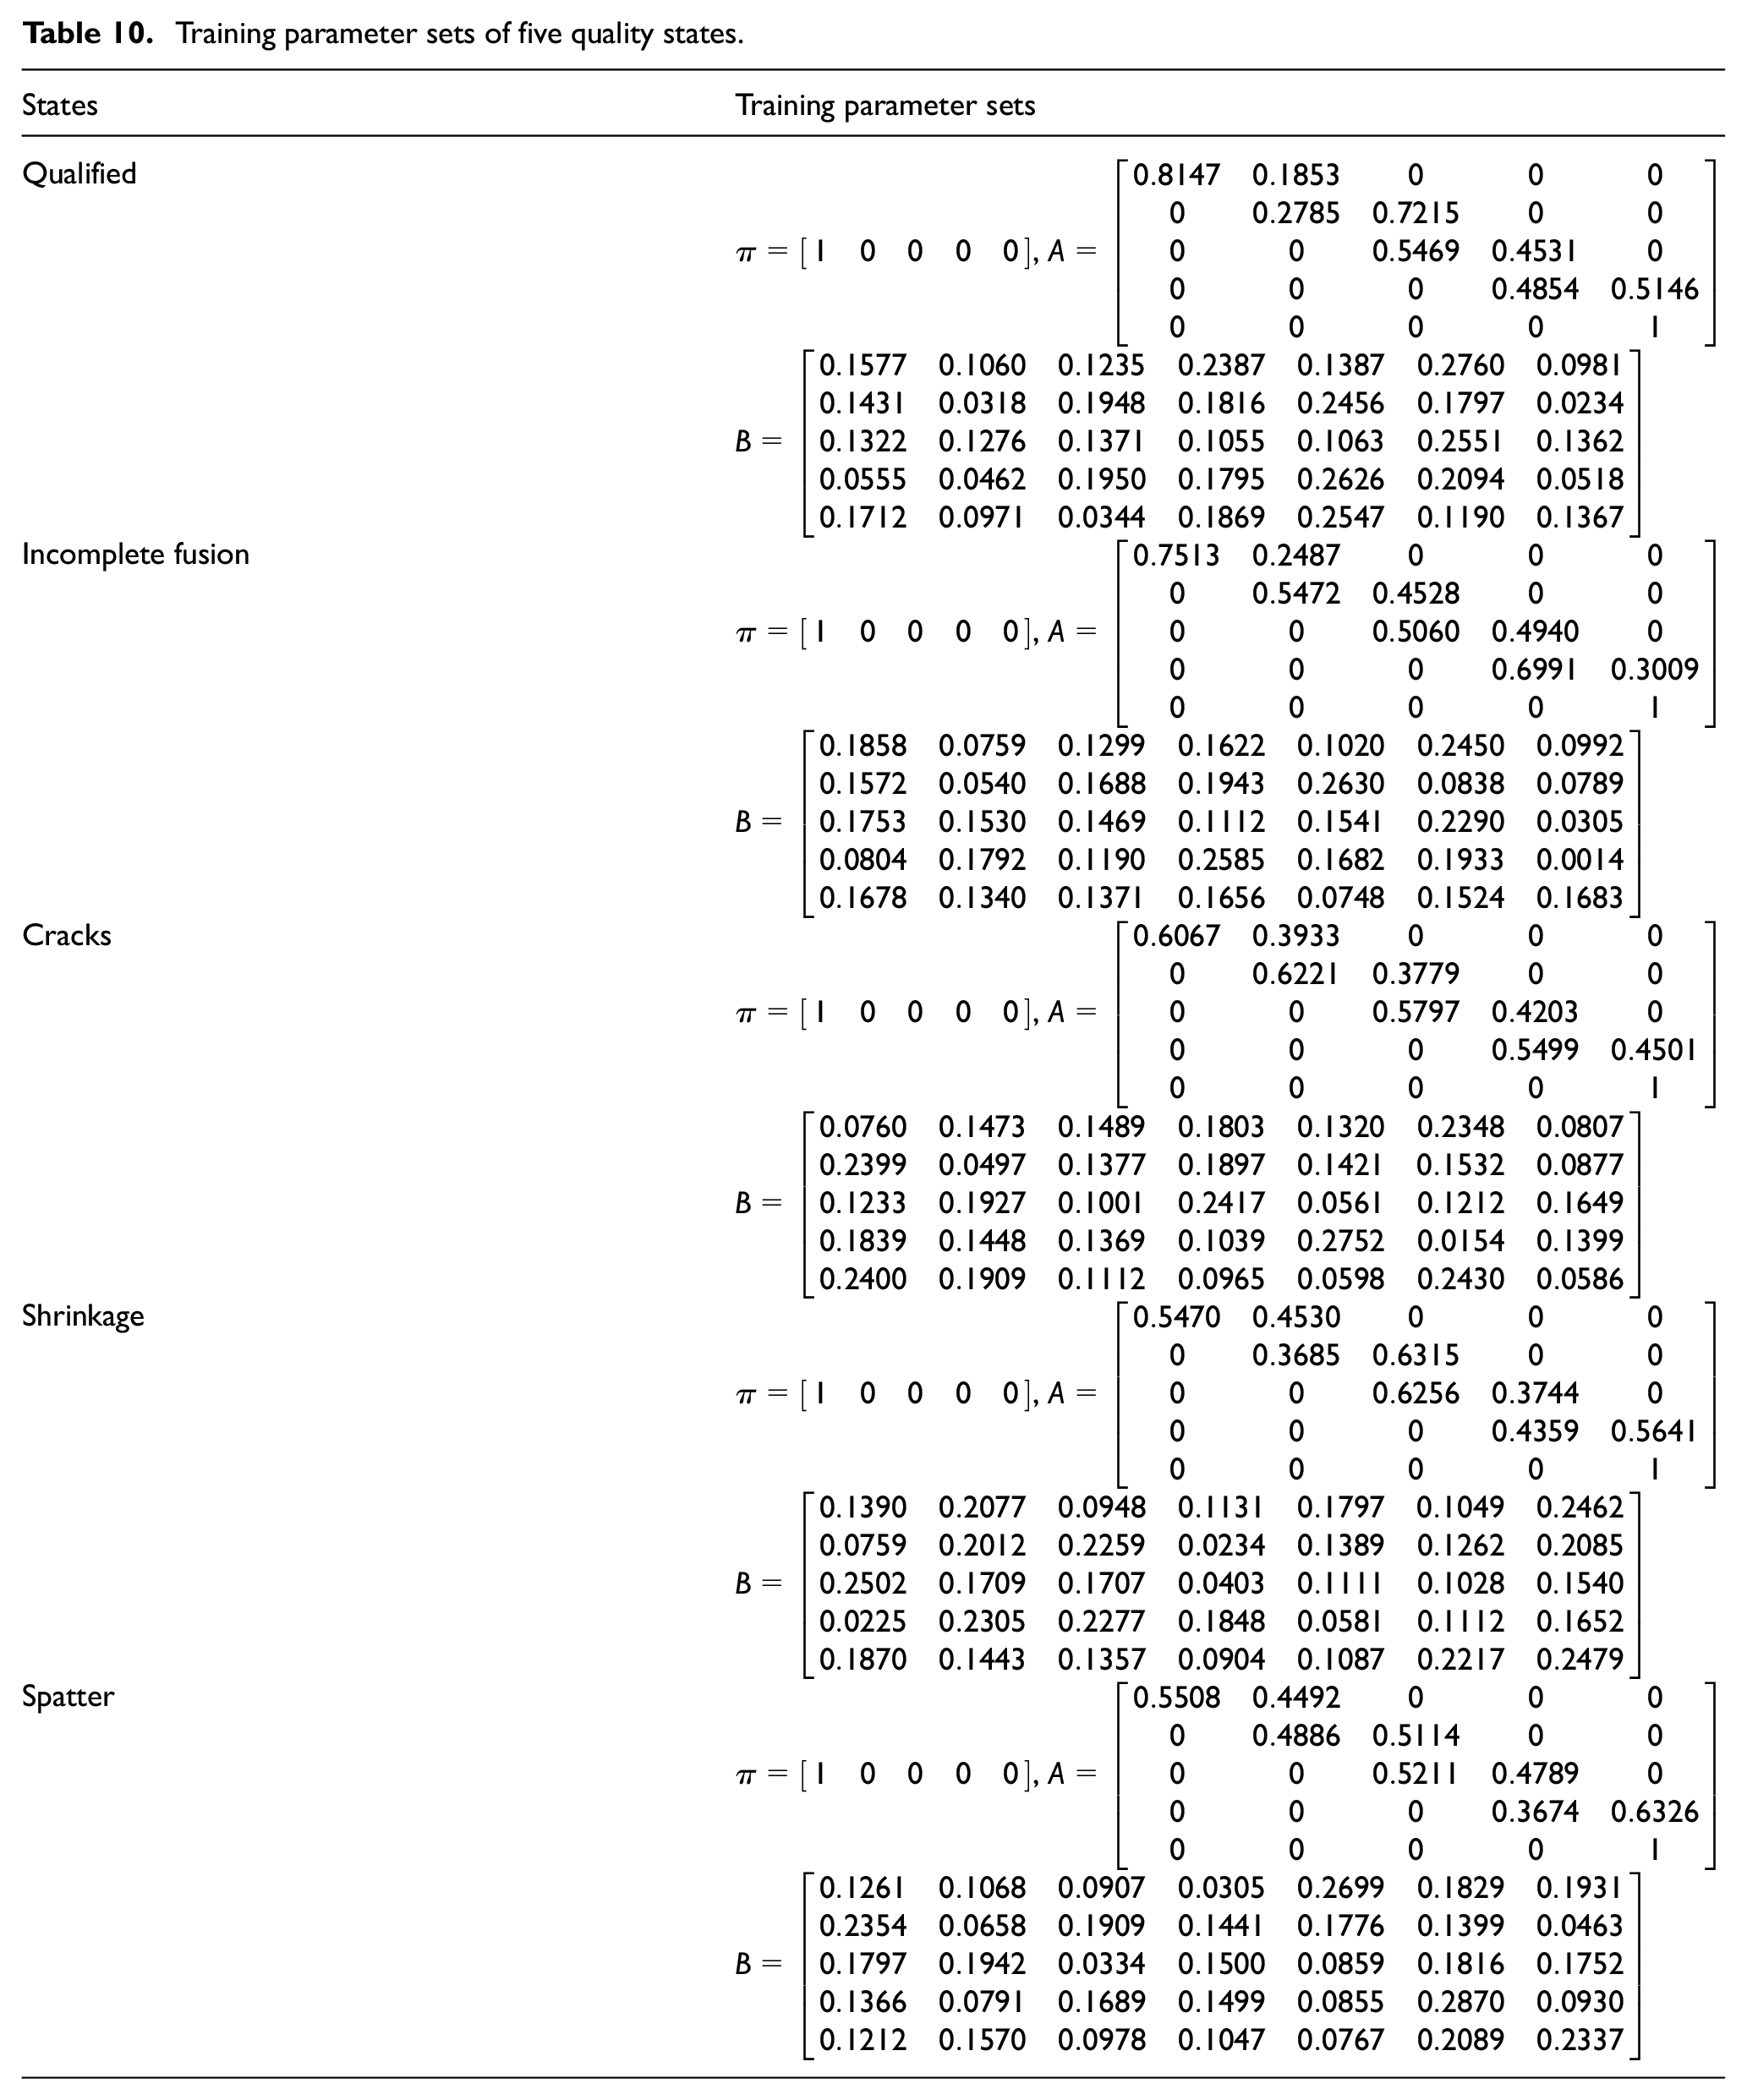
In order to extract richer and deeper features, it inputs the sample data of each kind of spot welding joints into the AE to obtain the corresponding feature vector set, and then inputs it together with the initial model parameters into the HMM to calculate the training parameter of the corresponding quality state, as shown in Table 10. At the same time, the test data and the training parameter set were input into the HMM, and the log-likelihood probability value for each quality state was calculated. The largest of them is represented in bold, and the results are shown in Table 11.
Training parameter sets of five quality states.
Log-likelihood probability values under different quality states (semi-CGAN).

It can be seen from Table 11 that the method proposed in this article can effectively realize the judgment of spot welding quality. Here, only the qualified solder joint is taken as an example to illustrate. The test data and the training parameter sets corresponding to the five quality states were input into the Viterbi algorithm, and the log-likelihood probability values were calculated, which were −43.5771, −80.9183, −71.2990, −89.3464, −65.9435, respectively, and the difference between them and the qualified solder joint was −37.3412. −27.7129, −45.7693, −22.3664, indicating that the classification results are ideal. Similar analysis can be carried out for the other four states, so the method proposed in this paper can realize the judgment of spot welding quality, and its classification effect is ideal.
In order to illustrate the effectiveness of the proposed algorithm (semi-CGAN), four deep models (semi-CGAN 23 , semi-GAN, CGAN, GAN) are introduced, and two shallow models (BPNN, HMM model) are added. The initial parameter settings are shown in Table 8.
The above seven methods are compared below from the model training time and the classification effect.
Training time
Aiming at the five spot welding quality states studied above, namely incomplete fusion, cracks, shrinkage, spatter and qualified, the time required for seven algorithms (semi-CGAN, semi- CGAN 23 , semi-GAN, CGAN, GAN, BPNN, HMM) to complete 500 sample training is compared. The result is shown in Figure 19. It can be seen from Figure 19,
The training time of deep network model (semi-CGAN, semi-CGAN, 23 semi-GAN, CGAN, GAN) is longer than that of shallow network model (BPNN,HMM).
In the deep network model, the time consuming of semi-CGAN and semi-CGAN 23 is close to each other, and it is the largest among the five models. Meanwhile, the training time of semi-GAN, CGAN, and GAN gradually decreases.
In the shallow network model, BPNN takes longer time than HMM.
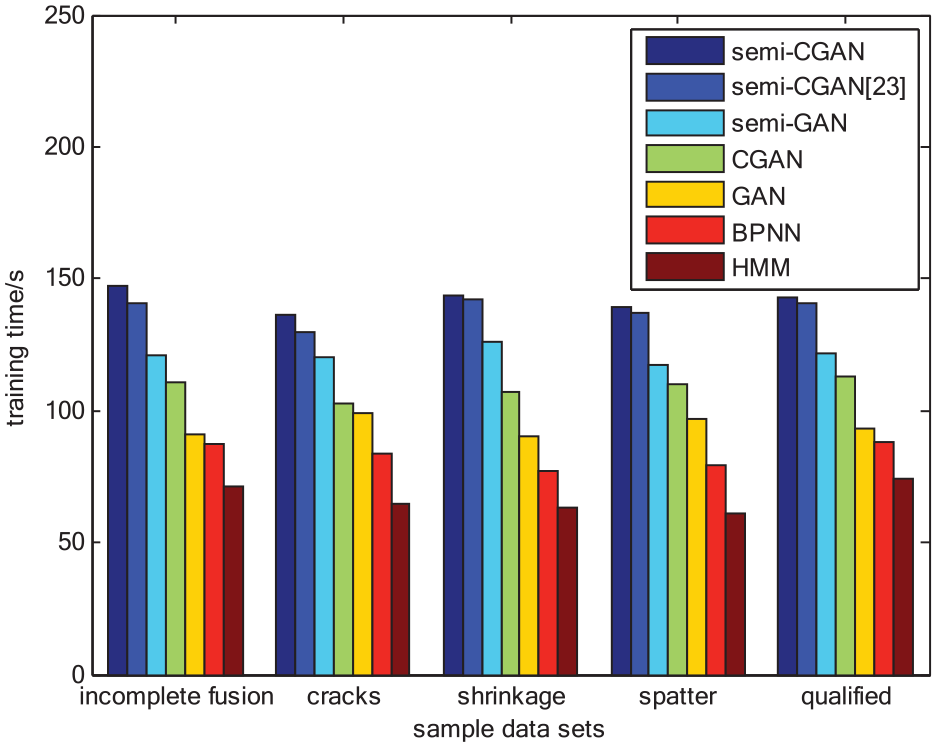
Comparison of training time of different classification algorithms.
The above analysis shows that the deep network model not only increases the network depth, but also increases the model training time, while the shallow network model has obvious advantages when the number of samples is not too large.
Further, 1000 samples (200 for each quality state) were used to test the above model, and the elapsed time was shown in Figure 20. It can be seen from Figure 20,
The deep network model (semi-CGAN, semi-CGAN, 23 semi-GAN, CGAN, GAN) spends less time on testing samples than the shallow network model (BPNN,HMM).
In the deep network model, semi-CGAN is slightly less than semi-CGAN, 23 and it is the least among the five models. Meanwhile, the training time of semi-GAN, CGAN, and GAN gradually increases.
In the shallow network model, BPNN takes slightly less time than HMM.

Test time comparison of different classification algorithms.
To sum up, the testing time of the deep network model is much shorter than that of the shallow network model, indicating that the former can quickly respond to the unknown state samples on the basis of the established model.
Classification effect
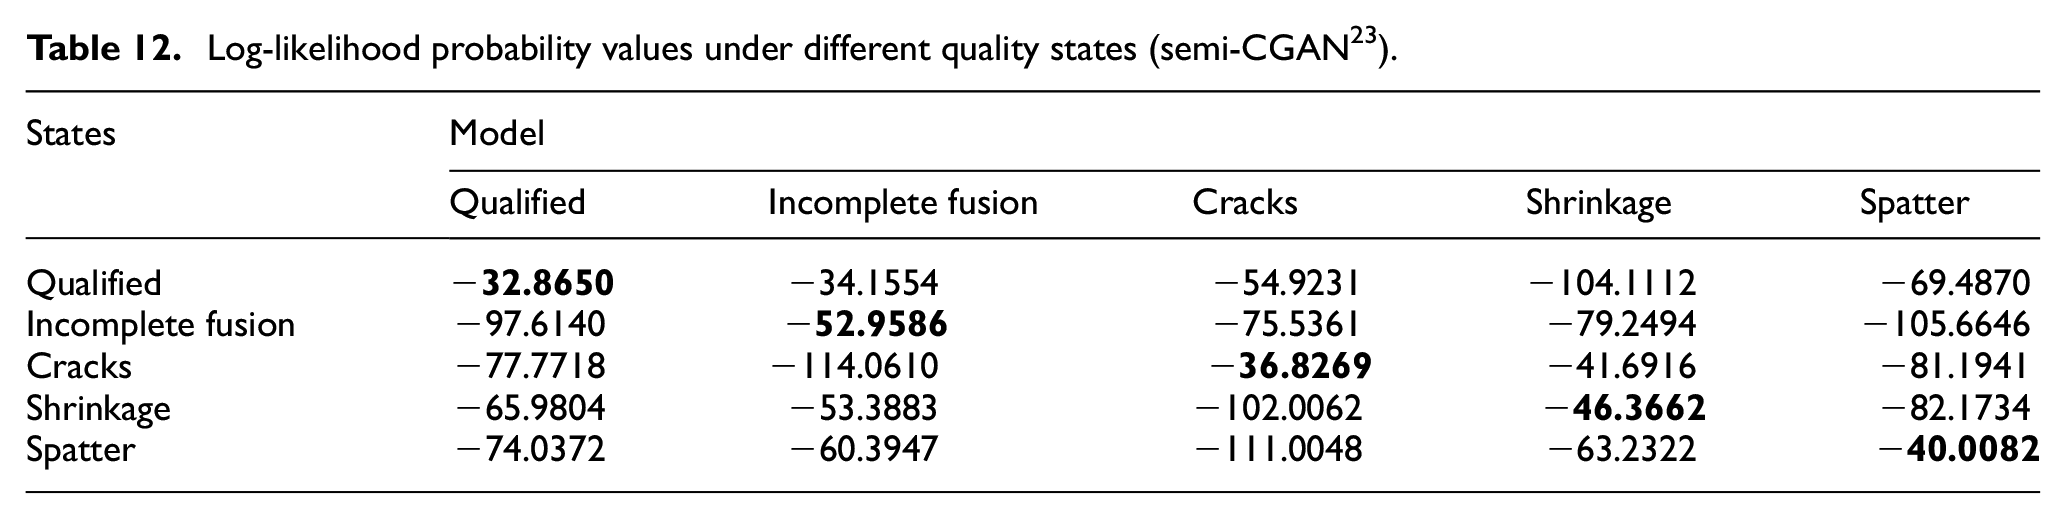
In order to illustrate the classification effect of the above algorithm, the training parameter set and test samples are input into the classifier, and the log-likelihood probability value of each quality state is calculated by Viterbi algorithm. Since the output result of BPNN is category label, rather than log-likelihood probability value, Therefore, only semi-CGAN, semi-CGAN 23 , semi-GAN, CGAN, GAN and HMM are analyzed here, and the largest of which is still represented in bold, as shown in Tables 12 to 16.
Log-likelihood probability values under different quality states (semi-CGAN 23 ).
Log-likelihood probability values under different quality states (semi-GAN).

Log-likelihood probability values under different quality states (CGAN).

Log-likelihood probability values under different quality states (GAN).

Log-likelihood probability values under different quality states (HMM).

From Tables 12 to 16, it can be seen that the above five classification models can realize the judgment of spot welding quality, as shown in:
The log-likelihood probability of the test samples under the current quality state is the largest of the five.
The log-likelihood probability values of test samples in each quality state are different, and the difference values are quite different.
To sum up, the above algorithm is ideal for spot welding quality classification.
The classification effect is shown in Table 17. As can be seen from Table 17, the spot welding quality can be judged by each of the five models, which is manifested by that the minimum value of the elements on the main diagonal of the five confusion matrices is 415. So the classification accuracy is 415/500 = 83%, indicating a good classification effect. However, misclassification still occurred and the classification effect varied between models, as shown by the following:
The minimum value of the elements on the main diagonal of semi-CGAN’s confusion matrix is 465, higher than the maximum value of the elements of semi-CGAN 23 , indicating that the former has a better classification effect.
The maximum value of the elements on the main diagonal of semi-GAN’s confusion matrix is 451, lower that the minimal value 465 of the elements of semi-CGAN and the minimal value 455 of the elements of semi-CGAN. 23 Meanwhile, the minimal value of the elements of semi-GAN is 442, higher than the maximum value 436 of the elements of CGAN and the maximum value 424 of the elements of GAN, indicating its classification effect is second to that of semi-CGAN and semi-CGAN, 23 but better than that of CGAN and GAN.
The maximum value of the elements on the main diagonal of GAN’s confusion matrix is 424, which is the lowest among the five models, indicating its classification effect is worse than the other four models.
Comparison of classification results of five models.

To sum up, it is not difficult to find that the semi-CGAN model proposed in this paper not only has a better fitting effect, but also realizes a high classification accuracy, indicating the proposed model is more desirable.
Conclusions
In the process of resistance spot welding of stainless steel sheets, the number of qualified welding joint samples acquired is far more than the number of unqualified ones. In addition, the quality states of a large number of welding joints are unknown and it would be expensive to mark them all. In view of this, a spot welding quality judgment method of stainless steel sheets based on semi-supervised conditional generative adversarial network was presented in this paper. The main innovations of this study were as follows: when generating the sample data, both labeled and unlabeled data were retained and mixed in a certain ratio to ensure the diversity of the generated data. During discrimination, only the generated data were used to compete with the unlabeled data in the joint sample datasets to ensure that the discriminant network had a large degree of freedom. The welding process of stainless steel sheets of railway carriage was selected as an example in this study for investigation, and the primary conclusions are as follows:
The model (semi-CGAN) proposed in this paper fits the data better than the other four models in the generative and discriminant networks.
The time spent on model parameter training of semi-CGAN is close to that of semi-CGAN 23 , but more than that of the other five models, on the contrary, the time spent on sample testing is minimal.
The minimal value of the elements on the main diagonal of semi-CGAN’s confusion matrix is 465 (the corresponding classification accuracy is 465/500 = 93%), higher than the maximum value 463 of the elements in semi-CGAN’s 23 confusion matrix, the maximum value 451 in semi-GAN’s confusion matrix, the maximum value 436 in CGAN’s confusion matrix, and the maximum value 424 in GAN’s confusion matrix.
In conclusion, the model proposed in this paper can not only achieve a better fitting to the sample data, but also ensure the classification effect of the model, so the model proposed in this paper is superior.
Footnotes
Handling Editor: Chenhui Liang
Declaration of conflicting interests
The author declared no potential conflicts of interest with respect to the research, authorship, and/or publication of this article.
Funding
The author received no financial support for the research, authorship, and/or publication of this article.