
Abstract
The effects of Cu and Mg contents on the thermal stability of 6XXX-series aluminum alloys was investigated using tensile testing, scanning electron microscopy, electron backscattered diffraction and transmission electron microscopy. Results showed that the thermal stability of 6XXX-series aluminum alloys improved with increasing Cu and Mg contents, and that the precipitate was the most important factor for thermal stability. In the alloy without Cu, the strengthening precipitates are mainly β″ phases. After heat holding at 150°C for 1000 hours, part of the β″ phases transformed into β′ phases and the number density of the β″/β′ phases decreased, leading to a major strength reduction. In addition to β″ phases, Q′ and L phases are the main strengthening precipitates for the alloys containing Cu. Q′ and L phases have higher thermal stability than the β″ phase, and the number density of the Q′ phases decreased slightly after heat holding, while that of the L phases barely changed. This resulted in Cu-containing alloys with higher thermal stability than Cu-free alloys. The L phase number density increases with increasing Mg content. Compared with the Q′ phase, the L phase has higher thermal stability, resulting in higher thermal stability for alloys with higher Mg content.
Introduction
The age-hardenable 6XXX-series (Al-Mg-Si(-Cu)) alloys with high specific strength, light weight, good corrosion resistance and excellent formability are used widely in the automotive industry.1–3 However, the strengths of some automobile parts that are in service at high temperatures may decrease, and this may even lead to safety problems and accidents. 4 In industry, it is usually a requirement that the attenuation of a component’s strength is less than 10% to ensure its safety after the component is held at 150°C for 1000 hours; this process is called thermal stability testing. Thermal stability is an important indicator of safety in automobile manufacturing and is mainly related to the microstructural changes that occur during the holding process, such as the formation of grain structures and precipitates.5–8 Therefore, it is necessary to clarify the relationship between the microstructure and the thermal stability of materials to guide the design of alloy compositions.
The precipitate is an important factor that affects the strength of 6XXX-series aluminum alloys. The following precipitation sequence has been proposed for Al-Mg-Si alloys without Cu addition: supersaturated solute solution (SSSS) → atomic clusters → Guinier-Preston (GP) zones →β″ (Al2Mg5Si4) →β′ (Mg9Si5) →β (Mg2Si). The β″ phase is regarded as the most effective precipitate in peak-aged Al-Mg-Si alloys, but it will coarsen and gradually transform into β′ and β phases during subsequent aging, which results in a reduction in the alloy’s strength.9,10 The following precipitation sequence has been proposed in Al-Mg-Si-Cu alloys: SSSS → atomic clusters → GP zones →β″(Al2Mg5Si4), Q′′, L → Q′, L → Q. Addition of Cu contributes to the formation of the Q′ and L phases, and these phases will gradually transform into the Q phase at high temperatures.11,12 However, the modes and difficulty levels of the transformations of these phases are different. The β″ phase in Al-Mg-Si alloys is easy to transform into the β phase at high temperatures, which leads to a significant reduction in alloy strength. It is relatively difficult for the L and Q′ phases that contain Cu to change into the Q phase, so they show higher thermal stability. 13 When compared with the Q′ phase, the L phase tends to exist with a disordered structure, meaning that it has a stable structure and demonstrates higher thermal stability than the β″ and Q′ phases.14,15
Many researchers have studied the relationships between alloy compositions and precipitates. Man et al. 16 and Xiao et al. 17 discussed the influence of the Cu content on the types and proportions of precipitates, and Kim et al. 18 and Zhong et al. 19 discussed the influence of the Mg content and the Mg/Si ratio on the proportions and compositions of precipitates in 6XXX-series aluminum alloys. Some studies have shown that increasing the Cu and Mg contents is beneficial for the formation of Cu-Mg atomic clusters during the early aging stage because of the strong attraction of the Cu and Mg atoms, which inhibits formation of the β″ phase but increases the number densities of the Q′ and L phases that contain Cu.20,21 However, the changes in the precipitates in alloys with different Cu and Mg contents that occur after long-term heat exposure remain unclear.
In this work, the thermal stability of 6XXX series aluminum alloys for automobile applications with various Cu and Mg contents was studied, and the mechanism by which the microstructure influences the thermal stability was clarified by characterizing the types, sizes and number densities of the precipitates before and after testing. This will be helpful in understanding the thermal stability of 6XXX series aluminum alloys.
Materials and Methods
Three hot-extruded Al-Mg-Si(-Cu) alloy profiles with a thickness of 3 mm were used in this work. The measured chemical compositions of these alloys are shown in Table 1. The extrusion temperature was 500–520°C, the extrusion speed was 5–6 m/minute and the extrusion ratio was approximately 28. The profiles were water-quenched at room temperature after extrusion and were then artificially aged at 175°C for 6 hours. After that, part of each profile was held at 150°C for 1000 hours.
Measured chemical compositions of the alloys (wt.%).

Three samples were taken from each alloy before and after heat holding. A diagram of the tensile sample configuration is shown in Figure 1. The samples were cut from the extruded profile along the direction of extrusion and tested using a tensile rate of 2 mm/minute.

Diagram of the tensile sample configuration (units: mm).
The grain microstructure was examined using a JSM-7900F scanning electron microscope (SEM; JEOL, Tokyo, Japan) with an Oxford Instruments electron backscattered diffraction (EBSD) detector (Symmetry EBSD detector, Oxford Instruments, Abingdon, UK). The samples for EBSD testing were electropolished in a solution of 10% perchloric acid with 90% ethanol. The residual particles and the fracture morphology were observed using a Zeiss EVO MA10 SEM (Carl Zeiss AG, Oberkochen, Germany). The Titan G2 60-300 transmission electron microscope (TEM; FEI Company, Hillsboro, OR, USA) was used to observe the precipitates and obtain bright field (BF) and high-resolution TEM (HRTEM) images and selected area electron diffraction (SAED) patterns. Foils for TEM observation were prepared by grinding the specimens to a thickness of approximately 80 μm and punching them into discs with a diameter of 3 mm. Twin-jet polishing was then used to polish the specimens down further to the appropriate thickness. The electrolyte was 30% nitric acid in methanol, and the polishing process temperature was kept below −25°C.
Results
Tensile properties
Figure 2(a) and (b) show the yields and ultimate tensile strengths of the three alloys before and after heat holding. As the Cu and Mg contents increase, the yields and ultimate tensile strengths of the alloys also gradually increase. Before heat holding, the yield strengths of alloys 1#, 2# and 3# are 275.1 ± 3.5, 288.6 ± 2.7 and 295.7 ± 4.1 MPa, and their ultimate tensile strengths are 289.7 ± 2.7, 306.8 ± 3.8 and 309.5 ± 3.2 MPa, respectively. After heat holding, the yield strengths and the ultimate tensile strengths of the three alloys decrease, where the yield strengths are 236.0 ± 1.5, 276.4 ± 2.4 and 289.8 ± 2.9 MPa, and the ultimate tensile strengths are 257.3 ± 3.1, 291.8 ± 3.5 and 301.1 ± 1.9 MPa, respectively.

Tensile parameters of the three alloys before and after heat holding: (a) yield strength; (b) ultimate tensile strength; (c) elongation; (d) strength reduction.
Figure 2(c) compares the elongations of the three alloys before and after heat holding. The elongations of all three alloys decrease after heat holding, increase with increasing Cu content and show little change with increasing Mg content. The elongations of the three alloys are 9.5%, 11.5% and 11.3% before heat holding, and 7.9%, 10.3% and 10.0% after heat holding, respectively.
Figure 2(d) shows the reductions in the strengths of the three alloys after heat holding. When the Cu and Mg contents increase, the strength reduction decreases gradually. The reductions in the yield strengths of the three alloys are 14.2%, 4.2% and 2.0%, and the reductions in their ultimate tensile strengths are 11.1%, 4.9% and 2.7%, respectively. This suggests that the thermal stability of these alloys improves with increasing Cu content, and improves further with increasing Mg content.
Fractography
SEM images of the fracture morphologies of the three alloys before and after heat holding are shown in Figure 3(a), (c) and (e) and in Figure 3(b), (d) and (f), respectively. The fracture modes of the alloys are mixed fractures composed of combinations of intergranular and transgranular dimple fractures. Alloy 1# is dominated by the intergranular fracture mode, as shown in Figure 3(a) and (b). The intergranular fracture areas are 62.5 ± 5.5% and 74.1 ± 6.3%, while the dimple densities are 2453 ± 356 and 1865 ± 275 mm−2 before and after heat holding, respectively. With increasing Cu and Mg contents, the fracture modes of alloys 2# and 3# are dominated by the transgranular dimple fracture mode, as shown in Figure 3(c) to (f). The intergranular fracture areas of alloy 2# are 29.8±7.1% and 42.3±4.6%, while those of alloy 3# are 33.6 ± 4.2% and 45.2 ± 6.5% before and after heat holding, respectively. The dimple densities of alloy 2# are 5862 ± 714 and 3985 ± 596 mm−2, while those of alloy 3# are 5211±819 and 3625±472 mm−2 before and after heat holding, respectively. This indicates that the ductility decreases for all three alloys after heat holding and improves with increasing Cu content, but it has little relation to the Mg content.

SEM images of fracture morphologies of alloys before and after heat holding: (a), (b) alloy 1#; (c), (d) alloy 2#; and (e), (f) alloy 3#.
Microstructure
Grain structure
The EBSD results show that the grain structures of the alloys before and after heat holding are almost identical. Figure 4(a), (c) and (e) and Figure 4(b), (d) and (f) show the inverse pole figures (IPFs) and the recrystallized fraction maps for the three alloys before heat holding, respectively. In Figure 4(a), (c) and (e), the black lines represent the high angle grain boundary (HAGB; >15°) and the white lines represent the low angle grain boundary (LAGB; 2–15°). The grain sizes and the length proportions of the HAGBs of these alloys are similar. The grain sizes of alloys 1#, 2# and 3# are 152.6 ± 61.8, 142.8 ± 58.8 and 146.9 ± 74.9 μm, and the length proportions of the HAGB are 92.3 ± 4.5%, 87.4 ± 8.2% and 89.6 ± 5.1%, respectively. In Figure 4(b), (d) and (f), the recrystallized grains, substructures and deformed structures are shown in blue, yellow and red, respectively. The recrystallization area fraction is more than 90%, while the substructure and deformed structure fractions are both less than 10% in all the alloys. This result indicates that all the alloys have a high degree of recrystallization.

IPFs and recrystallized fraction maps for three alloy types: (a), (b) alloy 1#; (c), (d) alloy 2#; and (e), (f) alloy 3#, respectively.
The orientation distribution function (ODF) diagrams based on EBSD test results for the Euler angles PHI2=0°, 45°and 65° of the three alloys are shown in Figure 5. The typical textures of the aluminum alloys and their positions in the ODF diagram are shown in Figure 5(a). There are no significant differences between the texture types of the three alloys, and the recrystallization Cube texture is the main texture, as shown in Figure 5(b) to (d). These results prove that the grain structures of the three alloys are similar.

Orientation distribution function diagrams for PHI2=0°, 45°and 65°: (a) typical texture; (b) alloy 1#; (c) alloy 2#; and (d) alloy 3#.
Residual particles
SEM images of the residual particles in the alloys before and after heat holding are shown in Figure 6(a), (c) and (e) and Figure 6(b), (d) and (f), respectively. The sizes of the residual phases are similar in all the alloys, and the area fraction increases slightly with increasing Cu and Mg contents, but it shows little change before and after heat holding. The average lengths of the residual particles in the three alloys are 2.56 ± 0.87, 2.44 ± 0.91 and 2.63 ± 1.04 μm before heat holding, and 2.61 ± 0.69, 2.40 ± 0.74 and 2.51 ± 0.85 μm after heat holding, while the average widths are 1.15 ± 0.56, 1.21 ± 0.61 and 1.11 ± 0.44 μm before heat holding, and 1.21 ± 0.42, 1.18 ± 0.51 and 1.15 ± 0.65 μm after heat holding, respectively. The area fractions are approximately 1.05 ± 0.11%, 1.18 ± 0.16% and 1.24 ± 0.09% before heat holding, and 1.07 ± 0.11%, 1.22 ± 0.16% and 1.20 ± 0.09% after heat holding, respectively.
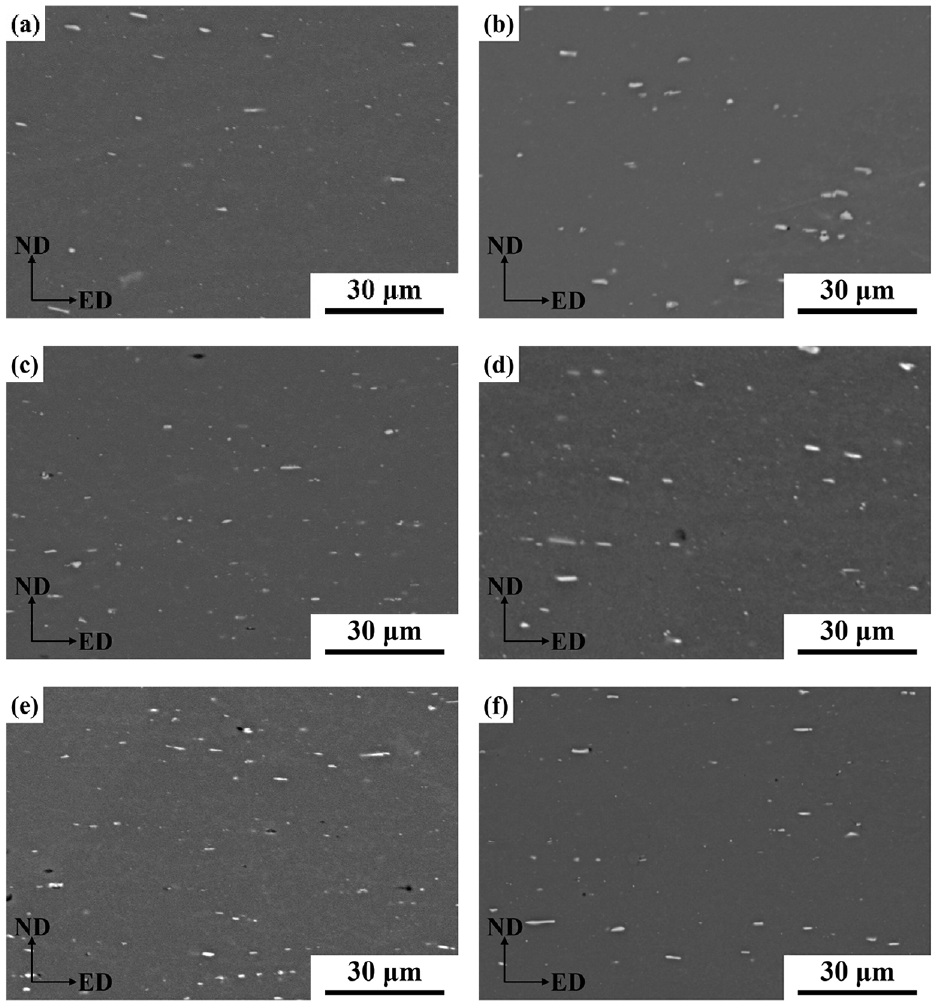
SEM images of alloys before and after heat holding: (a), (b) alloy 1#; (c), (d) alloy 2#; and (e), (f) alloy 3#.
Precipitates
The TEM images and the SAED patterns along the <100> Al directions of the three alloys before and after heat holding, and the HRTEM images and fast Fourier transformation (FFT) patterns of the typical precipitates are shown in Figure 7. The precipitate types can be identified from the SAED or FFT patterns and the HRTEM images. The characteristics of the precipitates in each of the alloys were analyzed based on the TEM images, and the results are shown in Table 2.

TEM images and SAED patterns of the alloys before and after heat holding: (a) alloy 1# at 0 hours; (b) alloy 1# at 1000 hours; (c) alloy 2# at 0 hours; (d) alloy 2# at 1000 hours; (e) alloy 3# at 0 hours; and (f) alloy 3# at 1000 hours. HRTEM images and FFT patterns: (b1) β′ phase; (c1) Q′ phase; and (c2) L phase.
Precipitate characteristics of the alloys before and after heat holding.
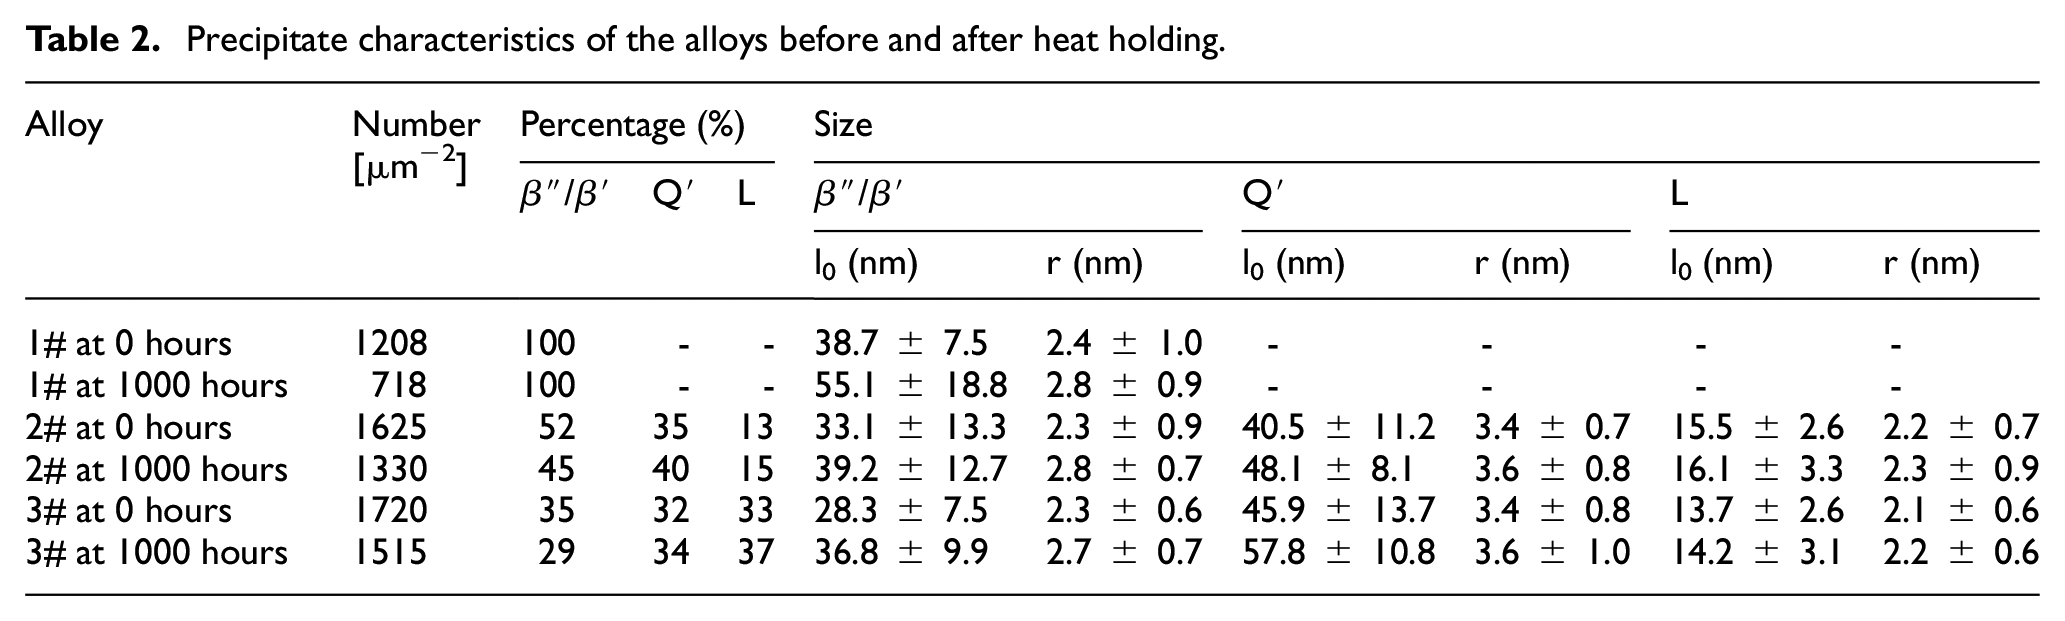
The main precipitate of alloy 1# without Cu is the β″ phase before heat holding, as shown in Figure 7(a). The β″ phase is the main strengthening precipitate in the 6XXX-series aluminum alloys and is coherent with the Al matrix. This phase is always distributed along the {001}Al crystal face and grows in the <100>Al direction. 22 After heat holding, we found that there were both β″and β′ phases in alloy 1#, as shown in Figure 7(b); the HRTEM image of the β′ phase is shown in Figure 7(b1). This indicates that part of the β″ phase is transformed into β′ phases after heat holding, which is a recognized phenomenon in the study of 6XXX-series aluminum alloys.9,10 The β′ phase has a similar morphology to and an orientation relation with the β″ phase, but its strengthening effect is weaker than that of the β″ phase. The number density of the β″/β′ phases decreases by 40.6%, while the average length increases by 42.4%, and the radius also increases slightly, as shown in Table 2.
When the Cu content increases, the number density of the precipitates in alloy 2# before heat holding is 45.5% higher than that in alloy 1#, as shown in Figure 7(c) and Table 2. The Q′ and L phases are found in alloy 2# in addition to the β″ phase, and account for 35% and 13% of all the precipitates, respectively. These two phases are important strengthening precipitates and their HRTEM images are shown in Figure 7(c1) and (c2), respectively. The Q′ phase is usually semi-coherent with the Al matrix, and its orientation relationship with the matrix is either [1000]Q′//[001]Al or
As the Mg content increases, the number density of the precipitates in alloy 3# before heat holding increases further by 5.8% when compared with alloy 2#. The number density of the Q′ phases changes little, but the number density of the L phases increases significantly, and its proportion is increased from 13% to 33%, as shown in Figure 7(e) and Table 2. After heat holding, the number densities of the β″/β′ phases and Q′ phases decrease by 37.1% and 6.0%, and their average lengths increase by 30.0% and 25.9%, respectively, while the number density and the size of the L phases show no change, as illustrated in Figure 7(f) and Table 2. The variation trends in the number density and the size of the precipitates in alloy 3# are similar to those in alloy 2# after heat holding.
Discussion
In the work above, we proved that the grain structures and the residual phases in the alloys with the different Cu and Mg contents remain similar after long-term heat holding. This indicates that both the grain and the residual phase show good thermal stability, so they have little effect on the strength reduction. However, the types and number densities of the precipitates of the alloys with the different Cu and Mg contents are different, and the changes in these precipitates are very obvious after long-term heat holding. Therefore, we believe that the differences and change in the precipitates are the main factors in the thermal stability of the strength.
It is generally believed that the β″/β′, Q′ and L phases have prominent effects on the strength, and a reduction in the number density of these precipitates or transformation from the β″ phase into the β′ phase will reduce the strength of the 6XXX-series aluminum alloy.4,5 After heat holding, part of the β″ phase is transformed into the β′ phase and the number densities of alloys 1#, 2# and 3# decrease by 40.6%, 29.2% and 37.1%, respectively. This change leads to a reduction in the yield and in the ultimate tensile strength. However, in addition to the β″ or β′ phases, the Q′ and L phases are the main precipitates of alloys 2# and 3# before heat holding, and the changes in these precipitates after heat holding are thus worthy of discussion. After heat holding, the number densities of the Q′ phases in alloys 2# and 3# decrease by 6.5% and 6.0%, respectively. This suggests that the effect of the Q′ phase on the strength reduction is less than that of the β″ phase. The L phase does not affect the strength reduction because its number density and size barely change. Therefore, the relative effect of the precipitates on the strength reduction is β″ > Q′ > L.
Before heat holding, the main precipitates in alloy 1# are β″ phases only, and thus the yield and the ultimate tensile strength of alloy 1# decrease significantly by 14.2% and 11.2%, respectively. The number densities of the Q′ phases in alloys 2# and 3# are similar, but the number density of the L phases in alloy 3# is higher than that in alloy 2#. Therefore, the strength of alloy 2# is more susceptible than that of alloy 3#. As a result, the yield and the ultimate tensile strength of alloy 2# decreased by 4.2% and 4.7%, while the yield and the ultimate tensile strength of alloy 3# only decreased by 2.0% and 2.7%, respectively.
The types and the number densities of the precipitates before heat holding are determined by the alloying elements. Al-Mg-Si alloys mainly form Mg-Si clusters during the early aging stage, and these clusters then transform into β″ phases during subsequent aging. However, because of the strong binding force between the Cu atoms and Mg atoms, the Cu atoms will combine with the Mg atoms during early aging and form Mg-Si-Cu clusters in the Al-Mg-Si-Cu alloys. These clusters then transform further into Q′ and L phases during subsequent aging.23,24 Furthermore, addition of Cu is beneficial for refinement of the clusters and increases their number density. 21 Therefore, the number densities of the precipitates of alloys 2# and 3#, which contain Cu, are higher than that of alloy 1#. An increase in the Mg content is positive for transforming these clusters into L phases during aging, while inhibiting the formation of the β″ phases. 20 Therefore, the number densities of the L and β″ phases in alloy 3# are the largest and the smallest, respectively.
The different changes in the precipitates that occur during long-term heat holding are related to their individual structures. Research has shown that a low-density cylinder (LDC) substructure exists in the β″ phases, and that the Cu-containing zone (CCZ) substructure exists in both the Q′ and L phases. The covalent bonds of the LDC substructure are easy to change at high temperatures because of their weak binding force, which means that the β″ phase has the lowest thermal stability and is easy to transform into the β′ phase. However, the Cu-Si covalent bonds of the CCZ substructure have a strong binding force, and their fine structural stability makes them difficult to transform during heat holding.13,12,25 Therefore, the thermal stabilities of the Q′ and L phases containing Cu are higher than that of the β″ phase. In addition, Cu atoms tend to concentrate on the interface between the Q′ phase and the matrix because of their low diffusion rate. This has a negative effect relative to the transformation of the Q′ phase, and thus the thermal stability of the Q′ phase improves.16,26 In addition to the Cu-Si covalent bond in the CCZ substructure, most of the atoms in the L phase are mainly connected via metal bonds and escape easily from the single cell. Therefore, the L phase is more difficult to change and transform into the Q phase when compared with the Q′ phase, which means that its thermal stability is highest.13,14
In conclusion, the reductions in the strengths of alloys 1#, 2# and 3# decrease gradually with increasing Cu and Mg contents. The main precipitates of alloy 1# are the β″ phases, which have the worst thermal stability before heat holding, and thus the strength of alloy 1# shows the greatest reduction. The Q′ and L phases with the better and best thermal stabilities in alloys 2# and 3# inhibit the strength reduction significantly. Furthermore, the strength reduction of alloy 3# is the smallest because the alloy contains the highest amount of the L phase.
Conclusions
(1) With increasing Cu and Mg contents, the thermal stabilities of alloys 1#, 2# and 3# gradually increase. After heat holding at 150°C for 1000 hours, the yield strengths of these alloys decrease by 14.2%, 4.2% and 2.0%, and their ultimate tensile strengths decrease by 11.2%, 4.7% and 2.7%, respectively.
(2) The precipitate is the most important factor in the thermal stability of each alloy. After heat holding, part of the β″ phases transform into β′ phases, and the number density of the β″/β′ phases decreases significantly. The number density of the Q′ phases decreases and the size increases slightly. The number density and size of the L phases show little change. As a result, the thermal stability of the precipitates is L > Q′ > β″.
(3) With increasing Cu and Mg contents, the number density and the proportion of the β″ phases in the alloy decrease, and the number densities and proportions of the Q′ and L phases increase, which leads to improvement in the thermal stability of the alloy.
Footnotes
Handling Editor: Chenhui Liang
Declaration of conflicting interests
The author(s) declared no potential conflicts of interest with respect to the research, authorship, and/or publication of this article.
Funding
The author(s) disclosed receipt of the following financial support for the research, authorship, and/or publication of this article: This work was financially supported by Kam Kiu Aluminium Products Group Limited, the Key Project of Basic and Applied Basic Research in Jiangmen (grant number 2021030103880007450), and the 2020 Jiangmen Innovation Practice Postdoctoral Research Project (grant number JMBSH2020C07).
Institutional Review Board Statement
Not applicable for studies not involving humans or animals.
Informed Consent Statement
Informed consent was obtained from all subjects involved in the study.
Data Availability Statement
The data presented in this study are available on request from the corresponding author. The data are not publicly available because they involve some confidential information about Kam Kiu Aluminium Products Group Limited.