
Abstract
Kurtogram is a typical fault diagnosis algorithm, and its derivative methods are widely used in bearing fault signal processing. The key to such methods is to select the indexes that are specifically sensitive to periodic fault characteristics. The traditional time domain kurtosis index is too sensitive to non-periodic transient impulses, and the frequency domain index is too sensitive to harmonic components, which seriously affects the selection of resonance frequency band and the extraction of fault features. In view of this, a polynomial detrended autocorrelation kurtosis of 1.5D spectrum is proposed in this paper. Firstly, the original signal is decomposed by wavelet packet decomposition, and the 1.5D spectrum of each subband signal is calculated. Then, the 1.5D spectral autocorrelation coefficient of each subband is calculated, and the trend term is removed from the specific interval of autocorrelation coefficient by polynomial fitting. Finally, the kurtosis of the autocorrelation coefficient after removing the trend term is calculated to select the optimal resonance frequency band for analysis, so as to extract the fault feature information. The experimental data show that this method is sensitive to the fault characteristic frequency and frequency doubling with coupling relationship, and can suppress non-periodic transient impulse and harmonic interference.
Introduction
Bearing is one of the most widely used and highest failure rate components in rotating mechanical equipment. It is of great significance to monitor its running state. Many researches use signal processing methods, especially vibration signal processing methods to extract bearing fault features,1–5 among which resonance demodulation algorithm is a typical method.
Resonance demodulation signal processing methods need to solve two core problems.6–8 One is the reasonable division of frequency band through excellent signal decomposition methods in order to achieve the optimal sparsity. On the other hand, it is necessary to construct an index sensitive to the periodic impulse characteristics of bearing faults in order to select the optimal subband. Based on these two parts, many analysis methods are proposed. Among them, kurtogram algorithm and many derived algorithms are a kind of typical signal processing methods, which are widely used in bearing fault signal processing.9–11 Aiming at the problem of band division, Lei et al. 12 used wavelet packet decomposition instead of FIR filter, so as to make band division have good sparsity and improve the effect of band division. In order to better determine the resonance frequency band, Tse and Wang13,14 proposed a sparsogram method, and improved the algorithm by using genetic algorithm to deal with the situation that the fault resonance frequency band can be divided into two adjacent non ideal orthogonal frequency bands. In order to overcome the non-periodic transient impulse interference in the time domain, Antoni 15 constructs the envelope spectrum negative entropy index defined in the frequency domain, and constructs SEgram, SESgram and SE/SESgram algorithms. Li et al. 16 fused the negative entropy in time domain, negative entropy in frequency domain and multi-scale clustering to construct a multiscale clustering green infogram method. Guo et al. 17 proposed a fault diagnosis scheme based on optimized wavelet packet denoising and modulation signal bispectrum. The scheme uses the transient pulse enhancement of wavelet packet denoising and the demodulation ability of modulation signal Bispectrum to diagnose bearing faults more accurately. Song et al. 18 combined kurtogram with PCA to construct p-kurtogram method. This method extracts multiple weak fault features from multiple envelope signals based on principal component analysis. Compared with extracting features from one envelope signal of fast kurtogram, p-kurtogram has better demodulation performance for multiple faults. Sheng et al. 19 used the variable window characteristics of the order statistics filter and the minimum spectral segmentation method to obtain the multi-level spectral segmentation filter bank. Using the filter, the basic framework of kurtogram was improved. Through the unrestricted filtering characteristics of the improved algorithm, the reconstruction and extraction of the composite spectral boundary were realized. Hu et al. 20 proposed a new adaptive bearing fault detection method based on spectral kurtosis. This method designed a series of morphological filters with different scales, calculated the maximum distribution plane and the optimal threshold of the generated maximum distribution plane. Then, the decomposition boundary and the number of decomposition modes are adaptively determined based on the processed signal, and a filter bank based on Meyer wavelet is constructed to decompose the processed signal. Moshrefzadeh and Fasana 21 constructed an Autogram algorithm by using the time domain autocorrelation kurtosis of wavelet packet subbands, and introduced it into the field of bearing fault diagnosis. This method can suppress random interference components that do not have coupling relations in the time domain. Afia et al.22,23 have made appropriate improvements on the basis of Autogram and combined the extracted features with neural network to achieve intelligent diagnosis of rotating machinery equipment.
To solve the limitation of Kurtogram algorithm and Autogram algorithm in dealing with multiple non-periodic transient impulse components and harmonic components, a new statistical feature calculation method for subbands is proposed in this paper. In this method, the frequency band is segmented by wavelet packet decomposition, and the 1.5D spectrum is calculated for each subband to enhance the spectrum characteristics. Then, the autocorrelation analysis of the specific frequency band spectrum is carried out to enhance the components with coupling relationship and weaken the components without coupling relationship, so as to determine the optimal subband and realize the effect of feature extraction.
The outline of this paper is as follows. Section 2 introduces the theory and process of the proposed algorithm. Section 3 discusses the advantages of the proposed method compared with Kurtogram and Autogram methods in dealing with multiple non-periodic transient impulse components and harmonic interference through simulated signals. Section 4 verifies the effectiveness and superiority of the proposed method by using the data of QPZZ-II rotating machinery fault test bench and CWRU test bench.
Theoretical framework of the proposed method
Kurtogram based on WPT
The frequency band division and reconstruction method used in this paper is a typical kurtogram method using wavelet packet decomposition. 12 The specific construction process is as follows.
If signal
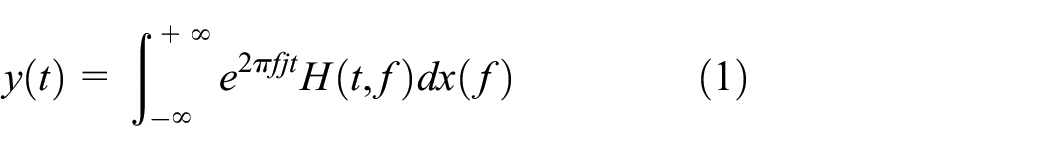
where
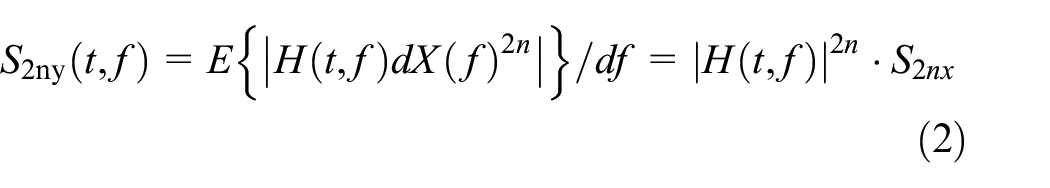
The 2-order instantaneous moment of
Equation (3) represents the result when


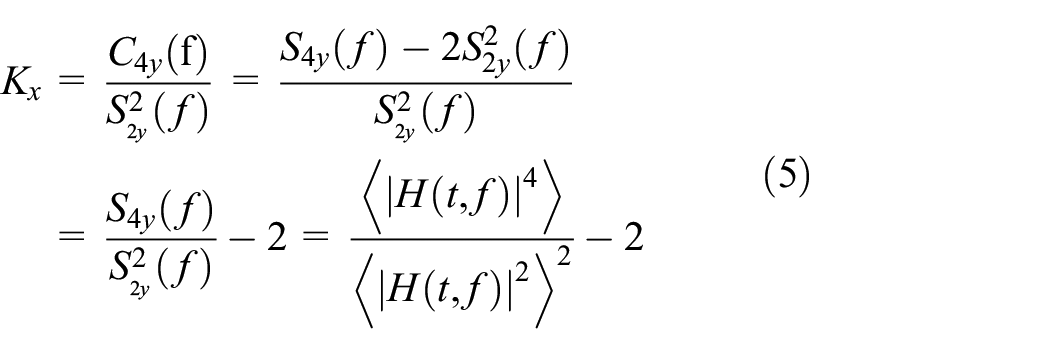
According to equations (3) and (4), the spectral kurtosis can be defined as equation (5):
The original signal is decomposed by wavelet packet, which can be expressed by equation (6), and then the spectral kurtosis of each subband after decomposition is calculated.

Wavelet packet can be regarded as a group of tree filter banks, where

Wavelet coefficients after wavelet packet decomposition can be expressed by equation (8). In fact, each wavelet packet coefficient corresponds to different frequency bands of the original signal frequency band.

The signal is reconstructed by using wavelet packet coefficients, and then the kurtosis of each wavelet packet subband is calculated, which is equivalent to calculating the kurtosis value of different frequency bands in the frequency domain (Figure 1) and then the subband signal with the largest kurtosis value is selected for analysis. This subband is considered to contain the most abundant fault impact components.

Kurtogram based on WPT.
1.5D spectrum
If

where
Then, the diagonal slice is calculated for the third-order cumulant

The 1.5D spectrum of the diagonal slice of the third-order cumulant of the wavelet packet subband signal can be expressed by equation (11).

The 1.5D spectrum has a good suppression effect on Gaussian noise and is suitable for analyzing non-stationary signals.
Process of autocorrelation and trend term removal based on polynomial fitting
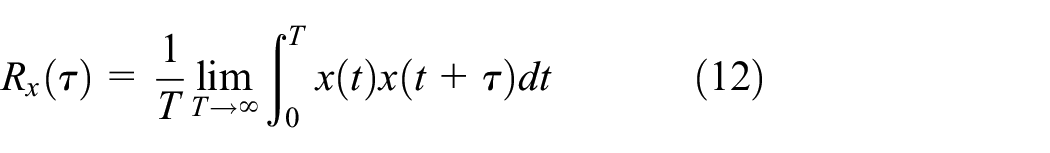
The autocorrelation coefficient describes the relationship of the same signal at different times, which can be expressed by equation (12).
Equation (12) is the autocorrelation analysis of time domain signal

Since the autocorrelation coefficient
The 1.5D spectral signal is

where
All sampled data can be calculated as shown in matrix relationship equation (15).

where
The undetermined coefficient

Calculate the partial derivative of

When the partial derivative is 0, the sum of squares of the errors is taken as the minimum, and the polynomial coefficients can be expressed by equation (18).

The result after removing the trend term can be expressed as shown in equation (19).

The proposed diagnosis scheme
The steps of the proposed method are shown in Figure 2 as follows:
(1) The collected original vibration signal is decomposed by j-layer wavelet packet, and each wavelet packet coefficient is reconstructed, so as to segment the whole frequency band.
(2) The 1.5D spectrum of each wavelet packet subband is calculated. Further, the 1.5D spectrum sequence is regarded as a generalized time series, and its autocorrelation coefficient is calculated.
(3) The trend term of autocorrelation coefficient of 1.5D spectrum is removed by polynomial fitting method to obtain a smooth autocorrelation coefficient sequence.
(4) By calculating the kurtosis of the smooth autocorrelation coefficient in step (3), the optimal wavelet packet subband can be selected, and the envelope spectrum of the subband is analyzed to obtain the fault characteristic frequency.

Flowchart of the proposed algorithm.
Simulated analysis
The proposed method can accurately extract the periodic impulse characteristics caused by bearing faults. In order to verify the effectiveness of the proposed method, the bearing fault components and two common interference components are analyzed by simulation. The fault signal is a periodic impulse signal (

where
Parameters of the simulated signal.

The periodic impulse components (

(a) The periodic impulse components of
The non-periodic transient impulse components are shown in Figure 4(a), and its 1.5D spectrum is shown in Figure 4(b). As can be seen from Figure 4(b), there is no characteristic frequency component in the 1.5D spectrum, and the impulse energy in the time domain is suppressed. Figure 4(c) shows the autocorrelation coefficient of the 1.5D spectrum and the process of removing the trend term. Since there is no characteristic frequency and frequency doubling with coupling relationship in the 1.5D spectrum, the autocorrelation coefficient is relatively smooth. It can be seen that the non-periodic transient impulse components in the time domain are greatly suppressed by this method.

(a) The non-periodic transient impulse components of
The harmonic components and their 1.5D spectrum are shown in Figure 5(a) and (b), respectively. Harmonic components will introduce a single spectral line into the spectrum, which often affects the statistical characteristic index in frequency domain. Autocorrelation analysis is performed on the 1.5D spectrum and polynomial fitting is used to remove the trend term. The results are shown in Figure 5(c). Because the harmonic spectrum components have no coupling relationship, the autocorrelation coefficient is relatively smooth, which is equivalent to restraining the interference introduced by harmonics in the frequency domain.

(a) The harmonic components of
Based on the contents in Figures 3 to 5, it can be concluded that the method proposed in this paper can highlight the periodic impulse components, suppress the non-periodic transient impulse components and harmonic components, so as to achieve the purpose of extracting useful fault information from the interference components.
For further verification,
The time domain waveforms of the mixed signal
The mixed signal is decomposed by wavelet packet, then the 1.5D spectrum of each wavelet packet subband is calculated, the autocorrelation coefficient of the 1.5D spectrum is obtained, the trend term of the autocorrelation coefficient is removed by polynomial fitting, and the kurtosis value of the autocorrelation coefficient after removing the trend term is calculated. The results are shown in Figure 7(a). In Figure 7(a), the maximum kurtosis value is the ninth subband of the fourth layer. The time domain waveform and envelope spectrum of this subband are shown in Figure 7(b) and (c). It can be seen that the periodic impulse components are effectively extracted.

(a) The kurtosis distribution obtained from the analysis of mixed signals by the proposed method in this paper, (b) time domain waveform of ninth subband of the fourth layer, and (c) envelope spectrum of (b).
The advantages of the proposed method over the Autogram algorithm,21–23 which is also defined by the autocorrelation coefficient, are discussed below. In terms of construction method, it is different from the Autogram algorithm, the method proposed in our manuscript calculates the autocorrelation of the 1.5D spectrum of the wavelet subband instead of the autocorrelation of the square envelope of the subband in the Autogram algorithm. This change greatly enhances the robustness of the algorithm, especially the ability of the algorithm to cope with multiple non-periodic transient impulse components in the time domain.
The autocorrelation of square envelope for three groups of signals with periodic impulse components, a single non-periodic transient impulse and multiple non-periodic transient impulse components are calculated respectively, and the results are shown in Figure 8. The first group of signals still retain the periodic impulse components after processing, and the kurtosis is 6.3221. The impulse of the second group of signals is suppressed after processing (a single non-periodic transient impulse has no coupling relationship), and the kurtosis is 3.0220. After the third group of signals are processed, a single impulse is generated in the time delay domain (the two impulses of the original signal have a coupling relationship, and the time difference is 0.1 s), and the kurtosis value is 8.5006. This shows a problem: time domain autocorrelation analysis can only suppress the interference components that do not have coupling relations in the time domain. However, for the interference components that have coupling relations, this process not only does not suppress interference, but may enhance the impact of interference.

Autocorrelation of square envelope for signals with: (a) periodic impulse components, (b) a single non-periodic transient impulse, and (c) multiple non-periodic transient impulse components.
To further illustrate this problem, the signals in Figure 8(b) and (c) are combined with the signals in Figure 8(a) respectively, and Autogram algorithm is used for processing, and the results are shown in Figure 9. It can be seen from Figure 9 that a single non-periodic transient impulse interference has no impact on fault subband location. Autogram algorithm can successfully extract fault features. However, multiple non-periodic transient impulse components interference has adverse effects on fault subband location, and fault features cannot be extracted.

Analysis results of Autogram algorithm for signals containing a single non-periodic transient impulse and multiple non-periodic transient impulse components.
Experimental analysis
Case 1: Experimental signal contains modulated harmonic interference
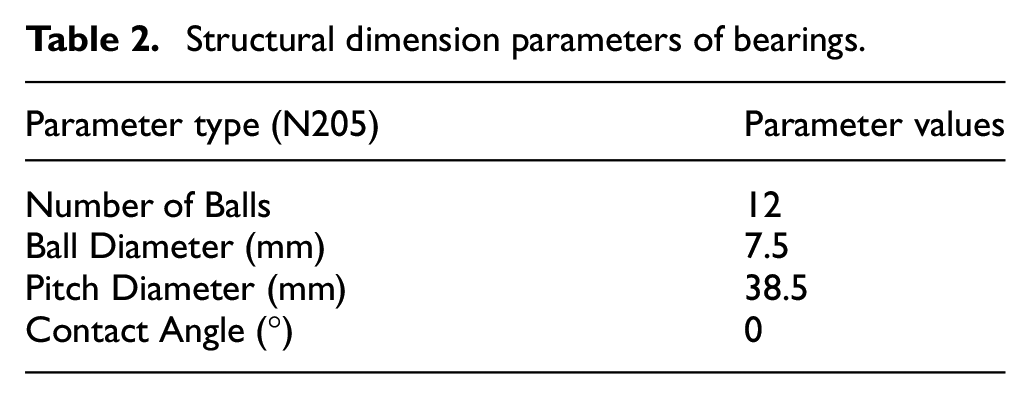
In order to further verify the effectiveness of the proposed method for fault information extraction under strong harmonic interference, the following experimental devices are used for experimental data acquisition and analysis. The experimental equipment is a rotating machinery fault simulation test-bed with model QPZZ-II. The structure of the experimental platform is shown in Figure 10. The experimental platform is driven by a motor. There is a bearing seat on the left and right sides of the gear train. A normal bearing is installed in the left bearing seat and a faulty bearing is installed in the right bearing seat. The bearing model is N205, and its structural parameters are shown in Table 2. The characteristic frequencies of different fault types of the bearing can be obtained through the structural parameters and rotation frequency of the bearing, as shown in Table 3. The groove is implanted into the bearing outer ring by EDM as the fault source (the fault is a groove with a depth of 1.5 mm and a width of 0.2 mm). The vibration signal is collected by eddy current sensors arranged in the horizontal and vertical directions of the shafting, and the sampling frequency is 12,800 Hz. The sensor collects the displacement signal of the shaft system, which includes not only the bearing vibration information, but also the harmonic information introduced by the imbalance of the shaft system.
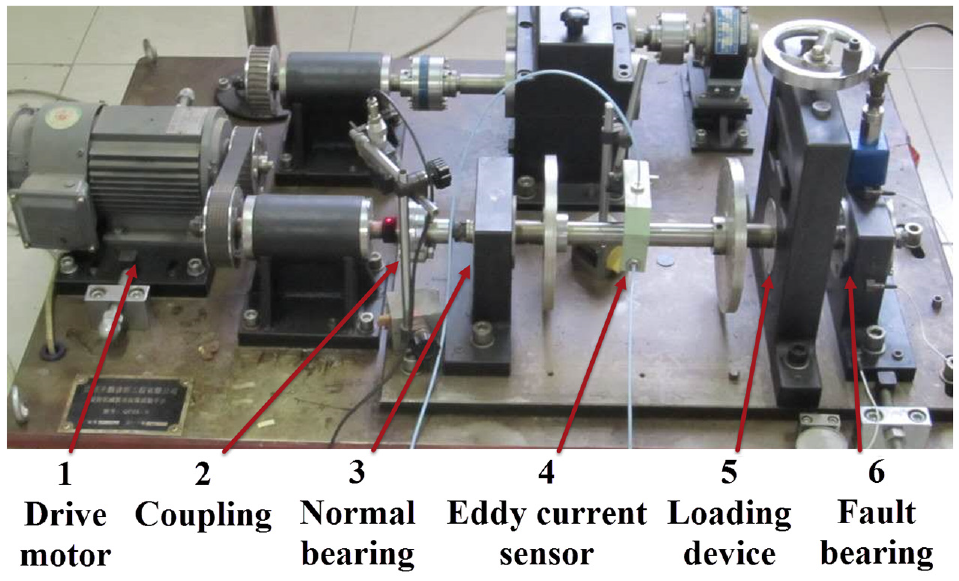
Bearing fault experimental equipment of QPZZ-II.
Structural dimension parameters of bearings.
Theoretical fault characteristic frequency of bearings.

The signal collected by the eddy current sensor is analyzed, and its time domain waveform and envelope spectrum are shown in Figure 11(a) and (b) respectively. The obvious harmonic component can be seen from the time domain waveform, and the frequency conversion component in the corresponding envelope spectrum is more prominent, but the characteristic frequency of bearing fault is submerged.

(a) Time domain waveform of the eddy current sensor and (b) envelope spectrum of (a).
The experimental signal is analyzed by the Kurtogram algorithm defined in the frequency domain (Ksesgram), and the results are shown in Figure 12. As can be seen from Figure 12(a), the optimal frequency band selected by Ksesgram is the first subband of the fourth layer. The time domain waveform and envelope spectrum of the subband are shown in Figure 12(b) and (c). It can be seen that the subband corresponds to the frequency band of harmonic components, and the fault characteristic frequency cannot be effectively extracted from the envelope spectrum.

(a) Ksesgram of the experimental signal, (b) time domain waveform of the optimal frequency band from (a), (c) envelope spectrum of (b).
The experimental signals are analyzed by the method proposed in this paper. Firstly, the original experimental signal is decomposed by wavelet packet, the 1.5D spectrum of each wavelet packet subband is calculated, and the autocorrelation coefficient of the 1.5D spectrum is obtained. Then, the trend term component is removed from the specific interval of the positive half axis of the autocorrelation coefficient by polynomial fitting method, and its kurtosis value is calculated. The results are shown in Figure 13(a). In Figure 13(a), the maximum kurtosis value is the third subband of the third layer. The time domain waveform and envelope spectrum of this subband are shown in Figure 13(b) and (c). The obvious periodic impulse components can be seen from the time domain waveform, and the fault characteristic frequency and its frequency doubling component are obtained from the envelope spectrum. In other words, the method proposed in this paper can extract the periodic impulse components of bearing fault from strong harmonic interference by using the coupling relationship of characteristic frequency.

(a) The kurtosis distribution obtained from the analysis of experimental signal by the proposed method in this paper, (b) time domain waveform of the optimal frequency band from (a), (c) envelope spectrum of (b).
Figure 14(a) shows the autocorrelation coefficients of the 1.5D spectrum of the first subband of the fourth layer of the wavelet packet (harmonic interference subband) and Figure 14(b) shows the autocorrelation coefficients of the 1.5D spectrum of the third subband of the third layer of the wavelet packet (fault characteristic subband). It can be seen that the impulse of harmonics in the frequency domain is suppressed, and the autocorrelation coefficient is a relatively smooth curve, so its kurtosis value is relatively low, while the periodic fault impulse components are enhanced, and the kurtosis value will also increase.
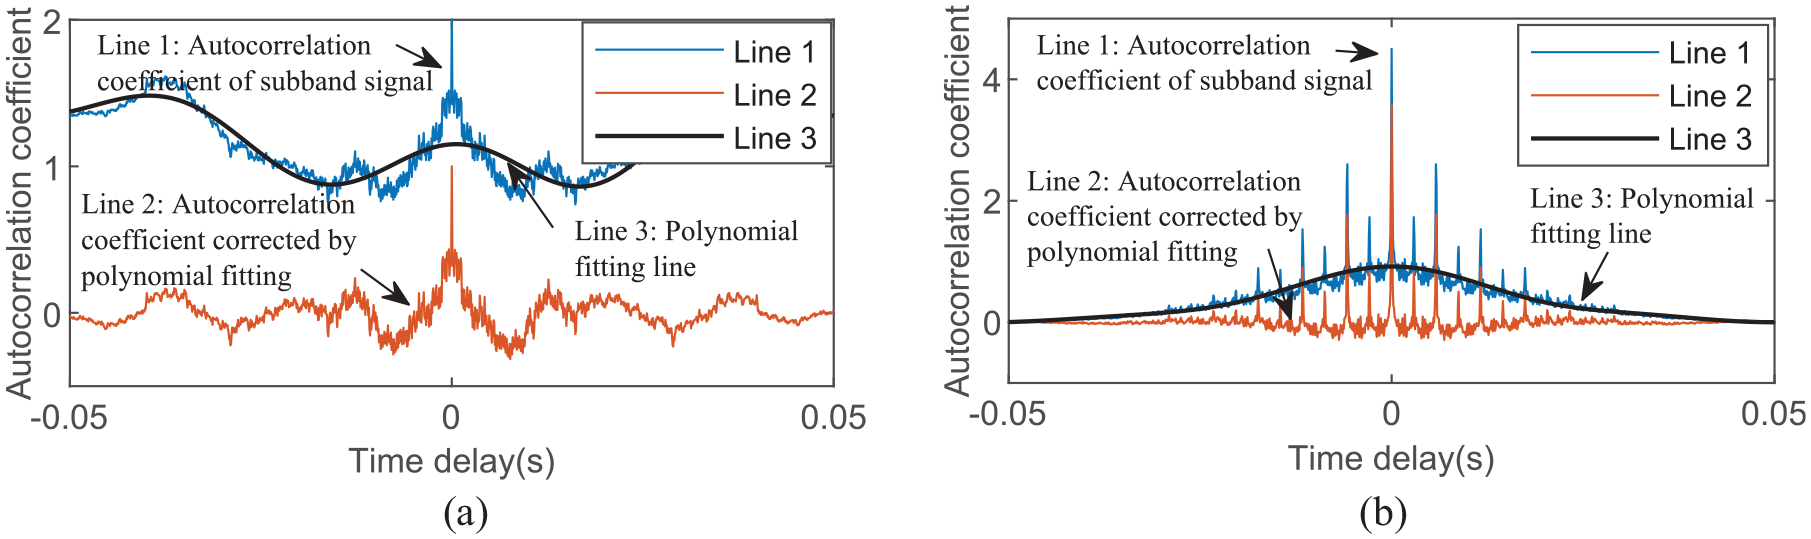
(a) Autocorrelation coefficients of the 1.5D spectrum of the first subband of the fourth layer (harmonic interference subband), (b) autocorrelation coefficients of the 1.5D spectrum of the third subband of the third layer of the wavelet packet (fault characteristic subband).
Case 2: Experimental signal contains non-periodic transient impulse components
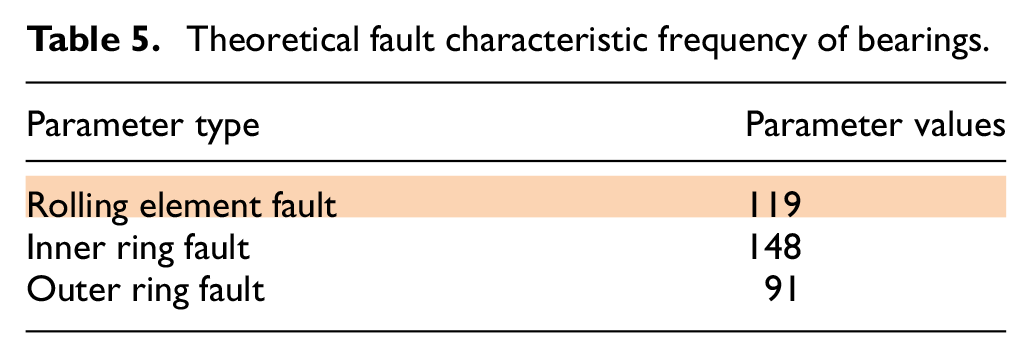
In order to further verify the processing effect of the proposed method on the signal with non-periodic transient impulse components, the bearing vibration signal data of CWRU was analyzed. The structure of the test bench is shown in Figure 15. The bearing model used in the experiment is JEMSKF6023-2RS (the structural parameters of the bearings are shown in Table 4), and the fault location is the rolling element fault formed by EDM. The speed is set to 1797 rpm and the sampling frequency is set to 12,000 Hz. The theoretical characteristic frequencies of different fault types can be calculated according to the structural size and speed of the bearing, as shown in Table 5.

Bearing fault experimental equipment of CWRU.
Structural dimension parameters of bearings.

Theoretical fault characteristic frequency of bearings.
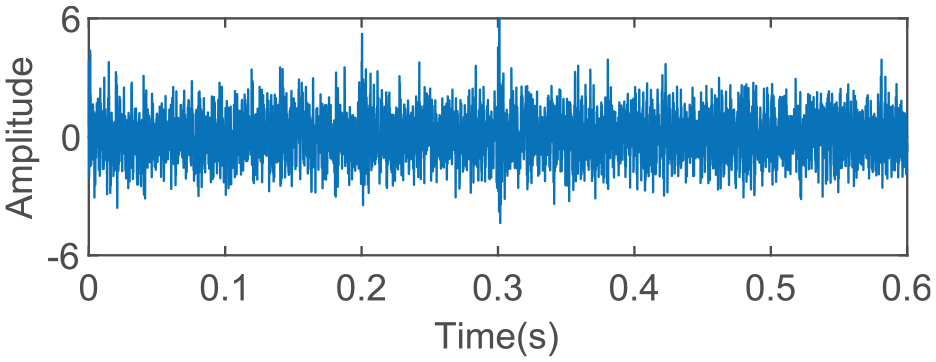
The rolling element fault signal with fault size of 0.021 in is selected for analysis, and its time domain waveform is shown in Figure 16. Some non-periodic transient impulse components can be seen from the time domain waveform, which will interfere with the diagnosis and affect the accuracy of the diagnosis. A 0.6 second data (7–7.6 s) of the signal is intercepted for analysis.

Time domain waveform of the experimental signal.
The experimental signal is analyzed by Ksegram method, and the results are shown in Figure 17. It can be seen from Figure 17(a) that the optimal subband selected by this method is the fifth subband of the third layer. The time domain waveform and envelope spectrum of this subband are shown in Figure 17(b) and (c). There are non-periodic transient impulse components in the time domain waveform, but no obvious periodic impulse components are found. The fault characteristic frequency is not obtained in the envelope spectrum. Therefore, it can be determined that the selected subband is not the subband where the bearing fault is located, that is, due to the influence of non-periodic transient impulse components, the ideal diagnosis effect can not be achieved.

(a) Ksegram of the experimental signal, (b) time domain waveform of the optimal frequency band from (a), (c) envelope spectrum of (b).
The experimental signals are analyzed by the method proposed in this paper. The experimental signal is decomposed by wavelet packet, the 1.5D spectrum of subband signal is calculated, the autocorrelation coefficient of 1.5D spectrum is obtained, the trend term is removed by polynomial fitting, and its kurtosis value is calculated. The results are shown in Figure 18(a). From Figure 18(a), it can be concluded that the optimal subband determined by this method is the third subband of the third layer. By analyzing the subband, the time domain waveform and envelope spectrum are obtained, as shown in Figure 18(b) respectively, and the fault characteristic frequency and its frequency conversion modulation frequency can be obtained.

(a) The kurtosis distribution obtained from the analysis of experimental signal by the proposed method in this paper, (b) time domain waveform of the optimal frequency band from (a), (c) envelope spectrum of (b).
Figure 19(a) shows the autocorrelation coefficients of the 1.5D spectrum of the fifth subband of the third layer of the wavelet packet (non-periodic transient impulse components) and Figure 19(b) the autocorrelation coefficients of the 1.5D spectrum of the third subband of the third layer of the wavelet packet (fault characteristic subband). It can be seen that the non-periodic transient impact component is suppressed after 1.5D spectrum calculation, and its autocorrelation coefficient is a smooth curve, and the kurtosis value decreases. while the periodic fault impulse components are retained, the impulse characteristics are enhanced, and the kurtosis value increases.

(a) Autocorrelation coefficients of the 1.5D spectrum of the fifth subband of the third layer (non-periodic transient impulse components), (b) autocorrelation coefficients of the third subband of the third layer of the wavelet packet (fault characteristic subband).
In order to further explain the processing effect of the proposed method for signals with multiple non-periodic transient impulse components, another group of CWRU experimental data is used for analysis. The bearing model is still JEMSKF6023-2RS, and the motor speed is 1772 rpm. The sampling frequency is 12,000 Hz. The time domain waveform of vibration signal is shown in Figure 20. There are multiple non-periodic transient impulses with large amplitude between 1.25 and 2.75 s in the time domain. The waveform with a length of 1.5 s is selected for analysis.
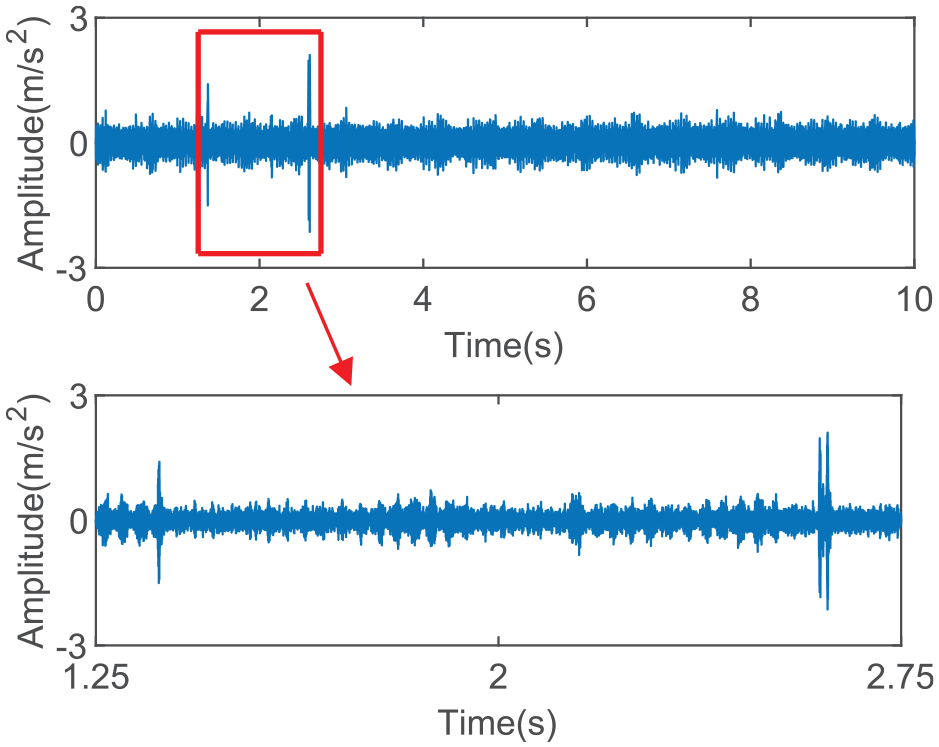
Time domain waveform of vibration signal with multiple non-periodic impulse components.
Figure 21 shows the analysis results of the Autogram algorithm. The optimal subband is located in the eighth subband of the fourth layer. The time domain waveform and envelope spectrum corresponding to this subband are shown in Figure 21(b) and (c) respectively. The time domain waveform contains multiple non-periodic transient impulse components, and no fault characteristic frequency is found in the envelope spectrum. This shows that when there are multiple non-periodic impulse components in the domain, the Autogram algorithm has poor coping ability. This is because the algorithm calculates the autocorrelation of the square envelope of the time domain, and cannot discard multiple non-periodic impulse components.

(a) Autogram of the experimental signal, (b) time domain waveform of the optimal frequency band from (a), (c) envelope spectrum of (b).
Figure 22 shows the analysis results of the above experimental signals by the method proposed in the manuscript. The optimal subband located by this method is located in the third subband of the fourth layer. Figure 22(b) and (c) respectively show the time domain waveform and envelope spectrum corresponding to the optimal subband. The time domain waveform contains obvious periodic impulse components, and the characteristic frequency of outer ring fault can be extracted from the envelope spectrum. This shows that the algorithm proposed in the manuscript has achieved good results when dealing with multiple non-periodic impulse components by calculating the autocorrelation of frequency domain 1.5D spectrum instead of calculating the autocorrelation of the square envelope in the time domain.

(a) The kurtosis distribution obtained from the analysis of experimental signal by the proposed method in this paper, (b) time domain waveform of the optimal frequency band from (a), (c) envelope spectrum of (b).
Conclusions
The essence of bearing vibration signal processing is to extract the periodic impulse components caused by fault from the signal including noise, non-periodic transient impulse components, harmonic components and other interference components. In this study, a new resonant band selection method is proposed. The signal is decomposed by wavelet packet, the frequency is divided into several subbands, and then the 1.5D spectrum of the subbands is calculated to improve the frequency resolution, further the autocorrelation of the 1.5D spectrum is obtained, and the polynomial fitting is used to remove the trend term. The kurtosis is calculated to obtain the periodic impulse energy distribution of the subband, so as to extract the fault features. Through simulated and experimental analysis, this method makes full use of the coupling relationship between the fault characteristic frequency and frequency doubling components of periodic impulses components, effectively discards the non-periodic transient impulse components and harmonic components (accidental and no coupling relationship), and can accurately extract fault features.
Footnotes
Handling Editor: Chenhui Liang
Author contributions
Xiong Zhang: Data curation, Investigation; Shuting Wan: Validation, Funding acquisition; Yuling He, Xiaolong Wang and Wenbo Wu: Formal analysis; Xiong Zhang and Jialu Li: Writing – original draft, Writing – review & editing.
Declaration of conflicting interests
The author(s) declared no potential conflicts of interest with respect to the research, authorship, and/or publication of this article.
Funding
The author(s) disclosed receipt of the following financial support for the research, authorship, and/or publication of this article: This work was supported by the National Natural Science Foundation of China (No.52105098), the Natural Science Foundation of Hebei Province (No. E2021502038), the Fundamental Research Funds for the Central Universities (No.2020MS111), and Science and Technology Plan Basic Research Foundation of Baoding City (2172P010).