
Abstract
We measured vertical and horizontal displacements of distant objects based on the moiré effect. The grid attached to the object was photographed and recorded on video camera. The video was processed later in the lab. The method is self-calibrated and does not need special equipment in the field (except for a regular videographer’s apparatus). The objectives of this study were to create a method for non-contact moiré measurement based on camera images and to find a way to deal with anomalous vibrations of structures. The experimental measurements of the fundamental frequency are in accordance with the theory of square beams. Tests with broken models were also conducted. The influence of two opposite factors on the fundamental frequency in the beams with cracks was estimated. In determining the pre-failure condition, the decay rate seems to be a more promising indicator than the fundamental frequency; however, this was only observed when a crack was near the fixed edge. The results and findings can be applied in measuring displacement in various objects; in public safety, and particularly, in distinguishing between normal and abnormal vibration in bridges.
Introduction
The moiré effect is an optical interaction between similar periodic structures, which produces another visible structure with lower frequency. In other words, measurable patterns of longer period are caused by an interaction of similar periodic structures of shorter periods. The moiré effect1–3 is not unknown in the metrology,4–6 optical measurements,7–9 nanoparticles,10,11 and other areas of scientific research. In particular, the books2,6 provide the theoretical foundation, Refs.1,4,5,7–9 describe the useful usage of the moiré patterns in practical measurements, Saveljev et al. 3 describes a special type of displays (the reduction of moiré and the visual display including 3D case), and Bassett et al. 10 and Sadan et al. 11 show the moiré effect in nanoparticles.
Among recent and similar works, the sampling method12,13 can be specially noted. However, in their measurements, certain exact integer ratios between the image of the grid and the period of the CCD pixels must be ensured. Also, the vertical alignment of the matrix of squares is needed, since with a small angular misalignment, a slanted scan line may fall outside of some squares, and the signal might be partially or completely lost.
In this paper, we present the non-contact method to measure mechanical vibrations and displacements based on deferred moiré patterns. In this context, the term “deferred” means “not necessarily simultaneous,”“performed later,” or “delayed,” so as the moiré patterns are not always observed/photographed during the field measurements; instead, a video record of a vibrating grid attached to a vibrating object is taken.
The method is based on two principles: the moiré magnification 14 and the moiré phase. 2 The magnification ensures the measurements of small quantities (sub-pixel). In terms of linear measurements, the phase of a periodic function means its displacement along the axis. Thus, by measuring the difference of the phases, we effectively measure the longitudinal displacement magnified by virtue of the physical properties of the moiré patterns.
In our measurements, we use grid, a planar periodical structure comprising repeated black and white bands with width of several mm or cm; it is typically printed on the paper, but can be engraved on metal or assembled from separate parts.
The originality of our method presented at the conferences15,16 is confirmed by the patent. 17 Also, the originality of the work lies in using regular photographic equipment; the moiré patterns are not photographed. The calibration is not required. The novelty is that, in the field, we only take photographs (video) of the grid attached to the object. The measurements themselves are made in the lab where the moiré fringes are generated and the phase difference is calculated.
Generally, some structural elements of a construction might get cracked during its lifetime. A fatigue crack appears at the surface and penetrates into a construction detail by certain depth; this means a broken (but not yet collapsed) construction. Because of that, characteristics of vibration are changed and the pre-collapse vibration might look different from that in the unbroken construction. The comparison of the characteristics of vibration (the frequency and the decay rate) allows, in principle, to recognize an abnormal condition of a structure, particularly, under construction, when the structure (a building/bridge) is not yet stable as finally required. The main challenge is to distinguish between the normal and abnormal vibration. This is what we will discuss in the paper.
The paper is arranged as follows. Section “Method” describes the method. The experimental verification under various conditions is presented in Section “Experiments.” The vibration of broken/unbroken constructions is outlined in Section “Vibrations in constructions with/without cracks.” The related tests are also made. The brief discussion in Section “Discussion” is followed by Section “Conclusion.”
Method
A periodic grid is attached to the object; the camera photographs it. Figure 1 illustrates the measurement of the vertical vibration using the grid with horizontal lines.

(a) Grid attached to object (horizontal beam). (b) Image in camera. The size of the grid is A5 (148 × 210 mm).
Note that we only make measurements in the plane orthogonal to the axis of the camera. In this example, we measured the vertical displacement using the grid with the horizontal lines. It is clear that a similar measurement can be made for the x-axis using a grid rotated by 90°. However, we cannot measure the distance (displacement along the z-axis).
The recorded video is processed in the lab, and a computer-generated grid is applied to each frame of the video; as a result, the moiré patterns appear and can be measured. In doing so, we do not rely on any predefined relation between the pixels and the grid; our method works well for an arbitrary size of the photographed grid and non-integer or non-rational ratio. However, despite the fact that the moiré patterns were intentionally not observed in the field, there is no fundamental impossibility to perform real-time processing. In that case, the intermediate video is excluded, and the camera frames are processed one by one by a portable computer.
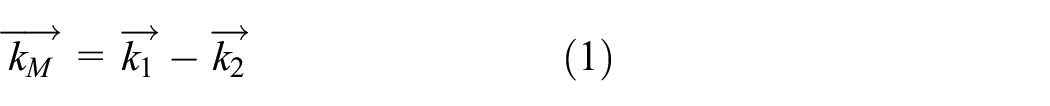
According to Amidror, 2 the wavevector of the moiré patterns kM is the difference between the wavevectors of the grids k1 and k2,
By definition, the wavenumber (the modulus of the wavevector) is the inverse of the period of the grid,

In our method, the photographed and computer-generated grids are parallel to each other. In this case, the moiré patterns are parallel to both grids, and we may consider the wavenumbers instead of the wavevectors. Then, the general formula 2 for the moiré period TM looks like follows,

where T1 and T2 are the periods of the grids. This formula, re-expressed via the ratio of periods of the grids, shows that in the parallel grids, the period of the moiré patterns is equal to the period of the grid magnified μ times,

For close periods (T2 ≈ T1), the magnification coefficient μ could be large, yielding a large magnification.
The phase of the patterns directly corresponds to the phases of the grids. For instance, shifting the grid by one-half of its period along the wavevector results in shifting the patterns by their half-period along their wavevector. Then the displacement is proportional to the phase. Thus, similarly to the period, the displacement of the patterns xM is also magnified by the same coefficient given by equation (4),

where x1,2 is the difference between the phases of the grids.
This ensures the measurement of small displacements, keeping in mind that the precise alignment of the line grid in our method is not required; for instance, an angular misalignment of, say, 5°, would result in a scale factor correction by 0.4% only.
The example of signals in one frame of the video is shown in Figure 2. Namely, Figure 2(a) shows the profile of the brightness in the photographed grid along the expected direction of the vibration (perpendicularly to the lines of the grid). The computer-generated grid (not shown in illustration) serves as the periodic modulation coefficient for Figure 2(a). Important is the fact that the computer-generated grid is common for all frames of the video. Figure 2(b) demonstrates the resulting moiré patterns (the smooth curve after averaging). Note that the grid is generated/used in the lab, and the visual observation of the patterns in Figure 2(b) is unnecessary. The averaging is just an example of a low-pass filter.
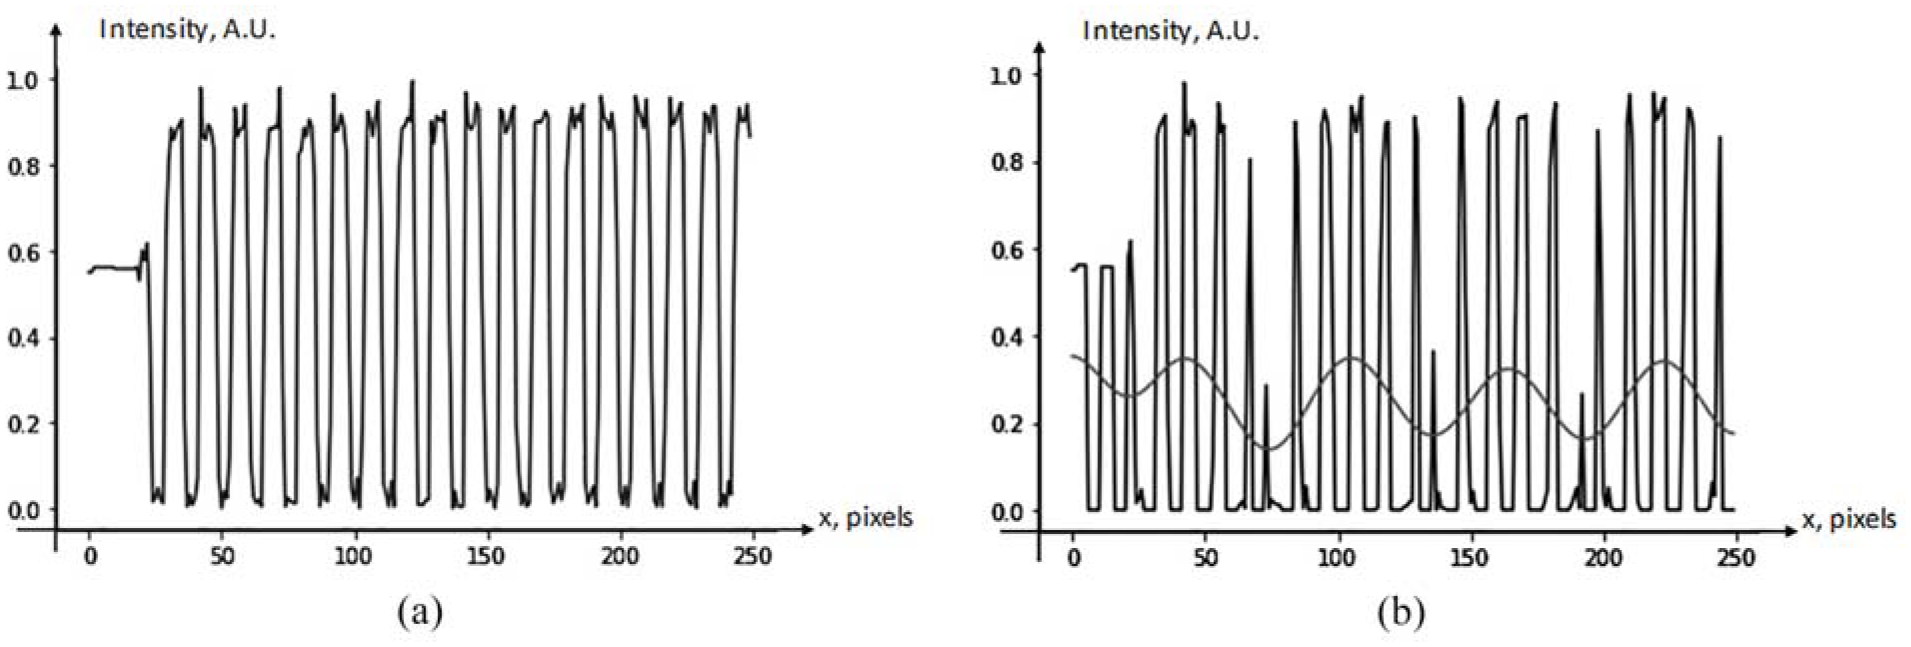
The moiré effect in one frame of the recorded video. (a) Brightness (in arbitrary unite, A.U.) of photographed grid along the line of the measurement; (b) photograph overlapped with computer-generated grid as is (sharp peaks) and averaged (smooth curve); the latter shows the moiré patterns themselves.
When an object moves/vibrates, the displacement of the attached grid causes the corresponding displacement of the patterns. In principle, it can be observed in successive frames of the video, but could be smaller than 1 pixel. Similar to the period, the displacement of the patterns (the phase) is also magnified μ times. Therefore, the phase of the moiré patterns indicates the displacement directly. It is important to note that in the absence of vibrations, the period and the phase of the photographed grid remain constant because of the mechanically stable (unchanged) positions of both items (the grid and the camera).
Technically, we measure the phase. The phase-based methods are known as reliable precise methods of measurements.18–20 The phase of the patterns at two moments of time (i.e., in sequential frames) is shown in Figure 3. The phase difference between the corresponding parts of the curve (in our case, the maxima) is the magnified displacement of the object.

The moiré patterns at two moments of time.
This can be made for any time difference (seconds of hours). Particularly, if using a typical video camera with 30 FPS, a sequence of the video frames is separated by 33 ms.
An additional illustration of the principle is shown in Figure 4. Note a small displacement of the grid but a large displacement of the patterns.

Principle of measurements.
In digital images, we are always limited by the size of the elementary unit of the image, the pixel. So, if we would need to measure a displacement smaller than 1 pixel, the result might look uncertain. However, even if this might look somewhat strange, it is practically possible to measure sub-pixel displacements using our method.
Indeed, whereas the shape of two signals, for example, sin(ωt) and sin(ωt + φ) with the phase difference φ much less than one pixel is virtually identical, their values could have tiny, but recognizable difference. Fortunately, the moiré effect (the effect appearing across several points) helps to make it larger through the magnification. Therefore, it is not principally impossible to measure very small displacements which are less than 1 pixel. This feature of the proposed method can be characterized as “sub-pixel resolution” or even “moiré super-resolution.”
The simultaneous measurements at several points at the same time are possible.
Practically, in a computer program, everything is measured in pixels. In addition, the period of the observed moiré patterns is always proportional to the period of the printed grid, which is known exactly in centimetres. Therefore, the phase measured in pixels can be re-expressed in the physical linear units (mm or cm). It means that a special calibration procedure is not necessary at all; the method of the measurements is self-calibrated.
Experiments
Experimental measurements of vibration were made at various distances (short or long) under various conditions (in lab, in field).
Short distance, in lab (horizontal and vertical simultaneously)
In this test, the grid was clipped to the cloth as a badge, see Figure 5. Using the grid, both horizontal and vertical displacements were measured. The subject was sitting in front of the built-in camera of a laptop computer at the distance of about 70 cm.

Grid to measure respiratory rate in the subject sitting.
Parts of the body of the subject are mechanically displaced synchronously with the breathing; the measured displacements are shown in Figure 6. The graphs show that the subject does not keep sitting ideally still; he naturally makes movements when clicking mouse, etc.

Measured displacements: (a) vertical and (b) horizontal.
Then, the FFT was applied to 1024 samples (taken during approximately 30 s). It can be seen in Figure 7 that in both directions, the maximal peak of FFT shows the respiratory rate in both horizontal and vertical displacements.

FFT of horizontal and vertical displacements.
The fundamental frequency of the respiration and its harmonics (peaks 11, 23, and 34) are clearly recognizable in both directions. The noticeable 11th peak of FFT corresponds to the respiratory rate (RR) of 19.3 min−1. The value of RR measured directly by counting breaths during 1 min was 20 breaths/min. The difference is only 3.3%, despite the natural, unavoidable movements of the subject during the testing, and the shorter time of the measurement (almost twice less than the regular 1 min).
Verification
To confirm the correctness of the measurements, we measured the known displacement. In the first test, the grid was moved mechanically by the micrometre slider. The displacement of the grid (0.5, 1, 2, and 5 mm) was verified each time with the calliper ruler.
The above is a sort of static test. Besides, similar tests were carried out dynamically using a mechanical vibrator and an independent measurement device (the accelerometer). The amplitudes of vibration were 0.5–5 mm at frequencies of 3–6 Hz. Note that at a fixed frequency, the readings of the accelerometer can be directly converted into the linear displacement.
All displacements, including the smallest ones, were measured correctly. The distances were from 3 to 6 m. The deviation from the predefined known amplitude in all cases was 2%–3%.
Long distance, outdoor
We made the test on the road bridge near Nonsan University Campus. The length of the bridge is 300 m, the height is 10 m. In this test, the grid was installed on the bridge, while the camera was placed on the ground below the bridge, see Figure 8.

Layout of measurements on the bridge.
In this case, we had no source of excitation. The test demonstrated the practical absence of vibrations of the bridge without an excitation, that is, in the absence of vehicles.
The measured deflection is shown in Figure 9(a). The average power spectrum (several spectra of 1024 sampling points) of vibrations in the bridge is shown in Figure 9(b).

(a) Measured deflection of bridge. (b) Average power spectrum.
In Figure 9(b), at least three peaks can be recognized: 0.56, 0.94, and 1.49 Hz (1 spectral bin worth 0.03 Hz). Most probably, they represent three harmonics of the fundamental frequency of the bridge (with accuracy 10%–15%). This shows the average properties of vibration.
At the same time, heavy trucks passing can be associated with high peaks of the signal of the deflection, see Figure 9(a). Particular events of trucks passing the bridge can be recognized using the wavelet transform. The plot of the continuous wavelet transform (CWT) and its cross-section along the dashed line are shown in Figure 10. The basic meaning of the axes is as follows: the dilation is the scale of the wavelet (i.e., the frequency), the shift means the time.

(a) CWT using Ricker wavelet for single oscillation. (b) Detected peaks of CWT with width of 1.3–2 s.
The peaks detected by the wavelet transform are indicated by labels on their top in Figure 10(b). The events observed visually are listed in the Table 1.
Observed and measured events.

As it can be seen, the most events with heavy trucks were recognized correctly. At the same time, small passenger cars practically do not affect the results.
Vibrations in constructions with/without cracks
Estimation of parameters
Implying a bridge can be described by the linear differential equation(s) of the second order, we can describe its vibration in terms of the frequency and the exponential decay rate.
Consider a bridge as a structure with distributed mass. According to McConnell, 21 the natural (fundamental) frequency f0 of such structure due to the gravitational force is

where E = modulus of elasticity (M/m2), I = moment of inertia (cm4), λm = linear mass density (kg/m), L = length (m).
The moment of inertia of the rod about a perpendicular axis through its center is
The mass of the thin rod of the constant cross-section area s and density ρ with length L is

Then, the moment of inertia is
Substituting equation (9) into equation (6), we get
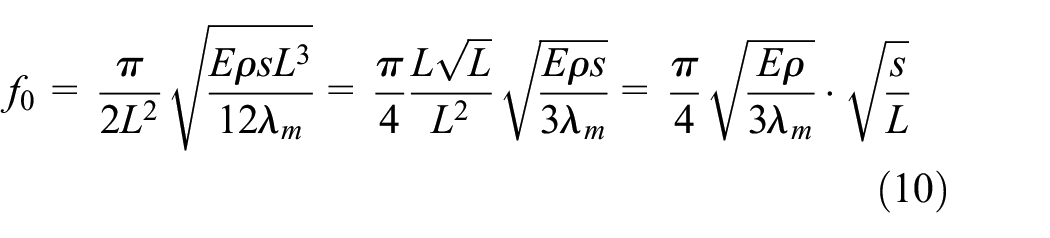
Note that in equation (10), the first multiplicand includes only the mathematical constants together with the material constants, while the second multiplicand describes the geometry of the rod (the cross-section area and the length).
Furthermore, a cut (crack) makes the rod effectively shorter and the cross-section smaller. By equation (10), the effects of the shorter length and the smaller cross-section are comparable but opposite, because the corresponding variables are on the opposite sides of the fraction. Therefore, in principle, the frequency may either rise or fall, depending on other conditions, say, the shape of the cross-section.
Namely, according to equation (10), while the length of an incompletely cut beam remains the same, a smaller cross-section makes the frequency fall.
When a beam is completely cut into two separate parts, the frequency of the shortened beam of the same cross-section is higher. Therefore, a certain cut depth should exist, starting from which the frequency should rise.
Thus, it is virtually impossible to predict the effect which will prevail using such a simple estimation, and generally, a more detailed consideration is needed.
We did not do that in the current paper, but for example, in a detailed theory of the square beam, 22 the frequency falls when a crack extends; they observed “the frequency reduction” experimentally. In another source, 23 the crack is not symmetric, but the result is similar: the natural frequency falls. According to both mentioned sources, the frequency falls by 7% with the crack ratio of 0.3.
Comparative tests with/without cracks
Plain plastic rod
The tests were made with plastic models; one edge was fixed, the other was free. To distinguish between broken and unbroken constructions, we measured the characteristics of the vibration in both cases. The layout of this test was shown in Figure 1(a); an example of the camera image was shown in Figure 1(b).
In the “whole” (unbroken) construction, the halves were tightly connected by the metal clips, see Figure 11(a). By disconnecting its halves (removing the clips), the rod was “broken” in the middle, see Figure 11(b).
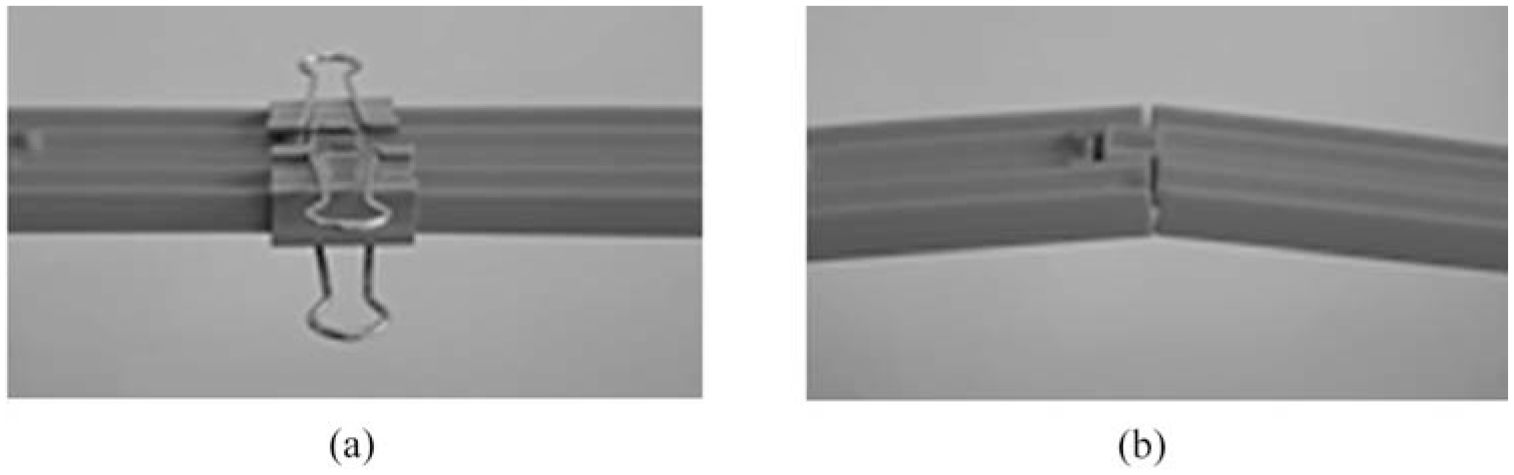
(a) unbroken rod; (b) broken rod.
Examples of measured vibrations in a plastic rod (length 90 cm, the distance to the camera 0.5 m) are shown in Figure 12(a) and (b). The vibration was excited by an impact of a hammer near the fixed edge.
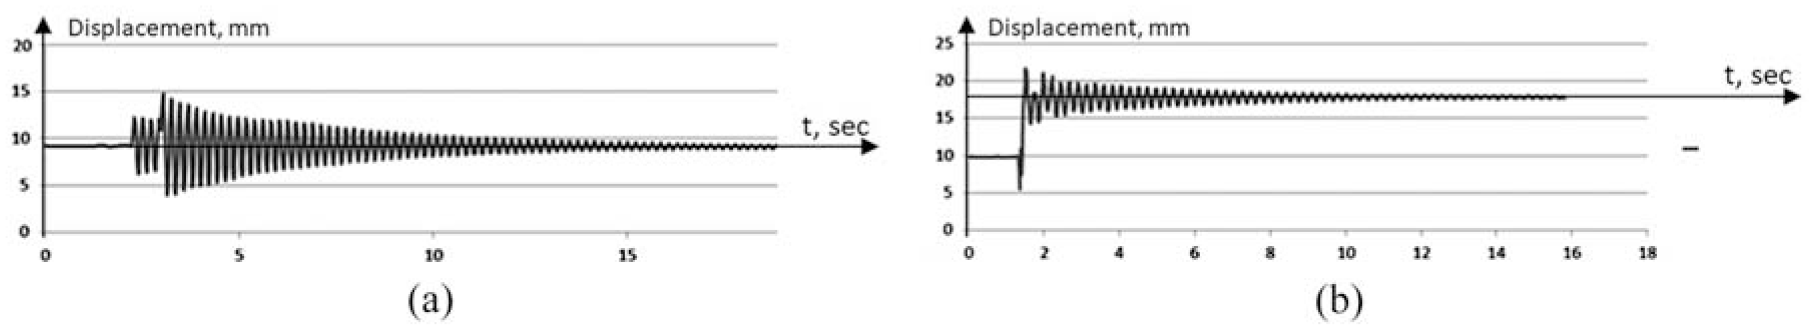
Vibration of (a) unbroken and (b) broken rod.
In these tests (grid 8.9 mm, the grid less than A5), we had 13 pixels/mm. Therefore, the sensitivity was 0.07 mm. The peak-to-peak magnitude of vibration was 5–10 mm.
A pre-failure condition was identified by the characteristics of the vibration such as the fundamental frequency and the exponential decay rate. Specifically, the measured frequency of vibrations (fundamental frequency) was 4.68–4.69 Hz in the unbroken rod, and 4.36–4.37 Hz in the broken one, that is, the frequency fell down to 93%, as the theoretical crack depth was 0.35, the value which seems to be quite reasonable. The “lifetime” of vibrations (the inverse exponential decay rate) was 2.8–4.4 s in the unbroken rod and 7.3–9.2 s in the broken one.
Note the essential difference in the behavior of these parameters in the broken/unbroken rod. The measured difference of frequencies was approximately 7%, while the difference in the life times almost doubled. The mentioned change corresponds to the theoretically predicted fall of 7%.
In principle, this makes it possible to determine the condition of a construction (broken or not) by comparison with the initial (ideal) parameters.
Model of railroad bridge
The next test was made with a plastic model of a through truss bridge. It consists of the bottom plate, two vertical side plates, and two horizontal top plates with laterals and chords (diagonals, struts, and braces) connected together. The layout of this test is similar to Figure 1, but instead of the rod, the plastic model of the bridge was used.
A structural “damage” was modeled by removal of one or two top plates. There are four configurations: 2 (two plates), 1n and 1f (one plate near the fixed edge or far from it), and 0 (no plate).
The vibration was excited by an impact as in the previous test, that is, by hitting the model with a plastic hammer. After the excitation, the amplitude decayed, while the period remained constant, in accordance with the solution of the differential equation of the second order.
The amplitude of oscillations (peak-to-peak) was measured as the difference in the heights of the neighboring local maxima, the period of oscillations as the time difference between two neighboring maxima or minima.
As mentioned, we imply the exponential decay. The decay rate can be estimated from the experimental data by the exponential regression, see Figure 13 for three impacts.

Exponential decay of amplitude (three impacts).
The average period and decay rate in four configurations (the whole bridge, the bridge with one upper plate removed (two options), and the bridge with both plates removed) are shown in Figure 14.

Graphs of period and decay as functions of configuration: (a) period and (b) decay rate.
The period seems to follow a (straight) line, increasing by 15% in four configurations (0–2 plates). It means that the frequency gradually falls by 15%. However, the decay does not follow such a simple pattern and seems to fall by 25% in the configurations 0, 1n, and 2, but has a “sudden” peak in the configuration 1f (the circle in Figure 14). In this case, the only far plate was installed, which means a larger mass at a longer distance from the fixed point. The measured parameters of oscillations indicate the opposite behavior in most configurations (smooth rise by 15% and fall by 25% in three cases); however, there was a “strange” non-smooth behavior (sudden jump with the double decay) in one configuration.
Such a complicated picture shows the potential ability to recognize structural damages (crack shorter than 1/3 of the cross-section) using the decay rate. For that purpose, a promising option could be considering the parameter space instead of two plots of each parameter vs. time.
Discussion
The method works with any resolution higher than SVGA (800 × 600 pixels). Using a camera with the frame rate of 30 Hz, the frequency of the measured oscillations can be up to 15 Hz. With the higher frame rate, the higher frequencies of vibration can be certainly recognized.
The size of the target and the period of the grid depend on the distance, but for distances within the range of 2–25 m, the size of the grids was A5 to A1, while the minimal measured displacement was 0.036–0.17 mm.
We calculated the phase by measuring the position of the maximum of the moiré pattern; however, higher accuracy can be achieved in another point, for example, where the function crosses zero. We only measured the lateral displacements in the plane perpendicular to the axis of the camera. Measurements of the longitudinal displacement were never made.
For the crack detection, the parameters of vibration can be also determined in the parameter space using specially designed wavelets. For instance, one can use the exponential wavelets. The similar behavior of the parameters (the frequency fall by or to 3%, but the double jump of the decay sometimes) was observed in both tests with broken models.
In the respiration rate test, we found the maximal peak of the FFT. The accuracy of the measurements can be improved, for example, using the interpolation.
Several non-synchronized cameras can be used. Moreover, in each camera, the measurements can be made in several points simultaneously using several grids within the field of view.
The method implied that the recorded data are processed in-lab. However in general, the measurement is not necessarily always deferred. It may be deferred or not, and in principle can be also performed in the field using a microcontroller in real time.
Naturally, the phase of the patterns may become larger than one period. This will lead to a jump of the measured phase from something about 2π to something close to 0. Therefore, a necessary part of the processing is unwrapping. The purpose of unwrapping is to make the phase smooth (without jumps) and allow it to change by more than one period. In the image processing, we relied on the known solution 24 of the phase unwrapping problem.
The comparison of our proposal with the other method, for example, Ngeljaratan and Moustafa, 25 shows the following. In our method, all cameras (their number is arbitrary) are independent, their locations, distances, and directions are arbitrary. The duration of the record is only limited by the size of the installed flash memory and can be easily enlarged. The frame rate is not fixed. Thus, our method is more flexible and less dependent on equipment.
As soon as the proposed method involves the averaging, one may expect that some insignificant weather phenomena like a light rain would not affect the results of the measurements; however, such an assumption needs an additional verification.
With improved accuracy of the measurements, and using advanced processing techniques such as the wavelet transform, the normal and abnormal vibrations can be identified with better reliability. For other (double, multiple) events on the road bridge, the wavelets of other types can be used, for example, the Morlet wavelet.
Conclusion
The method of the deferred moiré patterns is a flexible self-calibrated non-contact method to measure the displacement/vibration. We confirmed experimentally the measurements of displacement/vibration based on the deferred moiré effect in the lab and in the field. The practical range of the measured oscillations was down to 0.05 mm with frequencies up to 15 Hz at distances from 0.5 to 25 m. It is a self-calibrated method that requires minimum photographic equipment in the field. Another contribution is that in tests, an abnormal vibration of a broken model was recognized based on the measured parameters, mostly the decay rate.
The relevance is confirmed by a variety of applications. Namely, applications in public safety include non-contact or deferred measurements (depending on the requirements) of displacement/vibration including an abnormal vibration of a road/pedestrian bridge, the vibration of a vehicle, the vibration of the elements of a structure (building/bridge) under construction, the detection of cracks in constructions; some medical applications (a non-contact measurement of the respiratory rate) are not impossible either, as well as the earthquake detection, the moiré cryptography, and document security.
Footnotes
Acknowledgements
The authors thank the Priority Research Center Program for the support of this work through the National Research Foundation of Korea (NRF) funded by the Ministry of Education.
Handling Editor: Chenhui Liang
Declaration of conflicting interests
The author(s) declared no potential conflicts of interest with respect to the research, authorship, and/or publication of this article.
Funding
The author(s) disclosed receipt of the following financial support for the research, authorship, and/or publication of this article: This work was supported by the National Research Foundation of Korea, Grant Number NRF-2018R1A6A1A03025542.