
Abstract
Aiming at the long-term unpredictability of the reciprocating compressor vibration signal, a non-parametric prediction method of reciprocating compressor time series based on the prediction credibility scale is proposed in this paper. The method is to take the multifractal singular spectrum as the prediction parameter and use the Smoothness Priors Approach (SPA) method to obtain the singular spectrum parameters of different components, and construct the phase space reconstruction dynamic modeling domains. It enables the prediction model to reflect the real-time characteristics of the dynamics evolution of complex systems and highlights the independent influence of each component on the prediction. Meanwhile, the information entropy saturation principle is introduced into the K-Nearest Neighbor (KNN) model to establish the improved K neighborhood dynamic non-parametric prediction model based on the maximum prediction credibility scale, which improves the credibility of the prediction results. Finally, a complete SPA&PSR_KNN prediction algorithm is proposed. Through example validation and error analysis, compared with KNN, BP, and SVM, it can be seen that the prediction results of spectral characteristic parameters obtained by this algorithm have smaller error and higher reliability, and faster operation speed. Thus, the prediction of vibration signal time series of reciprocating compressor is realized.
Keywords
Introduction
Reciprocating compressor is a typical nonlinear system, and its vibration signal exhibits the characteristics of periodic oscillation and chaotic fractal, that is, long-term unpredictability. 1 For this kind of signal prediction, it is obviously undesirable to pursue the error between the vibration predicted amplitude and the measured value at a certain time, while ignoring the maximum prediction credibility scale. Meanwhile, the prediction credibility scale is time-varying restricted by the initial sensitivity of the system. Therefore, the prediction results based on fixed-parameter models, which are limited to a few finite discrete point values at a certain moment in time, have no practical significance because they cannot show the refined characteristics of the complete signal cycle.
Currently, the parametric-based prediction methods include time series modeling, Kalman filtering, regression analysis, and neural network analysis.2–9 The prediction based on time series can be divided into regression analysis models such as auto regressive (AR), moving average (MA), and auto regressive integrate moving average (ARMA). This type of prediction model usually needs to perform steps such as sequence model identification, model order determination, parameter estimation, and model verification. Although the model technology is relatively mature, it is more suitable for stationary time series prediction because its parameters cannot be transplanted and its initialization is complicated. Kalman filter method has a large amount of parameter estimation and high precision for processing stationary data, which is not suitable for state prediction of nonlinear and stochastic systems. The regression analysis model takes the factors determining the predicted objects as independent variables and the predicted objects as dependent variables to establish a mathematical regression equation of the relationship between independent variables and dependent variables. According to the different parameters of the regression equation, it can be divided into univariate or multivariate linear prediction, nonlinear regression prediction model and so on. Its prediction model is simple structure and high calculating speed, but for complex nonlinear system and the insufficient external accidental factors to consider, there is a big limitation. 10 The methods based on Back Propagation (BP), fuzzy or high-order neural network can optimize the model through a large amount of training, but the complexity of the training time and function mapping make it impossible to show the advantages of real-time predictions in the complex nonlinear system model construction mechanism. 11 Comprehensive above the analysis of the prediction method based on the model parameters, it can be clarified that the initial sensitivity of the complex nonlinear mechanical system with chaotic characteristics and the sudden change of the characteristic state caused by the “singular point” in the operating state, make the Eager type algorithm based on the model and parameters is difficult to play its advantages of training and learning.
For the prediction of dynamic nonlinear system, the main methods include artificial neural network prediction, fuzzy prediction, support vector machine, and their fusion algorithms. Most of the above prediction model take the single-step prediction mode and the rolling prediction mode with fixed constants as the research object. Due to the limitation of the existing model order or parameters, the adjustment and training of the model are time-consuming and laborious, and as a result, the adaptability is constrained by the uncertainty factors within the system state, and the model cannot be distorted according to the change of system state characteristics.
In summary, the non-parametric regression-based prediction method is a modeling method suitable for uncertain, nonlinear dynamic systems that has emerged in recent years. 8 The core of the algorithm is not to establish an approximate model for historical data and train, but to obtain information directly from historical data, and to deduce future results according to the relationship of intrinsic factors contained in historical data. The principle is internally consistent with the prediction system based on multivariate metric and wave theory proposed by Weng. 12 The former does not require prior knowledge, and the core of the principle is to use historical data to find similar nearest neighbors to the current point to predict the value of the next moment, which effectively avoids the model error brought by smoothing. The latter proposes “fidelity algorithm” and “frequency division technique,” that is, for the complex periodic data, the technique of frequency separation and classification of data of different depths is used to improve the accuracy of prediction by comparison and auxiliary judgment.
Parzen window estimation and K-Nearest Neighbor (KNN) estimation are mainly used for non-parametric prediction pattern recognition, which is more applicable than Bayesian estimation that requires prior determination of prior probability and probability density assumption. The Parzen window estimates the probability density from the sample, while the KNN algorithm directly omits the estimation of the unknown probability density function. Since the selection and trade-off of the window function is an obstacle to the application of the Parzen algorithm, while the KNN algorithm is based on the posterior probability of the sequence element distance or similarity measure, which is more generalizable.13–15
The principle of the prediction algorithm based on KNN estimation is to construct a certain segment vector sequence, find K neighbors by the method of distance or similarity measurement, and obtain a new prediction value through a certain average or weighting process. Due to the simple and intuitive algorithm of non-parametric prediction methods, when the sample value is large enough, its error is low, and the prediction effect under special (fault or singular point) conditions is more accurate than parametric modeling. This type of method has been widely used in the fields of transportation, molecular biology, finance, and meteorology for prediction. Scholars have carried out related research based on this method. Zhu Hong combined the KNN algorithm with the Bayesian algorithm to improve the time efficiency and accuracy of sample classification. 16 Feng and Meng 17 predicted flight departure time based on KNN and Support Vector Regression (SVR). Compared with the Support Vector Regression model alone, the relative absolute error was at a lower level, and the prediction accuracy was significantly improved. In view of the low prediction accuracy of non-parametric models for complex systems, Lin 18 improved the typical KNN method and combined the Empirical Mode Decomposition (EMD) method to predict the daily closing prices of different stocks, which effectively improved the prediction accuracy.
At present, nonparametric regression-based prediction algorithms have achieved certain results in many fields, but there are many complications in the field of fault prediction that restrict their further development. For example, the modeling process completely ignores the internal evolutionary state of the system, the requirements of the predicted parameters and prediction time for the model, the selection of the number of neighboring values and the mechanism of model construction, and so on. How to improve the model interpretability and prediction accuracy of the algorithm, and make it suitable for the prediction and evaluation of reciprocating machinery fault diagnosis is an urgent problem to be solved.
The KNN algorithm is applicable to predict the feasibility study of complex systems, but also requires a certain optimization means, to enhance the adaptability and interpretability of the algorithm, namely, the need for nonlinear time-varying systems based on the analysis of the dynamic evolution trend, with reciprocating machinery vibration signal to build effective prediction of time series sequence method. Based on the G_P algorithm proposed by Grassberger and Procaccia, fractal scale relationship can be found from the perspective of phase space reconstruction, and the maximum prediction credibility scale can be calculated by combining the principle of information entropy saturation. It can be seen that the information entropy theory can be used to analyze the evolution process of nonlinear systems and improve the prediction reliability of nonlinear complex systems. Combined with the theory of in-phase space reconstruction, the prediction model of time series complex systems can be constructed.
Aiming at the adaptability of the reciprocating compressor vibration signal prediction model and the initial sensitivity of the nonlinear system, a non-parametric prediction method of reciprocating compressor time series based on the prediction credibility scale is proposed in this paper. Using the multifractal singular spectrum as the prediction parameter, an improved K neighborhood dynamic prediction model based on the maximum prediction credibility scale is proposed. The principle of information entropy saturation is introduced to the maximum prediction credibility scale, which improves the credibility of the prediction results. The phase space reconstruction type dynamic modeling domain is constructed with the trend and de-trend component spectrum parameters decomposed by the SPA, and a complete SPA&PSR_KNN prediction algorithm flow is proposed. The prediction model reflects the real-time characteristics of the dynamic evolution of the complex system, and highlights the independent influence of each modal component on the prediction. The effectiveness of the prediction model proposed in this paper is verified by fitting regression and error analysis. Thus, the prediction of vibration signal time series of reciprocating compressor is realized.
Prediction credibility time scale model
Multifractal and Renyi entropy
According to the knowledge of fractal theory, the correlation dimension can be expressed as a second-order information dimension, namely
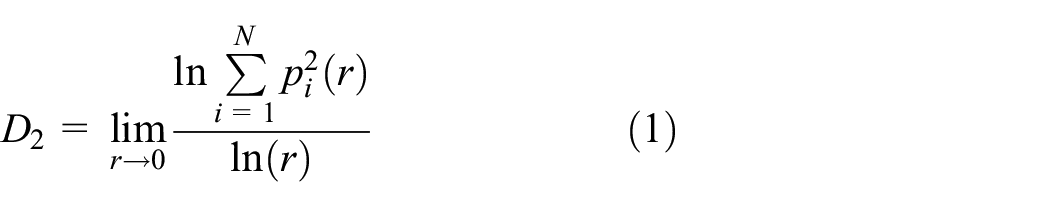
In the G_P algorithm for calculating the correlation dimension, it is necessary to reconstruct the phase space of the time series first. Take the phase distribution of dimension m as an example,

In equation (1),
The m points connected in equation (2) are used as a vector point of the continuation phase space,

Among them,

Obviously, q = 2, the above formula is:

Information entropy and prediction time
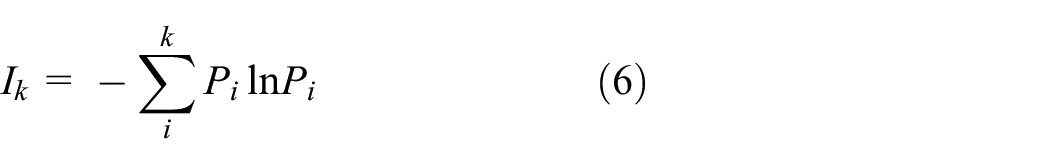
In Shannon’s information theory, the calculation formula of entropy is expressed as:
For the phase space point pair of the m-dimensional time series in equation (2), when the idea of G_P algorithm is introduced, that is, it is divided into k units of
In other words, when it is known that the area sequence that the system was
Then, the information loss value is Kolmogorov entropy (referred to as K-entropy), and the entropy value can be expressed as:
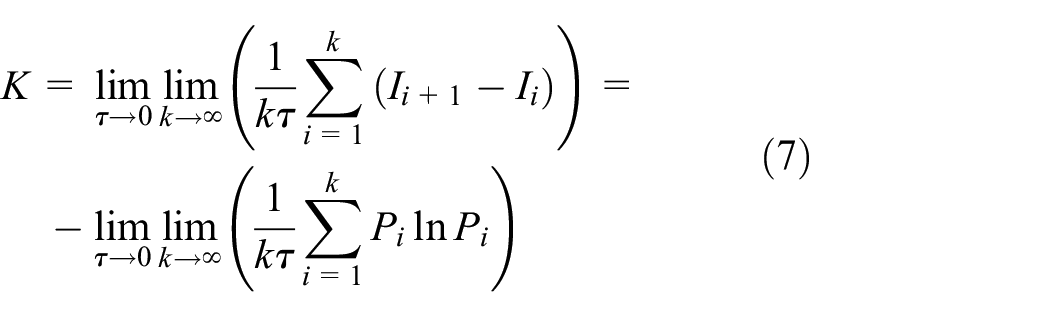
K-entropy can also be obtained by limiting the first-order Renyi entropy of equation (5). The greater the loss of characterizing information, the greater the uncertainty of the system. K-entropy is an effective tool to describe the complexity of the system.
If the change value of K-entropy is used to calculate the maximum predictable time of the system, the following methods and steps can be used:
Suppose the amount of information at time t is
Then there is,
If the order
The Literature 19 believes that the prediction within T is accurate. If the prediction time is greater than this value, it can only be said that the prediction is statistical.
Combining the above ideas based on K-entropy loss and G_P algorithm, to calculate the maximum predictive credibility scale T, because of the nature of Renyi entropy is
Suppose the time series interval is

That exists:

In summary, the calculation flow chart for calculating the maximum predictable time scale of complex system time series is as follows in Figure 1.

Calculation flow chart of maximum predicted confidence time of time series in systems.
According to the above calculation process, the maximum predictable time
Phase space reconstruction KNN prediction
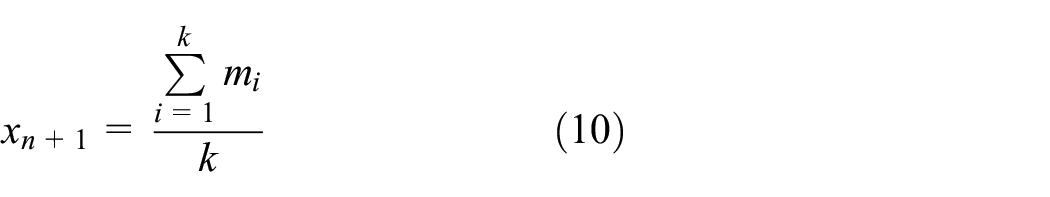
The principle of the traditional KNN prediction algorithm is to construct m sequences of the original n data and find the nearest k values, and then use the weighted value of the k points as the predicted value of the n+1th data. The algorithm expresses that the inherent complex mapping relationships of the system are all contained in historical data. It neither builds a training model for historical data nor processes historical data, and is particularly suitable for rapid classification of nonlinear problems. However, this method has poor interpretability and cannot show the evolution trend and process of the system from a theoretical perspective. The phase space reconstruction theory is introduced into the KNN prediction algorithm, and the chaotic time series prediction principle can be described as follows:
For discrete time series:

Take each behavioral prediction vector, that is, construct m data vector
For example, if
MSS dynamic SPA_KNN prediction model based on prediction credibility scale
SPA
Dr. Karjalainen 20 from Kuopio University in Finland proposes a nonlinear de-trend method—Smoothness Priors Approach (SPA). It assumes that the original data signal, namely the time series Z,

In equation (11), Zs is a stationary term, Zt is a nonlinear low-frequency trend component,

In equation (12),
Where
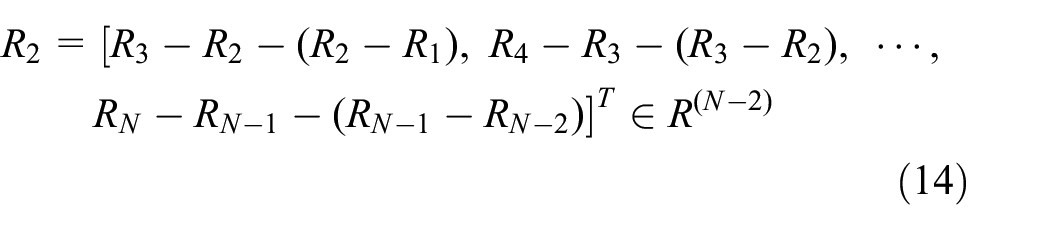
Set sequence Z contain N local extremun points, which can be represented by column quantities

The second-order trend of R is expressed in a discrete way as follows:
By that analogy, the discrete representation of any order trend of R can be obtained, that is, the d-order derivative of R can be represented by Dd:

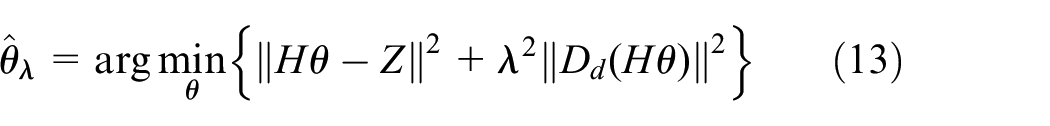
The solution in Formula (5) is
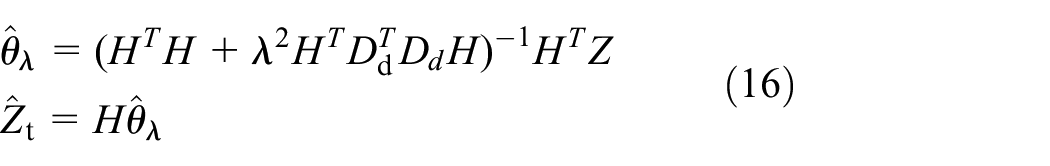
Where t is the estimate of the trend item that needs to be removed. The matrix H can be obtained by analyzing the characteristics of the original signal Z. In order to facilitate the analysis, H adopts the identity matrix

Then, the stationary part of the original signal after removing the trend item can be expressed as
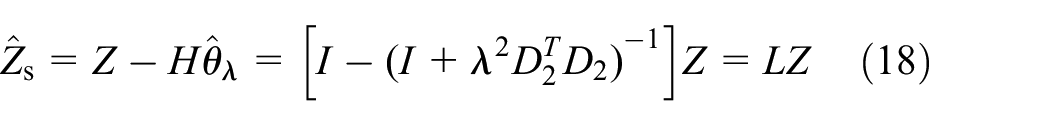
Where
MSS
The DFA (Detrend Fluctuation Analysis) analysis method was first proposed by Peng et al. 21 based on the DNA mechanism. This method uses the scale index to filter out the various trend components in the molecular chain sequence of the DNA, and successfully detects the degree of relevance and possibility in the sequence. Kantelhardt et al. proposed a multifractal de-trend fluctuation analysis method based on DFA, abbreviated as MFDFA. This method can easily calculate the scale index and multifractal spectrum, and perform effective analysis. Based on the MFDFA correlation analysis, it has been widely used in life sciences, environmental sciences, economics, and mechanical fault diagnosis.22–24 Among them, Among them, Hurst index correlation analysis has been proven to be one of the most reliable and important tools for studying the long-term correlation of non-stationary time series. The specific algorithm steps of MFDFA are as follows:
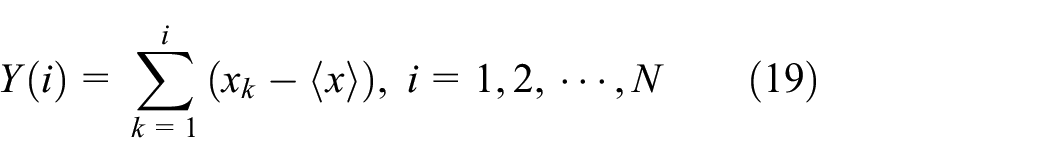
Remove the mean of the sequence

Then

At that time,

Calculate the mean value of

When q > 0,

If the time series are self-similar, then the q-order fluctuation trend of

In equation (25),
The Hausdorff dimension of the multifractal set of the time series is:

The overall singularity average of the sequence is:

The relationship of above two and


Multifractal Singulity Spectrum (MSS) can be obtained by the MFDFA method. The spectral parameters can describe the dynamic behavior of the multifractal time series. At the same time, the singularity index reflects the growth probability of the fractal in a small area, and characterizes the degree of unevenness of the time series distribution in the local probability measure.
Figure 2 shows the morphological characteristics and physical meaning of the “inverted bell-shaped” singularity spectrum. The slope

Characteristic parameters of MSS.
Improved algorithm prediction process
Starting from the nature of prediction and the state characteristics of complex mechanical systems, this paper introduces the concept of predictable time scale and SPA algorithm into the KNN prediction algorithm, and selects feature parameters based on the singular spectrum distribution to construct the sequence to be predicted, a dynamic SPA_KNN prediction method based on the MSS eigenvalues of the reciprocating compressor vibration time series is proposed. The basic steps are as follows:
Extract the “short-term” periodic vibration signals of the measuring points at equal intervals, and construct the characteristic time series X0 to be predicted,
Perform SPA decomposition on X0, and calculate the predicted time scale of the trend and de-trend component of each sampling segment according to the sampling period [T1, T2…Tn];
Extract the “short-term” multifractal singular spectrum eigenvalues of the trend and de-trend component, and form a feature sequence according to the extraction interval;
Create the initial modeling domain of the component spectrum sequence of different trend and de-trend items, and calculate the embedding dimension m and time delay τ according to the phase reconstruction algorithm;
Calculate the k neighbors of the phase distribution based on the prediction model, and obtain the predicted spectrum value with the mean deviation;
Repeat steps (4)–(5), the modeling domain rolls forward, and then predict;
Taking min[T1, T2…Tn] of the trend and de-trend item component as the cut-off time to form the predicted characteristic spectrum sequence.
The MSS parameter prediction flowchart of vibration time series based on the maximum credible scale is shown in Figure 3.

Prediction process of vibration time series based on maximum prediction scales for MSS.
Reciprocating compressor prediction example
According to the above process, select 2D12 type reciprocating compressor measuring point data (first and second bearing failures), combined with the development and evolution trend of its vibration time series, analyze the influence of the sequence length, sampling frequency and other parameters on the predicted credible time, Based on parameter optimization analysis and taking the gap fault of the two-stage connecting rod large-end bearing as an example, the effectiveness of the prediction method is analyzed.
A 2D12-70/0.1–13 double-acting reciprocating compressor was studied in Figure 4. Its shaft power is 500 kW, the exhaust volume is 70 m3/min, the exhaust pressure is 0.2746–0.2942 MPa, the piston stroke is 240 mm, the motor speed is 496 r/min, and the corresponding motor rotation frequency is 8.27 Hz. In order to facilitate the selection and analysis of sensitive measurement points for bearing vibration signals, eight measurement points were arranged at the cylinder end cover (inside and outside), crankcase, and crosshead to install the integrated circuit piezoelectric (ICP) acceleration sensors (CT1010LC), respectively, as shown in Figure 5. In this paper, we mainly study the reciprocating compressor secondary connecting rod sliding bearing clearance fault, and the time domain and spectrum plots obtained from the normal bearing clearance and excessive large head bearing clearance were collected at measurement points 6, 7, and 8, respectively, as shown in Figures 6 and 7.

Two-stage double-acting reciprocating compressor of type 2D12: (a) photos of the test bench; (b) and (c) sensor on the top of the crankcase and the crosshead guide surface.
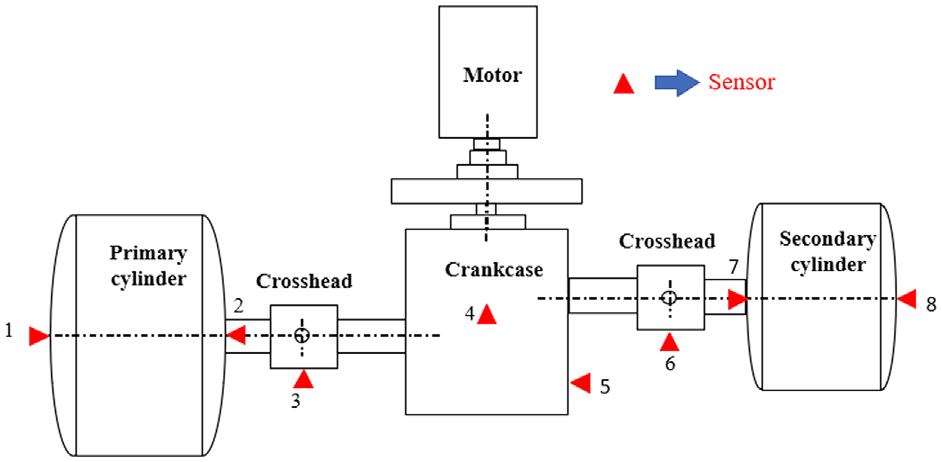
Distribution of measurement points for reciprocating compressor.

Signal time-frequency diagram for 6, 7, and 8 measurement points at normal condition.
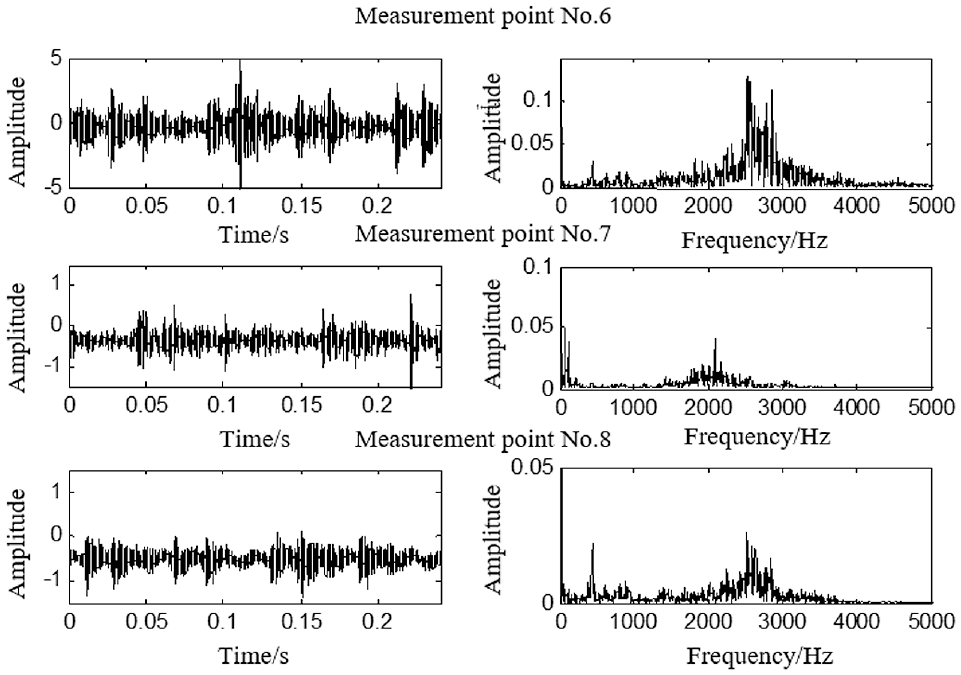
Signal time-frequency diagram for 6, 7, and 8 measurement points at fault clearance condition.
Since the bearing clearance fault signal is obtained through a complex transmission path on the surface of the body, the sample signal sampling point should be set to make the shortest transmission path from the source of the excitation force to the measurement point. That is, in the same failure mode, compared with the normal state, the energy increment of the sensitive measurement point will increase more than other measurement points, and this principle can be used to determine the sensitive measurement points in various bearing clearance fault modes. Table 1 shows the energy gain of each measurement point before and after the compressor secondary connecting rod bearing clearance failure, and the locations of the different fault sensitive measurement points are indicated in bold. It can be seen from Table 1 that for the secondary connecting rod large head bearing clearance fault sensitive measurement point location for the measurement point No. 6.
Vibration signal energy difference for each measurement point under different fault states.

In the simulation experiments carried out, the clearance states of each component of the secondary connecting rod of the 2D12 reciprocating compressor were studied, and a total of four states of normal clearance, bearing and crosshead failure were set. According to the technical manual for the use of piston compressors and the API-618 standard, a typical moderate wear failure was simulated for the secondary bearing assembly in the failure test, that is, the clearance of the secondary connecting rod small head bearing and crosshead were set to 0.15 mm, and the clearance of the secondary connecting rod large head bearing was 0.25 mm. The aim is to find an effective classification and identification method for the difficult to identify moderate wear faults, and to provide the underlying diagnostic algorithm support for the subsequent life prediction.
Prediction time and parameter analysis
Influence of parameters on the prediction time scale
According to the calculation process based on the chaotic time series model, taking the sampling sequence of the vibration signal of the moderate wear-sensitive measuring point of the secondary large-head bearing as an example, the influence parameters of the maximum predictive credibility scale are analyzed.
Figure 8 shows the saturation of the second-order Reyin entropy K2 with the embedding dimension m under different similarity tolerances r for the sampling sequence, that is, there is a downward jump near the embedding dimension m = 13. Search for the K2 value that does not change in the vicinity of m, as shown in Figure 9 (where r is the sequence index, not the actual value), and the calculated prediction time is

The relation between entropy of K2 and embedded dimension m.

K 2 value of the saturation similar tolerance r.
Considering the periodicity of the compressor vibration signal, combining the key phase signal and sampling frequency to divide the signal into different periods, considering the sampling frequency and sequence length, and analyzing the influence of each parameter on the embedding dimension m and the maximum prediction time T of different sampling sequences, The results are summarized in Table 2, which Vt represents the sampling interval.
Influence parameters analysis of prediction dependable scale for vibration signal.

It can be seen from Table 2 that for bearing moderate wear faults, when the sampling sequence meets the fluctuation trend and resolution, ensure that one vibration period is sampled, that is, the sequence length is more than 1000 points, and the maximum predictable scale is basically saturated at about 30 sampling interval which reflects the period-like characteristics of the vibration sequence, and the length of the sequence is consistent with the minimum suitable time sequence length required in the phase space reconstruction theory of the time sequence.
Fix the sequence length and sampling frequency, select representative bearing measurement points, analyze and compare the normal state and the fault state (fault type and working condition simulation are the same as described in the previous section), and observe that the various parameters are paired under different fault conditions. The results of the maximum prediction scale are summarized in Table 3.
Influence parameters analysis of prediction dependable scale for different working condition.

Table 3 shows that for different types of failures, the predicted credible time values differ significantly. For the bearing measuring point signal, the prediction credibility scale under normal conditions is relatively large. In the case of mild to moderate failure, due to the weakening of the quasi-period feature and the increase of the scale-free area of the fractal feature, the entropy value increases, and the prediction credibility time is shortened. In a severely worn state, the entropy value of the system does not converge and tends to a chaotic state, which is unpredictable.
It can be seen that the prediction model for predicting the credible time scale reflects the dynamic evolution trend of the system, and the model for predicting the credible time scale is a prerequisite guarantee for improving the credibility and accuracy of the prediction algorithm.
SPA_KNN algorithm based on predictive credibility scale
Through the prediction parameters analysis of the above time series, for the vibration signal prediction, limited by the prediction credibility scale, even if the vibration acceleration value is obtained at a finite time with a small error, the finite discrete prediction data value cannot be used for feature extraction and analyse.
Therefore, we consider that when constructing the sampling sequence, the “short-term” periodic sampling sequence at each sampling moment is used to replace the instantaneous value to construct the sequence to be modeled, so as to ensure that each “short-term” sampling moment contains at least one vibration period while obtaining a representative sampling sequence for a certain period of time. Two components of trend item and de-trend item are obtained through SPA decomposition, and characteristic parameters such as the spectrum width
Prediction examples and method evaluation
Following the SPA_KNN prediction process proposed in this section, the error analysis of the prediction results is carried out through examples.
SPA_KNN algorithm prediction example
Take the 2D12 type reciprocating compressor with a moderate wear failure of the secondary big head bearing as an example. To ensure the effective length of the sampling, while taking into account the evolution trend of the nonlinear chaotic sequence and the time limit factor of the sampling interval for the effectiveness of the prediction, each interval of the long-term sampling sequence 2 min intercepts about 2410 sampling points in two cycles (sampling frequency 10 kHz), and obtain 2-h interval sampling data. The number of SPA decompositions in each sampling period is two, and the maximum predicted credible time of each component sequence is calculated as
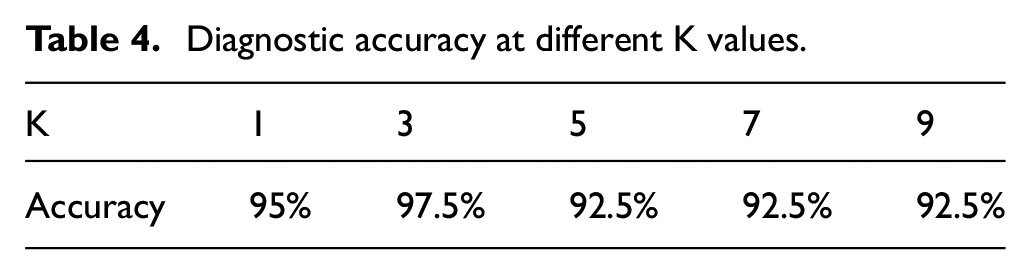
Since almost all the computations in the KNN algorithm occur in the classification phase, and the magnitude of the K value is directly related to the final classification accuracy. In general, the larger the K value, the more accurate the classification result. If the K value is chosen too large and the sample set is small, it will increase the computation and lead to the decrease of classification accuracy. The value of K is too small, but the number of neighbors obtained is too small, which will also reduce the classification accuracy. There is no definite formula for the K value, and generally by manually taking multiple K values for multiple training, the K value with the smallest classification result error is taken. In this paper, K values are taken as shown in the following table, and K = 3 is selected by the accuracy magnitude of K values in Table 4.
Diagnostic accuracy at different K values.
The phase space of the sequence is updated rolling, and a new modeling domain is constructed to re-predict the sequence to reproduce the dynamic evolution trend of the system in real time.
In the multifractal theory, it can be known that the singular spectrum index has an equivalent transformation relationship with the generalized dimension, and it is an effective tool for analyzing the partial shape characteristics of the signal. The effective extraction and analysis of the characteristic parameters based on the spectrum shape has been widely used in many fields.
Singular spectrum characteristic parameters:
The sensitivity of feature parameters to state is an important indicator for evaluating state feature extraction methods. How to improve the separability between different state features is the prerequisite for the selection and modeling of evaluation indicators. First, extract the 30-period multifractal singular spectrum feature quantity of the sensitive measuring point of the secondary connecting rod bearing moderate wear fault, and compare and analyze the stability and separability of each feature vector. The result is shown in Figure 10.

Eigenvalue of multifractal singular spectrum for vibration signals.
Before prediction, according to the analysis of the stability and separability of the MSS eigenvalues in Figure 10, the spectral center value and the spectral width are stable, and each eigenvalue has obvious nonlinear fractal characteristics, and the phase space reconstruction can be used. The improved KNN prediction model is constructed to predict, and the obtained prediction results can be further analyzed to achieve fault classification, performance evaluation, and life prediction.
The predicted values obtained are shown by the dotted lines in Figures 11 and 12. From the predicted trend of the feature parameters of the two components, it can be seen that the spectral parameters obtained by the prediction algorithm show the fluctuation and fractal characteristics of the vibration signal. Spectral width and central value of the two spectral parameters, for different components, the predicted value and actual value show good follow ability. In particular, the predictions within the first 20–25 prediction credible time intervals, that is, the predicted values within 50 min, have a high degree of agreement, which proves that the predicted values obtained under this sampling interval have a high degree of credibility.

Comparison between the predicted values and the measured values of

Comparison between the predicted values and the measured values of
Method comparison
The following is a comparative analysis of the three prediction methods of KNN, SPA_KNN and SPA&PSR_KNN, respectively, using the same measured data and regression analysis and error analysis for evaluation. Both methods select two spectral characteristic parameters (spectral width
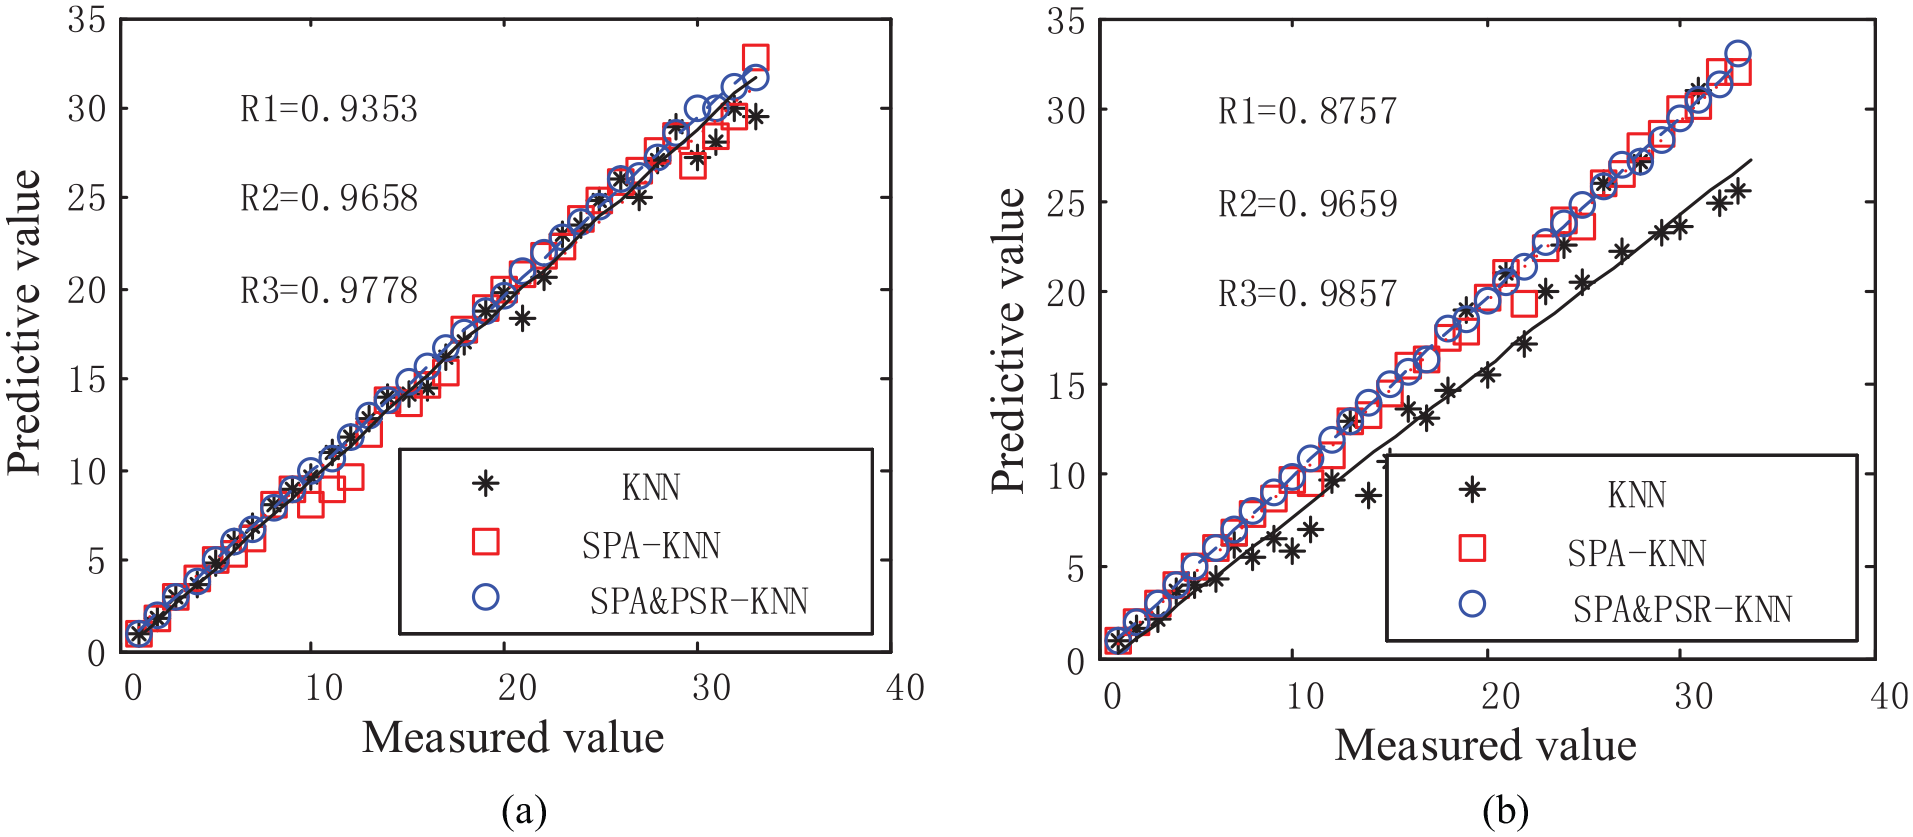
Regression analysis of

Regression analysis of
It can be seen from Figures 13 and 14 that the prediction regression curve slopes of the SPA&PSR_KNN method proposed in the four modes are all higher than those of the first two methods. Further analysis can also notice that the method based on SPA decomposition is better than the traditional KNN method in predicting the center value
In the error analysis, two indicators are selected: Standard Deviation (STD) and Root Mean Square Error (RMSE). The errors of each modal parameter are shown in Tables 5 and 6.
Comparison between prediction and measurement of
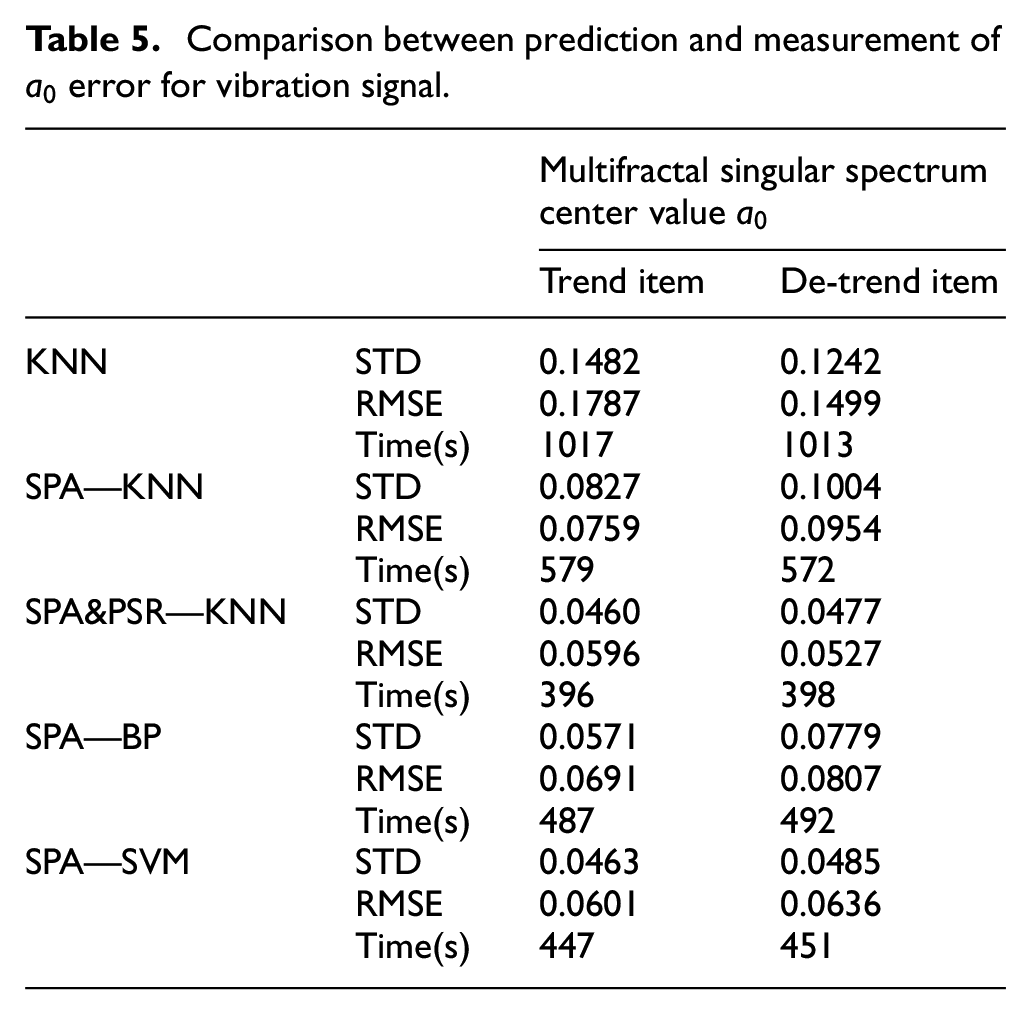
Comparison between prediction and measurement of

It can be seen from Table 5 and Table 6 that the error between the SPA&PSR_KNN predicted sequence and the measured sequence is the smallest. After singular spectrum feature extraction and analysis, Considering the error of the predicted value within 20–25 sampling intervals, the prediction of vibration characteristics in the future 40–50 min can be achieved. The predicted spectrum value
Conclusions
Starting from the factors affecting the accuracy of complex nonlinear predictions, this paper analyzes the applicability of non-parametric prediction methods in nonlinear classification and prediction, studies the evolution of system chaotic time series, and proposes a combination of SPA and KNN based on the maximum predictive credibility scale, the multifractal singular spectrum feature value is used as the prediction parameter to realize the prediction of the time series of the vibration signal of the reciprocating compressor.
Based on the theory of phase space reconstruction, a maximum predictive credible time algorithm is proposed from the perspective of information entropy minimization, and an improved time series phase space reconstruction KNN prediction model is constructed.
On the basis of singular spectrum distribution analysis, the spectrum parameter prediction sequence is constructed by the improved phase space reconstruction KNN algorithm, and the central value of the singular spectrum spectrum and the spectrum width of each component are selected as the prediction parameters, and the K neighbor dynamic extrapolation is performed within a credible scale, which improves the interpretability of prediction from the perspective of system evolution
Construct the variable parameter modeling domain with the predictive credibility scale as the precondition, and propose a complete SPA&PSR_KNN prediction algorithm flow. The example verification and error analysis show that compared with the traditional KNN algorithm, BP and SVM, the prediction results of the spectral characteristic parameters obtained by the algorithm have smaller errors and higher reliability, and the computation time of the proposed method is obviously better than other method. Moreover, if the spectral characteristic parameters can be combined with the fault classification threshold, which can further realize the degradation state assessment and life cycle analysis.
Footnotes
Appendix
Handling Editor: Chenhui Liang
Declaration of conflicting interests
The author(s) declared no potential conflicts of interest with respect to the research, authorship, and/or publication of this article.
Funding
The author(s) disclosed receipt of the following financial support for the research, authorship, and/or publication of this article: This work supported by Scientific Research Fund Project of Liaoning Provincial Department of Education (No. LG202031), the Funding of Shenyang Ligong University’s Research Support Program for High-level Talents (No. 1010147000819), High Level Achievement Construction Program of Shenyang Ligong University (No. SyluxM202101).