
Abstract
Laser processing of materials finds application in micro-nano devices mainly because of its accuracy, flexibility, and ability to machine almost any material. Although it offers numerous advantages, it is a complex process involving a large number of factors. The quality of machining often depends on the appropriate selection of parameters. Moreover, the output responses in machining processes have conflicting nature; some are to be minimized, and others have to be maximized. This work uses grey relationship analysis coupled with principal component analysis for multi-response optimization of conflicting responses during laser machining of micro-channels. Micro-channels with a cross-sectional size of 200 × 100 µm were created using Nd:YAG laser beam micro-milling in steel alloy (AISI 1045). The scan speed, layer thickness, and scan strategy were found to have a significant effect on the dimensional accuracy of the microchannel. At the same time, the material removal rate was mostly influenced by layer thickness. Multi-response optimization results suggest low pulse frequency, high scan speed, low layer thickness, and S3 scan strategy for accurately fabricating micro-channels.
Introduction
With the micro and nano system-based sector booming, capacities are sky-rocketing, and costs are nose-diving; thus, a plethora of avenues and equally large challenges are being witnessed. Laser is, in fact, one of the most potential routes as it is optic power, easy to maneuver, compatible with automation, noncontact operation, and free from electromagnetic residue. Ablation of material from a part’s surface about a laser path directly generated from the computer-aided design (CAD) data makes the laser machining very effective for micromachining. But, many process parameters and machining strategies that affect the performance characteristics complicate the machining process.1,2 While the pulse frequency, scanning speed, scanning strategy, peak power, and pulse width are among the significant parameters, the ratio of scanning speed to pulse frequency is a composite parameter (termed as overlap) which also significantly affects the vital responses, including roughness and accuracy. The machining application in sophisticated and high-end applications such as micro-fluidics and stents for biomedical use, components for MEMS, optical elements for photonics applications, etc., require the creation of precise micro-feature. 3 The production of precise features of micro-scale requires machining with very tight tolerances, and machining accuracy becomes prime most important.4–6
Conversely, long pulse lasers generate large-sized heat-affected zone (HAZ) due to greater heat accumulation during machining and multiple recast layers. 7 Besides pulse length or duration, the laser scan track path is another critical parameter affecting heat accumulation apart from texture. Hung et al. machined medical needles 5.112 mm in diameter and 0.234 mm in thickness made from NiTi shape memory alloy. In addition, it demonstrated the ablation mechanism altered with the change in the laser scan path. Specific laser machining paths produced wider kerf widths enabling debris removal easier, significantly enhancing the ablation rate, and reducing the energy accumulation to less than 50%. 8
Furthermore, while machining precision requires short pulse duration and high power density textured surfaces, the surface texture has also become an important response. The large-area-microstructured surfaces greatly increase contact angle at the liquid interface and enhance wettability in various liquid media, including water, oil, and oil-contaminated water. Ultra short pulses coupled with ultra-high power density and scanning pattern can effectively control the wettability of the machined surfaces.9,10 Typical nano-structured surfaces on thin materials are important to photon exchange required in solar energy harnessing and proton exchange membrane fuel cells (PEMFC). The laser micromachining, thus, is vital for functional and functionally graded surface creation. 11
Change in wettability becomes important to micro/nanofluidics, which finds increasing application in the modern systems (micro-resonators, micro-sensors, micro-motors, micro-turbine, and micro-pumps, etc).12,13 Lu et al. 14 investigated the micro-texturing on cemented carbide workpiece using Nd:YAG laser. The friction performance of micro-textured surfaces was examined for different laser incident angles. It was reported that there was a reduction in the depth of micro textures, laser machining temperature, and residual compressive stress inside the micro textures were decreased. Monocrystalline diamonds were studied for micro-machining using a picosecond pulsed laser. 15 The results revealed that the cracks propagated in a direction parallel to the top surface of the workpiece. The researchers suggested a method that can be utilized for low-cost polishing of diamond surfaces using laser micro-machining. Bhandari et al. 16 presented a comparative study for the fabrication of micro-channels on Ti6Al4V using the laser ablation method and Laser-Induced Plasma Micro-Machining (LIPMM). It was reported that LIPMM resulted in better micro-channels fabrication in terms of aspect ratio and channel depth. Calabrese et al. 17 compared the micro-milling process using laser and electrical discharge machining (EDM). Machining of various metals such as aluminum, titanium alloys, and stainless steel was performed. It was reported that laser machining showed better results in terms of material removal rate, though EDM provides good results in terms of geometrical accuracy. Vora et al. 18 investigated the laser cutting process of Ti6Al4V. Taguchi design and Pareto techniques were utilized for multi-objective parameters optimization. Input parameters under consideration were laser power, cutting speed, and gas pressure. The output variables were kerf width, dross height, surface roughness, and material removal rate. The optimized values of the parameters were presented in the results.
Balachninaitė et al. 19 utilized the Yb:KGW femtosecond laser system for micro-machining of steel and copper specimens. It was examined how the fluence affected the specific removal rates for steel and copper for single pulses and pulse bursts with various internal energy distributions. It was discovered that, in comparison to grooves ablated with single pulses, bursts generally result in much lower specific removal rates for steel and copper samples. In an another study of laser micro-machining to fabricate micro-channels, CO2 laser system was employed. 20 To create straight microchannels, four laser system parameters—speed, power, focal distance, and number of passes were varied. The channels dimensional performance measures were studied for three different bio-compatible materials. The results revealed that polydimethylsiloxane (PDMS), and microscope glass micro-channels performed better than the polymethyl methacrylate (PMMA), in rapid cell adhesion experiments. Few comprehensive literature reviews about micro-channels fabrication, 21 and use of laser for precise machining of engineering materials, 22 also reported that laser machining is a viable and good option for micro-channels fabrication.
Micro-channels are required in several applications such as heat exchangers in aerospace, biomedical devices, automotive, gas-turbine blades, air-conditioning and refrigeration, micro-electronics, etc. 23 Laser machining, due to its advantages such as high material removal rate, ability to machine a wide range of machining, and precision, is a good choice for machining micro-channels, especially in difficult-to-cut materials. 24 The high-quality surfaces that may be achieved with laser machining, in particular, reduce liquid flow turbulence and prevent the formation of micro cavities, which are crucial for bacteria multiplication, is an added advantage in bio-medical device fabrications. 25 However, laser machining has its challenges also, such as more heat-affected zone. 26 Especially in micro-machining, where features are minuscule, the heat-affected zone is an important issue. 27 Therefore, it is crucial to investigate the laser input parameters for optimized results.
Thus, a very wide variety of quality and response parameters are essential for numerous applications, several of which belong to micro-products. There are also many laser machining parameters, which typically affect response characteristics and their contribution, and the influence on every response is different. Given this situation, comprehensive investigations with specific laser machining parameters shall be important to facilitate the development, progress, and effective use of laser machining on micro-products. The present research has been planned to investigate important Nd-YAG laser machining process parameters on responses while micro-machining AISI 1045 steel, and a multi-response optimization was also performed to arrive at a unitary index, which may be indicative of the overall optimized response set on a large number of input laser machining factors.
Materials and methods
Lasertec 40 from DMG (Deckel Maho Gildemeister, Germany) equipped with Q-switched Nd:YAG laser with a wavelength of 1064 nm and a maximum laser output of 30 W was employed for machining of AISI 1045 steel. In either the normalized or hot-rolled condition, AISI 1045 steel exhibits great strength and impact qualities as well as good weldability and machinability. It is widely employed in all industrial applications that call for greater wear resistance and strength, including crankshafts, gears, axles, torsion bars, connecting rods, sockets, studs, etc. The laser beam was operated in fundamental Gaussian mode (TEM00) and was focused on the workpiece with the help of a Galvano scanner. The experimental setup is shown in Figure 1. The laser spot size and pulse width were kept constant at 30 μm and 10 μs, respectively. Table 1 shows the Lasertec 40 machining parameters.
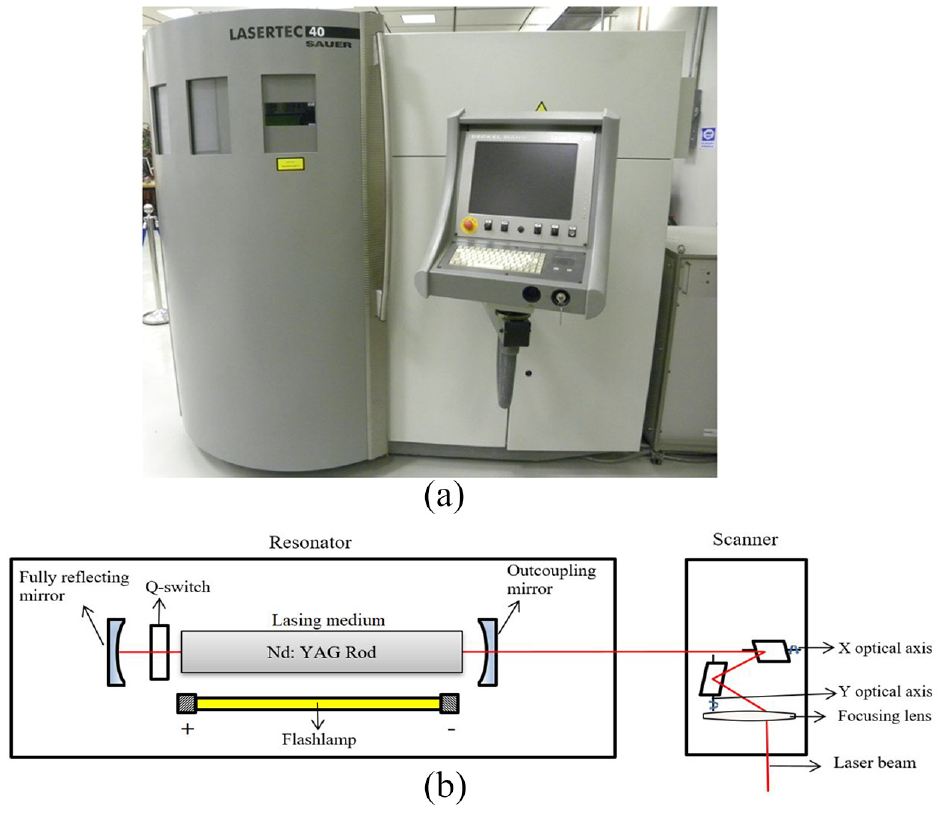
(a) DMG Lasertec 40 utilized in this research work and (b) schematic diagram of the laser setup.
Lasertec 40 specifications and parameters.

The micro-channel was designed in CAD software that was CATIA and later exported as stereolithographic (STL) format to Deskartes software and then to the machine software Lpswin for machine programming. The flow of file processing is depicted in Figure 2.

The flow of file processing in various software for laser micro-machining.
Because the incoming laser beam focuses on the top surface of the workpiece during laser beam machining (LBM), the flatter the surface is, the more consistency in laser focusing is ensured. The focus distance is significantly unequal throughout the work surface when the workpiece has a high surface roughness. As a result, all of the specimens were mechanically ground to reduce the surface roughness to a level that would not cause severe unevenness during laser focusing. Following sample preparation, the samples were mounted on the machine table with the use of a fixture, and preliminary settings such as calibration, machine zero setup, and workpiece zero setup were completed.
Based on the IV optimal design methodology, 65 experimental runs were performed to determine the effect of laser process parameters on the quality of micromachining. The selected parameters and their respective levels are shown in Table 2.
Laser machining process parameters and their levels.

In order to determine the laser intensity that can achieve the desired layer thickness in each experimental run, preliminary tests were performed. After setting up the input process parameters viz frequency, scan speed, track displacement, and scan strategy, a test square cavity was machined with initial laser intensity for 20 laser scans. The resulting depth and depth per scan were evaluated using an automated touch probe. The laser intensity was varied accordingly until the desired layer thickness was achieved with good repeatability. The process flowchart is shown in Figure 3.

Determining the laser intensity for the desired layer thickness and input parameter.
Frequency is the number of laser pulses per second, the scanning speed is the speed of laser beam scanning in mm/s, the layer thickness is the thickness of material removed during one complete scan, track displacement is the distance between two consecutive laser scan lines, and the scan strategy is the manner in which laser scans are maneuvered over the work surface. The scan strategy used in this work is in terms of hatch angles of the laser scans, as shown in Figure 4.
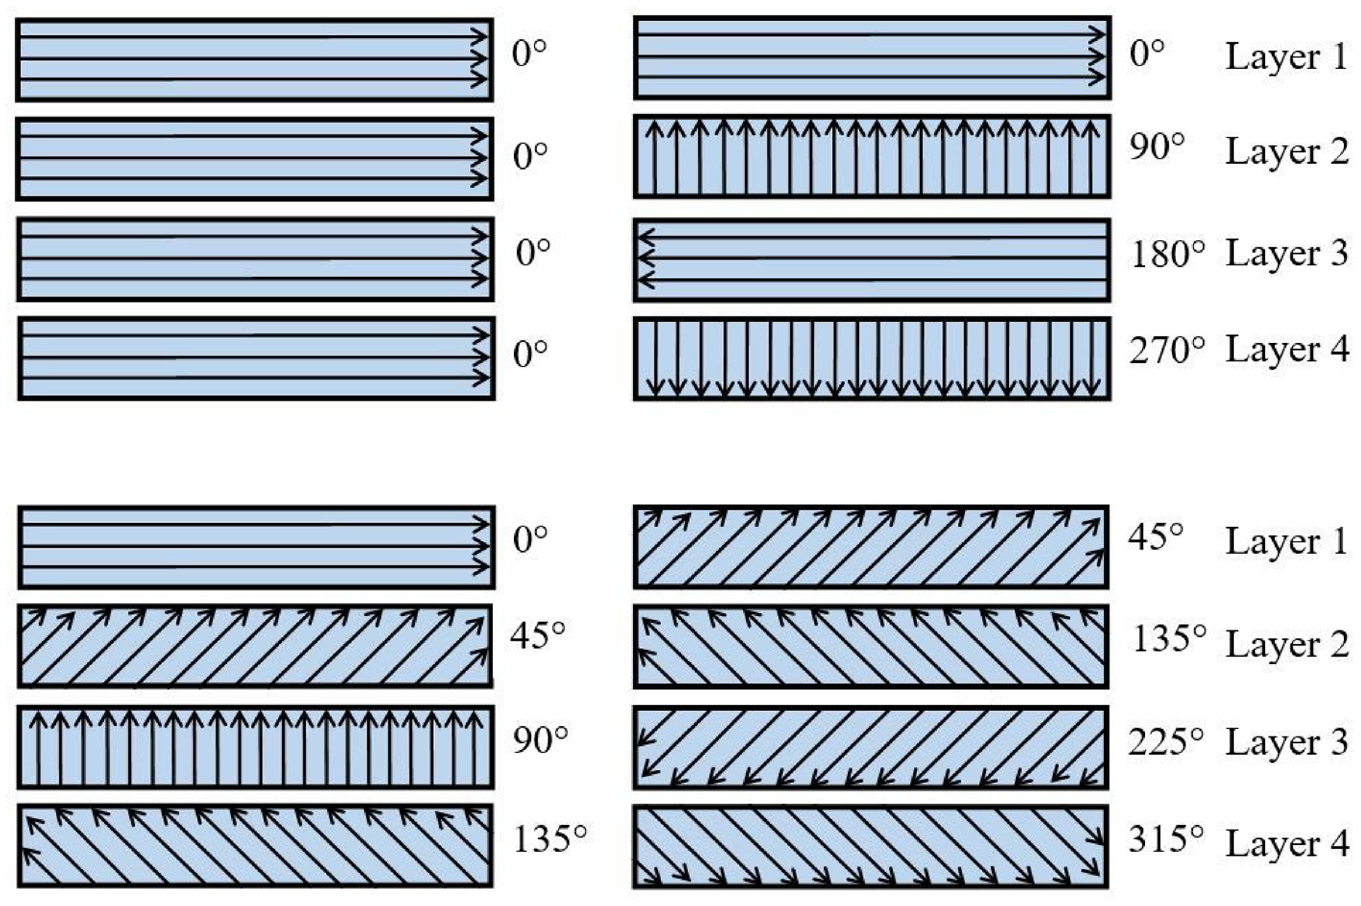
Selected scan strategies and their respective angular orientations.
To systematically investigate the effects of laser process parameters on the quality of micro-channels, Optimal Design IV-based robust methodology was employed, and 65 laser-machining runs were performed. The micro-channels of dimension 0.2 × 0.1 × 5 mm were machined by simultaneously varying selected factors. The range of variables and levels is shown in Table 3.
Experiment design and measured responses.

The machined channels were cut through the cross-section using Isomet 1000 precision saw from Buehler®. After grinding, polishing, and etching they were viewed under Scanning Electron Microscope (SEM; JSM-6610LV, JEOL, Tokyo, Japan) in order to reveal the microstructure and thus the recast layer. The cross-sections were analyzed with respect to top width error, taper angle, recast layer thickness, and material removal rate (MRR). Top width error is the difference between the designed width and the actual measured width at the top of the channel. The taper angle is the angle of the channel wall with respect to the line perpendicular to the base surface of the channel, and recast layer thickness is the thickness of re-solidified molten material at the bottom of the channel. MRR is the volume of material removed in µm3 upon the machining time in second.
Results and analysis
Micro-channels were found to be uniform throughout the length of the channel. Figure 5 shows the laser machined specimen and sample in an epoxy mold for analysis.

(a) Laser machined channels and (b) sample in the epoxy mold for analysis.
The SEM image of the channel cross-section and the recast layer on the channel base is shown in Figure 6(a) and (b), respectively.

SEM images of (a) channel cross-section and (b) recast layer.
The measured responses R1, R2, R3, and R4, as mentioned in Table 3, may have a contradicting nature (i.e., some need to be maximized, whereas some need to be minimized). Moreover, a different response may be optimum for a different set of parameter combinations; consequently, a correct parameter setting that gives the best overall response is difficult to find. Under such a situation, multi-response optimization is helpful in which individual responses are suitably merged into a single multi-response characteristic. The contradicting relationship between input parameters with individual responses is tackled by converting the measured responses into a signal-to-noise ratio (S/N ratio). Consequently, the S/N ratio of these responses can be normally treated during subsequent analysis. Three methods for calculating S/N ratios depending on whether the responses should be minimized/maximized or nominal are defined as: Lower-the-better, Higher-the-better, and Nominal-the better, respectively. The method of calculation of the S/N ratio is discussed elsewhere. 13 The S/N ratios of R1, R2, and R3 were Lower-the-better, while R4 was Higher-the-better. All measured responses and the calculated S/N ratios of every response are given in Tables 3 and 4, respectively.
The calculated SN ratio of the measured responses.

Analysis of variance
ANOVA tests with 95% confidence were performed to determine the significance of selected factors on the responses. Values of “Prob > F” less than 0.0500 indicate model terms are significant with an α of .05. Values greater than 0.1000 indicate the model terms are not significant. Table 5 shows the ANOVA results for width error. Scan speed, scan strategy, interaction of scan speed, scan strategy, and the interaction of scan speed and track displacement were found to have a significant effect on the dimensional error. Table 6 shows the ANOVA results for the taper response. Layer thickness and scan strategy were found to have significant effect on the taperness of the microchannel. In addition the interactions of layer thickness with frequency, scan speed and scan strategy were found to significantly influence the taper angle of the microchannel. Table 7 presents the ANOVA results for the response recast layer. It can be seen that scan speed and scan strategy have a significant effect on the recast layer formation. The interactions of frequency with layer thickness and track displacement in addition to the interaction of layer thickness and scan strategy have the significant effect on the recast layer. Table 8 presents the ANOVA results for MRR. Scan speed, layer thickness, and track displacement were found to have significant effect on the MRR.
ANOVA results for width error with respect to the selected parameters.

ANOVA results for taper with respect to the selected parameters.

ANOVA results for recast layer with respect to the selected parameters.

ANOVA results for MRR with respect to the selected parameters.

Grey relational analysis
The S/N ratios of these can now be normally treated during conversion into a unified multi-criteria characteristic. The multi-criteria characteristic was obtained through Grey relational analysis-based principal component analysis or Grey-PCA.28,29 Grey relational analysis obtains a normalized sequence of S/N ratios in which the data of all the responses become comparable between a normalized range of zero and one. The normalized S/N ratio xij for the ith performance characteristic in the jth experiment can be expressed as in equation (1).

In the next step of the grey relational analysis, the normalized sequence is converted into a deviation sequence by subtracting it from 1. The normalized and deviation sequences of the S/N ratios are given in Table 9. The deviation sequence is further processed to obtain a grey relational coefficient (GRC). The GRC ξij for the ith response in the jth experiment can be expressed as per equation (2).

Normalized and deviation sequences.

In equation (2), xio is the ideal normalized S/N ratio for the ith performance characteristic and ξ distinguishing coefficient which is defined in the range 0 ≤ ξ ≤ 1, and it is usually taken as 0.5. The values of GRC as calculated by equation (2) and given in Table 7 although lie within the comparable range of zero-to-one but are still unique to individual responses. The GRCs of individual responses should be combined effectively to obtain a single multi-response characteristic. During aggregation of individual GRCs, weightings which commensurate with their contribution in the multi-response must be applied. There are various methods by which weightings can be established, a large number of which are subjective in nature. But the principal component analysis (PCA) effectively establishes the inherence contribution of the individual GRCs through statistical processing without subjectivity.
Thus, in this work, grey relational analysis coupled with principal component analysis (Grey-PCA) is employed to simplify the selection of input parameters, resulting in the best overall quality represented by a single multi-response characteristic.
Principal component analysis
To determine the weightings of individual responses, GRC PCA was employed. Processing of GRC for the PCA simplifies a large number of correlated variables into fewer independent principal components based on which the weighting is determined. During processing, the elements of the GRC data matrix are transformed into corresponding eigenvalues through which the principal components are calculated.
A step-by-step procedure of the Grey-PCA is given in Abidi et al. 28 As per the procedure, during PCA, the array of GRC is processed to generate the covariance coefficients (Rjl) as per equation (3).

where, in xi(l) is the element of GRC array, (Cov(xi(j), xi(l))) is the covariance of sequences xi(j) and xi(l); σ(xi)(j) is the standard deviation of sequence xi(j); σ(xi)(l) is the standard deviation of sequence xi(l). The covariance matrix generated by utilizing equation (3) is given in Table 10.
Grey relational coefficients and the grey relational coefficients and Grades.

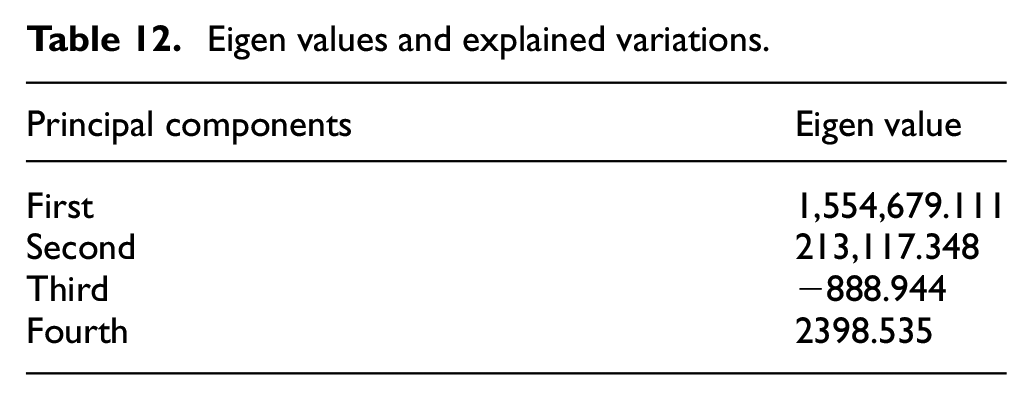
The covariance matrix, as given in Table 11, was used to find eigenvectors corresponding to each eigenvalue, and the same is listed in Table 12. The eigenvectors of the eigenvalue of the covariance matrix are aligned in descending order and represent the principal components. The first principal component accounts for the most variance in the data, and its square is taken as the weighting of the corresponding performance characteristic.
Covariance matrix.

Eigen values and explained variations.
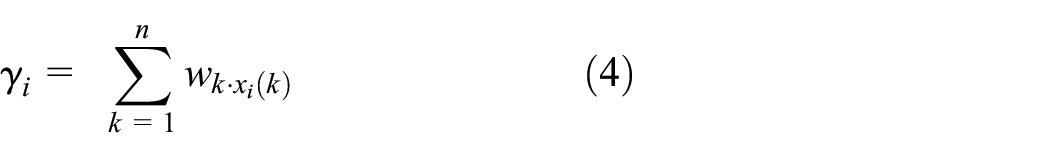
The contributions of width error, taper, recast layer, and MRR are shown in Table 13. These contributions are indicated as 0.002025, 0.304704, 0.682276, and 0.010816. The weighting coefficients (or contributions) w1, w2, w3, and w4 (i.e., wk, k = 1–4) were thereby set as 0.002025, 0.304704, 0.682276, and 0.010816, respectively. After the weighting factors wk the single multi-performance characteristic that is, grey relational-PCA grade GRG (
Eigenvectors for principal components and contributions of corresponding responses.

Based on equation (4) and data listed in Table 4, the GRGs were calculated as shown in Table 10. Thus, the optimization design performed with respect to a single multi-criteria grey relational-PCA grade simplifies the complexities arising from the contradicting nature and varied levels of significance of individual responses. A plot of GRG with respect to standard experiment order is given in Figure 7, which depicts how the GRC pans out across an entire range of experiments.

Scan strategy employed during laser machining.
Analysis of means (ANOM)
The single multi-criteria characteristic represented by the GRG makes optimizing the experimental conditions within the selected range of process parameters easy. Analysis of means (ANOM) was performed to find the condition for the highest GRG. The ANOM was performed by calculating the level-wise average of the GRG for all the laser micromachining process parameters. The ANOM plot is given in Figure 8. The ANOV is a simple statistical analysis technique to find optimized machining conditions by identifying the sequence of levels of factors that give the highest GRG values. The ANOM gives that the average values of GRG for the laser machining process parameters are highest for factor A at level-1, Factor-B at level-3, factor C at level-1, factor D at level-1, and factor E at level-3. Thus, the optimum process parameter condition for the laser micro machining can be identified as A1B3C1D1E3. Table 14 presents the confirmation experiments for the first few optimum process conditions based on the grey relational grade and rank.

Effect of levels of laser micro machining process parameters on the RGR.
Confirmation experiments for the optimum process conditions.

Discussion
The laser fluence greatly varies across the focal cross-section from the center to its maximum expanse. The fluence is maximum at the center and fades out at the periphery. The ablation occurs over in the focal plane over the width where the fluence exceeds the threshold. The threshold fluence is found to depend on the pulse frequency, and the two have an inverse kind of relation. 30 The ablation is deeper near the center due to fluence being intense. The variation in tracks formed by the array of ablation during laser scans generates the footprints of the width and depth errors during machining. 31 The variation in the depth for a given width results in the taper, which in turn causes variation in the surface roughness. The aggregated width and depth errors which themselves are mutually related, are also directly related to the surface roughness. 32 An error in the width of the track, its depth, and taper in the wall of the track; all are responsible for the machining errors. It is found that width error is mainly affected by the scanning speed, whereas the layer thickness mainly affects taper angle and is consequently primarily responsible for the taper.
The statistically determined Grey-PCA weightings for all responses (width error, taper, recast layer, and MRR) established that the contribution of width error on the multi-response characteristics is negligible (0.002025) and that of MRR is significantly less (0.018016), whereas for rest of the two responses the contribution is high. It may be attributed to the combined effect of the individual input process parameters within the selected range. The variation in the values of levels of numeric parameters within the feasible ranges is 40%, 100%,100%, and 25% for frequency (A), scanning speed (B), layer thickness (C), and track displacement (D), respectively. Moreover, these parameters have a mutual interaction effect, some of which are cumulative and some conflicting. Evidently, rastering of beam over narrow track displacement may result in the overlap of the width of ablation between successive scans and consequently result in effects of all process parameters on the MRR and width of ablation (and hence the width error too) to reduce significantly. Narrow track displacement also results in more profound ablating action and accounts for greater variations in the taper angle. Level-wise variations in the values of scanning speed and layer thickness are the highest among all process parameters.
Further, the scan strategy is non-numeric in nature, but it has a significant impact on the total number of scans, total scan time, and the start-to-finish order of successive layers has a considerable effect on net energy input in each of the strategies. Reversal of order (of start to finish) direction of scans provides less time for energy dissipation and causes higher net energy input. The number of breaks in scans is least for hatch angles 0° and 180°, highest for 90° and 270°. The optimized scan strategy thus evens out the breaks in scans, resulting in a more stabilized energy supply during laser micro-machining.
Conclusions
Optimal design IV methodology, along with GRA and PCA, has proved to be a valuable tool in comprehending the effects of laser process parameters on the performance measures during laser machining of micro-channels in AISI 1045 steel. The following conclusion can be drawn from the study:
Scan strategy and scan speed were found to have a significant effect on the dimensional accuracy of the micro-channels.
Taper angle was found to increase significantly with an increase in layer thickness due to an increase in the laser fluence.
Low layer thickness and moderate pulse frequency resulted in micro-channels with the least recast layer thickness.
Multi-response optimization is characterized by low pulse frequency, high scan speed, low layer thickness, and S3 scan strategy.
Footnotes
Handling Editor: Chenhui Liang
Declaration of conflicting interests
The author(s) declared no potential conflicts of interest with respect to the research, authorship, and/or publication of this article.
Funding
The author(s) disclosed receipt of the following financial support for the research, authorship, and/or publication of this article: The authors extend their appreciation to King Saud University for funding this work through Researchers Supporting Project number (RSP2022R499), King Saud University, Riyadh, Saudi Arabia.