
Abstract
Taking the cracked pipeline as the research object, different preloads were applied on the cross section of the pipeline to produce different stresses at the crack tip, and these stresses were introduced into the pipeline as the residual stresses by restart method. And then, the apparent fracture toughness of pipeline under different constraints considering residual stress, and the interaction between residual stress and constraint were systematically studied. The results showed that the residual stress had a certain promoting effect on the improvement of the apparent fracture toughness of the pipeline. Compared with the pipeline with low constraint, the apparent fracture toughness of the pipeline with a high constraint was more sensitive to the change of residual stress, it was mainly related to the Mises stress at the crack tip and the triaxle principal stress.
Introduction
Pipeline, as an important transportation tool for water, gas and oil, etc., is the artery of energy. However, due to the limitation of the manufacturing process and the harsh service environment, the pipeline often fails in the form of corrosion fatigue, stress corrosion, ductile/brittle damage and fracture.1,2 Thus, it is particularly needed to conduct a detailed study on the failure behavior of the pipeline.
Residual stress is an important factor affecting the failure behavior of pipelines. To measure the residual stress accurately, in 1933, Mathar 3 first proposed the borehole method, which was widely recognized and applied in the 1940s. In 1950, Soete and Vancrombrugge 4 measured residual stress using resistance strain gauge, and greatly improved the measurement accuracy. In 2001, the American Society for Testing Materials had also issued standard ASTM E837-01e1 for determining residual stresses. 5 To study and understand the influence of residual stress on failure behavior, Mahmoudi et al. 6 reproduced the residual stress using local out-of-plane compression (LOPC) method, and studied the effects of residual stress on apparent fracture toughness. Chen et al. 7 investigated the effects of residual stress on creep damage and crack initiation by numerical analyses.
In addition to the residual stress, constraint also has significant effect on the failure behavior of pipelines. Constraint is the resistance of a structure against plastic deformation, 8 and it is influenced by the structure geometry, initial crack size and loading. The loss of constraint will increase the load bearing capacity and the apparent fracture toughness of cracked components. Taking axially cracked pipeline with semi-elliptical surface crack of different sizes as the research object, Liu et al. 9 studied the influence of creep constraint on pipeline life assessment. The results showed that the creep constraint effect will reduce the strength and service life of the pipeline. Wang 10 selected the creep constraint parameters R* and R to quantitatively characterize the creep constraint of cracks in a high-temperature pipeline structure, and the effects of pipeline structure geometry, loading mode, crack size, crack tip distance, creep time and crack orientation on R* and R were numerically calculated and analyzed by 3D finite element method. Tun et al. 11 analyzed the creep crack propagation of internal radial-axial external crack and radial-circumferential internal crack in a pressurized cylinder using an analytical method. The results showed that the residual life of the inner radial-circular surface crack of 316 stainless steel was about 53 times that of the outer radial-axial surface crack under the same crack size and load conditions.
In the pipelines, residual stress and constraint coexist, which together affect the failure behavior of the pipelines. To study the failure behavior of pipelines comprehensively, the influence of both residual stress and constraint should be considered. However, there are few studies which considered both of them for the pipelines. Wu 12 established a prediction model of creep crack incubation period coupling residual stress and constraint effect, and studied the prediction of creep crack incubation period. Wang et al. 13 established the simulation model for coupling the constraint and the stress fields in the welding process, and studied the influence of constraint on the residual stress for the weld of oil and gas pipelines using ANSYS simulation software. Zhuo et al. 14 studied crack tip opening displacement (CTOD) and constraint parameter R for different specimens and residual stresses, the results showed that crack tip constraint R elevated with the increase of residual stress.
In view of this, the authors taken the primary circuit main pipeline of pressurized water reactors in nuclear power plants, which is one of the seven key components of the nuclear island and is called the ‘aorta’ of the nuclear power plant as the research object, to investigate the effects of residual stress and constraints on the apparent fracture toughness. Firstly, different preloads were applied on the cross section of the pipeline to produce different stresses at the crack tip. Then, these crack tip stresses were introduced into the pipeline as the residual stresses using restart method. Finally, the apparent fracture toughness of pipeline under different constraints and residual stresses were studied, and the interaction between residual stress and constraint were also systematically discussed.
Pipeline and scheme design
Pipeline
The pipeline was manufactured by a ferritic low-alloy steel A508, whose Elastic modulus is 202,410 MPa, and Poisson’s ratio is 0.3.15,16 The true stress-strain curve was shown in Wang et al.,15,16 Yang and Wang, 17 and Yang et al. 18
Figure 1 shows the size of the pipeline, which was the same as the size of primary circuit of a nuclear pressurized water reactor. The pipeline thickness t was 83.5 mm, and the outer and inner diameters of the pipeline were 945.5 and 778.5 mm, respectively. The operating internal pressure of this pipeline was 17 MPa.

Geometry of the pipeline.
To study the influence of constraint caused by initial crack size on the apparent fracture toughness of pipeline, the circumferential crack with different crack lengths 2c and crack depths a was set.
Finite element modeling
The ABAQUS software was used to calculate the J-integral and the distributions of stress and strain at the crack tip of pipelines with different constraints and residual stresses. According to the symmetry of the pipeline, half model of the pipeline was established. The internal pressure was its operating pressure 17 MPa, and the axial force generated by the internal pressure was 35.786 MPa according the Lame formula. The bending moment M was applied to the right end of the pipeline, the left side of the pipeline was fixed. The 3D 8-node brick element with reduced integration (C3D8R) was selected as the mesh element. Figure 2 shows the mesh of the typical pipeline (a/t = 0.5, a/c = 0.5). There was a finer mesh at the crack tip, and this typical pipeline model contained 60080 elements.
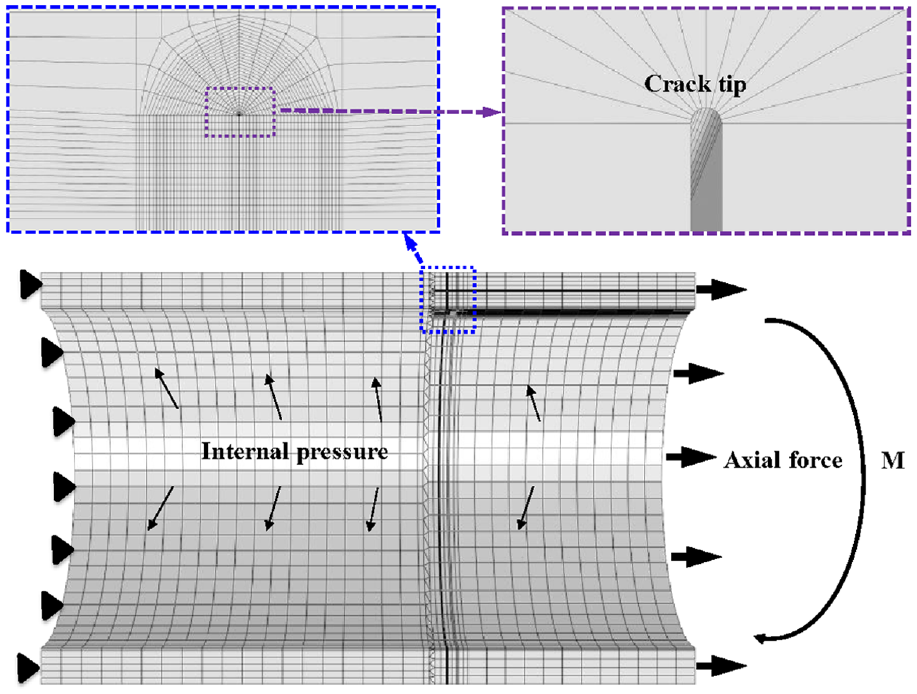
Typical finite element model of cracked pipeline.
Introduction of the residual stress
In ABAQUS software, copied the ‘Model’ built in Section ‘Finite element modeling’ as ‘Model-copy’. In the ‘Model’, removed all the working loads and boundary conditions, and applied different preloads (0, 1, 10, 20, 50, 100, 150 and 200 MPa) on the cross section of the pipeline to produce different stresses at the crack tip, as shown in Figure 3. Through the restart method in the software, the crack tip stress in the ‘Model’ was introduced into the ‘Model-copy’ as the residual stress (only the stress field was introduced, without the strain field). 19 The restart method for introducing residual stress was developed from the local out-of-plane compression (LOPC) technique. 6

The preload of the pipeline.
When the residual stress was introduced into the ‘Model-copy’, applied the working loads described in Section ‘Finite element modeling’, and calculated the J-integral and the distributions of stress and strain under different constraints and residual stresses. The apparent fracture toughness of the pipeline was further determined.
The determination of apparent fracture toughness
In the previous studies, the authors20–23 defined a unified constraint parameter, Ap, based on the area enclosed by the equivalent plastic strain, εp, contour before the crack tip, which could numerically characterize different constraint states. The unified constraint parameter, Ap, is defined in equation (1):
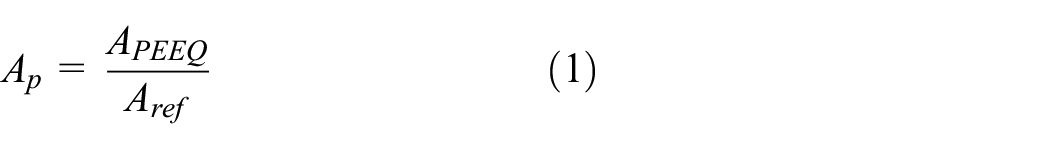
where APEEQ represents the area surrounded by the equivalent plastic strain (εp) contour in front of the crack tip and Aref is the area surrounded by the εp contour in a reference specimen.
For a material, there is a unified correlation line between the apparent fracture toughness JC and the constraint parameter Ap, named the JC/Jref-

The fracture curve of material A508.
Results and discussion
Apparent fracture toughness of pipeline with different crack lengths
Figure 5 shows the fracture curve versus crack driving curve of the pipeline with different crack lengths (a/c = 0.2, 0.4, 0.5, 0.6 and 0.8, a = 41.75 mm) under various preloads (0, 1, 10, 20, 50, 100, 150 and 200 MPa). It can be found that with increases in preload, the crack driving curves moved to the right for all the pipelines. Under a high constraint (a/c = 0.2, when the c is fixed, a smaller a/c means a longer crack length a), the trend was more pronounced. Because the intersection point of fracture curve and crack driving curve is the fracture point which reflects the apparent fracture toughness, that is, the apparent fracture toughness of the pipeline increases with the increasing of preload. A quantitative description of the apparent fracture toughness will be discussed in Figure 6.

The fracture curve versus crack driving curve of the pipeline with different crack lengths: (a) a/c = 0.2, (b) a/c = 0.4, (c) a/ c = 0.5, (d) a/c = 0.6 and (e) a/c = 0.8.

Apparent fracture toughness of pipeline with different crack lengths under different preloads.
In addition, it can also be found from Figure 5 that the ordinate of most of intersection points was less than 1. This means that the constraint of pipeline with these crack lengths is higher than standard specimen, and non-conservative results will be obtained if the cracked pipeline is evaluated using plane strain fracture toughness.
The apparent fracture toughness of pipeline with different crack lengths under various preloads is displayed in Figure 6. It can be observed that the apparent fracture toughness was almost stable when the preload was less than 50 MPa and it increases significantly when the preload was greater than 100 MPa. Under a high constraint, residual stress had a greater influence on the apparent fracture toughness of pipeline. For example, when the preload was 200 MPa, the apparent fracture toughness with a/c = 0.2 increased 11.3% compared with that without residual stress. While the apparent fracture toughness of pipeline with a/c = 0.4, 0.5, 0.6 and 0.8 increased 4.6%, 3.9%, 4.5% and 1%, respectively. In previous study, it was found that with the increasing of crack length (decreases in a/c), the apparent fracture toughness of pipeline was basically stable at first, and finally increased, 24 which is consistent with the results in this paper.
To further explain the mechanical essence of the above variations, the crack tip Mises stress caused by different preloads under various crack lengths in ‘Model’ was extracted, as shown in Figure 7, the Mises stress will be used as the residual stress in the ‘Model-copy’. It can be seen from the Figure that with increasing of preload, the crack tip Mises stress increased rapidly at first and then slowly. When the preload was lower than 50 MPa, the residual stress produced by preload increased gradually but it was not enough to have a significant impact on the apparent fracture toughness. When the preload was higher than 50 MPa, the Mises stress produced by preload had a significant impact on the apparent fracture toughness. The Mises stress for crack with a/c = 0.2 was significantly higher than other cracks, which was consistent with the trend shown in Figure 6.
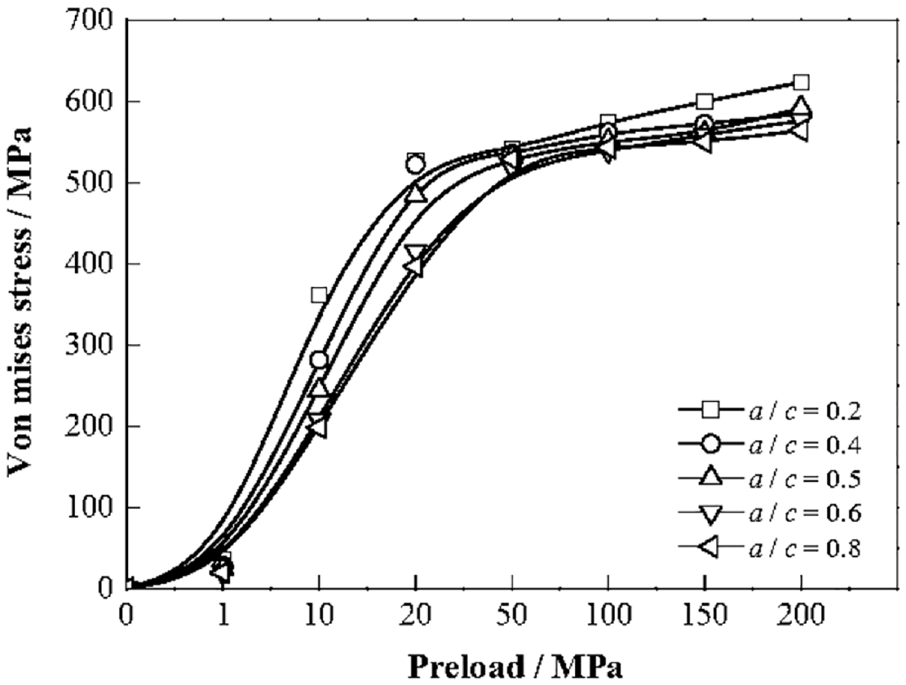
Crack tip Mises stress caused by different preloads under different crack lengths in ‘Model’.
When the pre-load was 150 MPa, the crack tip triaxle principal stresses of pipeline with different crack lengths were shown in Figure 8. It should be pointed out that all of the triaxle principal stresses at the crack tip were compressive stresses, which increased the apparent fracture toughness of the pipeline. In the crack opening direction, the principal stress was the highest (1812.40 MPa) when the crack length a/c = 0.2, and this is also the reason why the increment of apparent fracture toughness with crack length a/c = 0.2 in Figure 6 was the greatest. In the Wang et al., 25 the results showed that apparent fracture toughness had a correspondence with the maximum residual stress value around the crack tip. Localized compressive residual stress increased the apparent fracture toughness whereas decreased due to localized tensile residual stress. It is consistent with the results of this paper.

Crack tip triaxle principal stresses of pipeline with different crack lengths when the pre-load was 150 MPa: (a) a/c = 0.2, (b) a/c = 0.4, (c) a/c = 0.5, (d) a/c = 0.6 and (e) a/c = 0.8.
Apparent fracture toughness of pipeline with different crack depths
Figure 9 elaborates the fracture curve versus crack driving curve of the pipeline with different crack depths (a/t = 0.2, 0.4, 0.5, 0.6 and 0.8, 2c = 167 mm) under different preloads. The same with Figure 5, with increases in preload, the crack driving curves moved to the right for all the pipelines with different crack depths. Under a high constraint (a/t = 0.6 and 0.8), the trend was more pronounced, and the apparent fracture toughness increased with the preload increasing. But the ordinate of most of intersection points was less than 1. When the preload was higher than 100 MPa for the pipeline with crack depth a/t = 0.8 and the preload was higher than 200 MPa for the pipeline with crack depth a/t = 0.6, the ordinate of intersection points was greater than 1. Considering the results of Figures 5 and 9, it can be concluded that the constraint of pipeline with these crack sizes was higher, which should be paid attention in the structure integrity assessment.

The fracture curve versus crack driving curve of the pipeline with different crack depths: (a) a/t = 0.2, (b) a/t = 0.4, (c) a/t = 0.6 and (d) a/t = 0.8.
The apparent fracture toughness of pipeline with different crack depths is illustrated in Figure 10. It can be seen that with increasing of pre-load, the apparent fracture toughness of pipelines with different crack depths showed a gradual upward trend as a whole, and the change of apparent fracture toughness for pipelines with deep cracks a/t = 0.6 and a/t = 0.8 was more obvious than that of pipelines with shallow cracks a/t = 0.2, 0.4 and 0.5. For example, when the preload was 200 MPa, with increases in crack depth a/t, the apparent fracture toughness increased 2.1%, 3.4%, 3.9%, 11.9% and 7.7%, respectively. In addition, with increases in crack depth (a/t), the apparent fracture toughness showed a trend of first decreases and then increases, which was also consistent with the previous study. 24

Apparent fracture toughness of pipeline with different crack depths under different preloads.
The variation trend of apparent fracture toughness in Figure 10 can be explained in Figure 11. The same as Section ‘Pipeline’, the crack tip Mises stress increased with increasing of preload. However, the Mises stress produced by preload had a significant impact on the apparent fracture toughness only with the preload higher than 50 MPa. The Mises stresses for cracks with a/t = 0.6 and a/t = 0.8 were significantly higher than the other cracks. In addition, with increases in a/t, the crack tip Mises stress of the pipeline decreased first and then increased, which was consistent with the change rule of apparent fracture toughness.

Crack tip Mises stress caused by different preloads under different crack depths in ‘Model’.
When the pre-load was 150 MPa, the crack tip triaxle principal stresses of pipeline with different crack depths were shown in Figure 12. The same as Figure 8, all of the triaxle principal stresses at the crack tip were compressive stresses, which increased the apparent fracture toughness of the pipeline. In general, the triaxle principal stress of pipeline with deeper crack was higher than that with shallower crack.

Crack tip triaxle principal stresses of pipeline with different crack depths when the pre-load was 150 MPa: (a) a/t = 0.2, (b) a/t = 0.4, (c) a/t = 0.6 and (d) a/t = 0.8.
Conclusions
When the residual compressive stress exceeded 50 MPa, the apparent fracture toughness increased rapidly.
Under a high constraint, the apparent fracture toughness of the pipeline was more sensitive to the change of residual stress.
Non-conservative results will be obtained if the cracked pipeline in this study is evaluated by using plane strain fracture toughness.
Footnotes
Handling Editor: Chenhui Liang
Declaration of conflicting interests
The author(s) declared no potential conflicts of interest with respect to the research, authorship, and/or publication of this article.
Funding
The author(s) disclosed receipt of the following financial support for the research, authorship, and/or publication of this article: This research was funded by National Natural Science Foundation of China (grant number 51975378) and Shanghai Pujiang Program (grant number 21PJD047).