
Abstract
The surrounding rock and lining of tunnels deteriorate with increasing operation time, which causes changes in the mechanical parameters of the lining material and then affects the stability of tunnels. According to the time degradation law of the lining proposed in this paper, the mechanical parameters of lining materials corresponding to different operation years of the tunnel can be obtained. Model tests of the lining without degradation and degradation for 10, 30, and 50 years were carried out. Based on the realistic failure process analysis (RFPA2D) system, the time-dependent failure constitutive model is introduced to simulate the degradation of the surrounding rock and lining. Based on the model test and numerical analysis, the influence of degradation on the mechanics and failure features of tunnel were studied. It was found that the degradation would impact the structural stress and the stability of the surrounding rock. The failure mode of the model and the loading stress were different with the degradation time. The longer the degradation time, the more serious the deformation of the vault, and the larger the damage area of the surrounding rock. The research results play an important theoretical guiding role in analysing the progressive failure process of the surrounding rock and lining and have great value in engineering applications for reinforcing and treating tunnel defects.
The typical diseases of tunnel engineering, such as voids behind lining, 1 leakage water, 2 lining thickness lack, and lining degradation,3,4 occur at any stage during the whole operation life. The degradation of the lining is common in practical engineering.5–7 Due to external factors such as service environment, design, and construction defects, the concrete has the disadvantages of high-permeability and low-density. If there is corrosive medium in the concrete, it would lead to degradation of the lining and cause a series of tunnel diseases. 8 For example, ZHA M. T. Tunnel, 9 L. T. Base Tunnel in France, 10 Hong F. Tunnel, 11 Uresino Tunnel in Japan 12 are affected by various diseases in the operation stage.
In recent years, a lot of research on the time-varying parameters of lining materials have been done during the operation period. For example, Niu et al.13,14 analyzed the variation of concrete strength in different external environments based on statistical data. According to the test results, the time-varying influence law of chloride ion on the corrosion development is obtained by Lee et al. 15 Based on the freeze-thaw cycle test, Dong et al. 16 found that the number of freeze-thaw cycles has an effect on the relative dynamic elastic modulus and compressive strength of lining concrete. Andreotti and Lai 17 obtained the deterioration characteristics of the mountain tunnel lining by reducing the elastic modulus of the lining, and analyzed the seismic vulnerability of the lining structure. Sandrone and Labiouse, 18 Showkati et al. 19 reduced the mechanical parameters of the support structure and surrounding rock, and found that the lining deterioration reduced the safety of the operating tunnel and shortened the service life of the tunnel.
At present, there are few researches on lining degradation under the long-term rheological effect of surrounding rock, and there is lack of in-depth analysis on the derivative mechanism of tunnel diseases in rheological rock mass. In order to make up for the deficiency of existing research, and to analyze the progressive failure process of the tunnel structure, the influence law and failure characteristics of the structural stability are obtained through model tests of different degradation time. Based on the study of model test, realistic failure process analysis (RFPA) software is used for numerical calculation, and a numerical model considering the rheological effect and time factors in the failure process is established. The stress distribution, deformation, and failure mode of the structure are analyzed by using the numerical model, and the time-dependent failure characteristics of the surrounding rock and tunnel structure at different degradation time are obtained. These studies are expected to provide reference for the experimental and numerical study of deteriorating diseases.
Degradation law of lining material
The main basis for adjusting the material strength is to refer to the research of Niu and Wang. 14 In the ordinary atmosphere environment, the concrete strength of existing structures is a non stationary normal random process, since the concrete strength of buildings with long service term follows the normal distribution. 20 The mean and standard deviations of strengths, tunnel operation time can be expressed by functional relationship. 21 Based on the regression analysis method, 22 the time-degradation mathematical model of the mean strength and standard deviation of strengths is established. The secular variation law of concrete strength is the same as the variation of its mean strength and standard deviation.
In the ordinary atmosphere environment, the time-degradation mathematical model 23 of concrete average strength is shown in equation (1):

where
According to the average strength of the concrete scattered points, the secular regression curve of the average strength is shown in equation (2):

The standard deviation of concrete strength after t years is shown in equation (3):

In equation (3),
The secular regression curve of the standard deviation of concrete strength is shown in equation (4):

Referring to the research of Xu, 24 under long-term loading, the elastic modulus and strength of brittle material, such as concrete and rock, are related to time dependence. The similarity relation function is shown in equations (5) and (6):
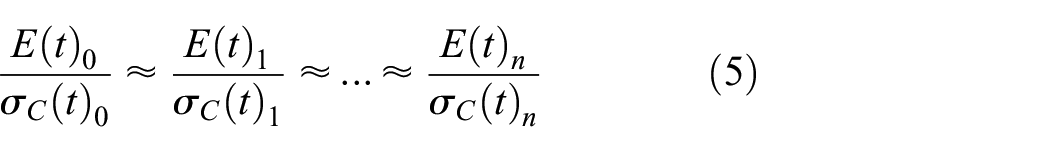

where σ0 represents the initial compressive strength, σ(t) represents the time-dependent compressive strength, E0 represents the initial elastic modulus, and E(t) represents the time-dependent elastic modulus. The relationship between the elastic modulus and strength of ordinary concrete is shown in equation (7):

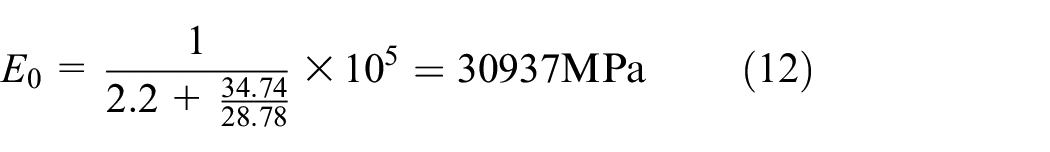
The initial elastic modulus is shown in equation (8), referring to the code for the design of concrete structures. 25

The test strength of concrete is shown in equation (9), according to the Specification for mix proportion design of ordinary concrete. 26

where fcu,0 represents the concrete strength (MPa), fcu,k represents the standard value of the compressive strength (MPa), and σ represents the standard deviation of the concrete strength (MPa), taken as 5.0.
According to Table 1, μf0 = 33.65 MPa, σ = 2.96 MPa, and they are put into equations (1), (3, and (9):


Compressive strength value of concrete specimens in the sample tunnel.

f0 = 28.78 MPa, putted it into equation (8):

Putting equations (10) and (11) into (9):


The curve of the elastic modulus with time is obtained according to equation (15), as shown in Figure 1.

Curve diagram of elasticity modulus with time.
Model test
Model test design
A tunnel in Liaoning Province has a span of 12 m and a height of 10.2 m. Based on the laboratory conditions and test requirements, the geometric similarity ratio is 1:90. 27 Model size: 800 mm × 800 mm × 100 mm, the span of the tunnel is 133 mm, the height of the tunnel is 113 mm, and the height of the sidewall is 37 mm.
To simulate the actual geological conditions, the similar material of surrounding rock 28 were river sand as the aggregate, and a mixture of cement and gypsum as the cementing material. The pure gypsum material was used for lining. The failure characteristics of the testing materials were similar to the actual geological conditions, which could be divided into three stages: elastic stage, elastoplastic stage, and brittle failure stage. After confirming the similar materials, six groups of testing sample blocks were made for the proportion test, 29 which had different cement sand ratio, and different contents of cement and gypsum. The first number in the proportion in the Table 2 represents cement sand ratio, the last two numbers represents the proportion of cement and gypsum. The testing sample blocks were 70 mm cubes, with five in each group. Based on similarity theory, the ultimate compressive strength, Poisson’s ratio, and elastic modulus were obtained through uniaxial compressive strength tests. 30 The properties of the surrounding rock are shown in Table 2.
Properties of surrounding rock.

The similar materials of lining was gypsum. 31 According to the design requirements, the compressive strength of the materials was required to be between 0.368 and 0.424. The mechanical parameters of the lining were obtained according to the proportion test. The properties of the lining are shown in Table 3.
Properties of the lining.
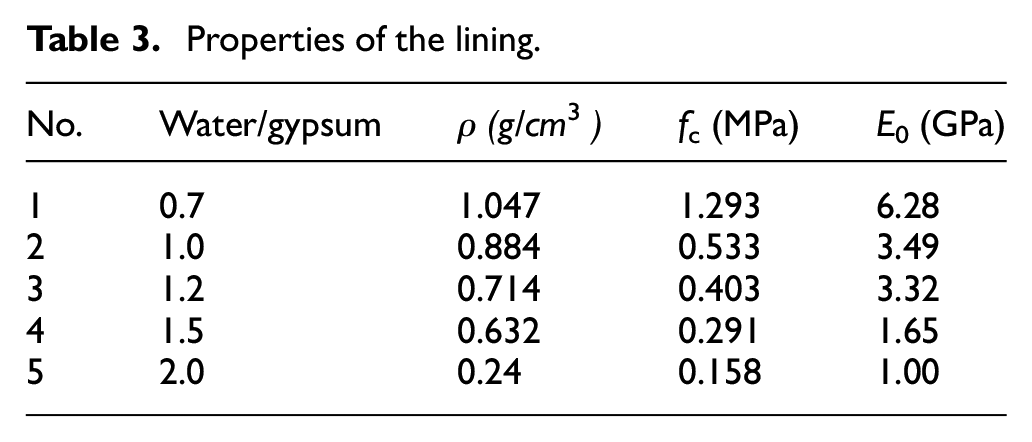
Through comparison, it is found that the proportion of 855 had the best similarity for the surrounding rock, and the water/paste ratio was 1.2 to simulate lining concrete. To study the degradation of materials in different years, the material strength of the testing model was adjusted to test different service lives. 32 The main basis for adjusting the material strength is to refer to the research of Niu 14 on the time-dependent change in concrete strength. Combining the time-dependent law of the elastic modulus of materials, the data are brought into equation (14). The time-degradation curve of the concrete materials is shown in Figure 2.

Time-degradation curve of the concrete materials.
According to Figure 2, the theoretical degradation strengths of the tunnel structure for 10, 30, and 50 years are 40.97, 35.11, and 29.97 MPa. Therefore, it was determined that a water/gypsum ratio of 1.1 was used to simulate the lining for 10 operation years, a water/gypsum ratio of 1.3 was used for the lining for 30 operation years, and a water/gypsum ratio of 1.5 was used for the lining for 50 operation years. 33
Testing and loading
According to the different operation years, four groups were made, with three models in each group. The model size is 800 mm × 800 mm × 100 mm. The water/cement ratio is 1:7, and the weight of the model is 108.8 kg, so the weight of water is 13.6 kg, the weight of sand is 84.6 kg, the weight of gypsum is 5.29 kg, and the weight of cement is 5.29vkg.
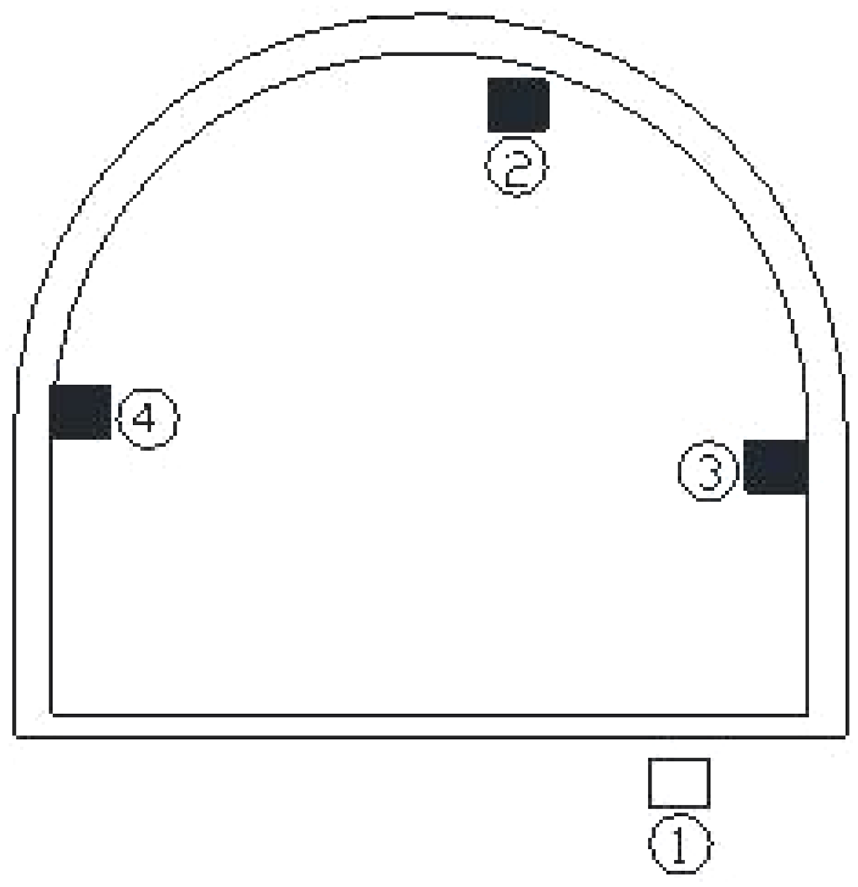
In the test, the strain was measured by an electrical method, and the main stress point was monitored by a sticking strain gauge. The strain gauge was SZ300-100AA, and the static digital strain gauge was CM-2B. 34 The main measuring points are shown in Figure 3.

Layout of testing points.
The loading was applied by the jack. The ratio of the vertical loading to the horizontal loading was 2:1. The preloading value was generally 1/10–1/5 of the failure load. The model was loaded step by step, and each loading step lasted for 4–5 min. The next level load was applied after recording. 35
Testing results
Model test of non-degradation
The failure feature is shown in Figure 4

Failure feature of non-degradation.
The failure process of the model is as follows: In the initial stage, cracks appeared in the vault and floor. With increasing loading, cracks appeared in the right spandrel, and the previous cracks continued to develop. The cracks in the left sidewall extended along the vault, and finally, the model was penetrated by the cracks, causing the model to be completed destroyed. The failure process of non-degradation is shown in Figure 5.
Failure process of non-degradation.
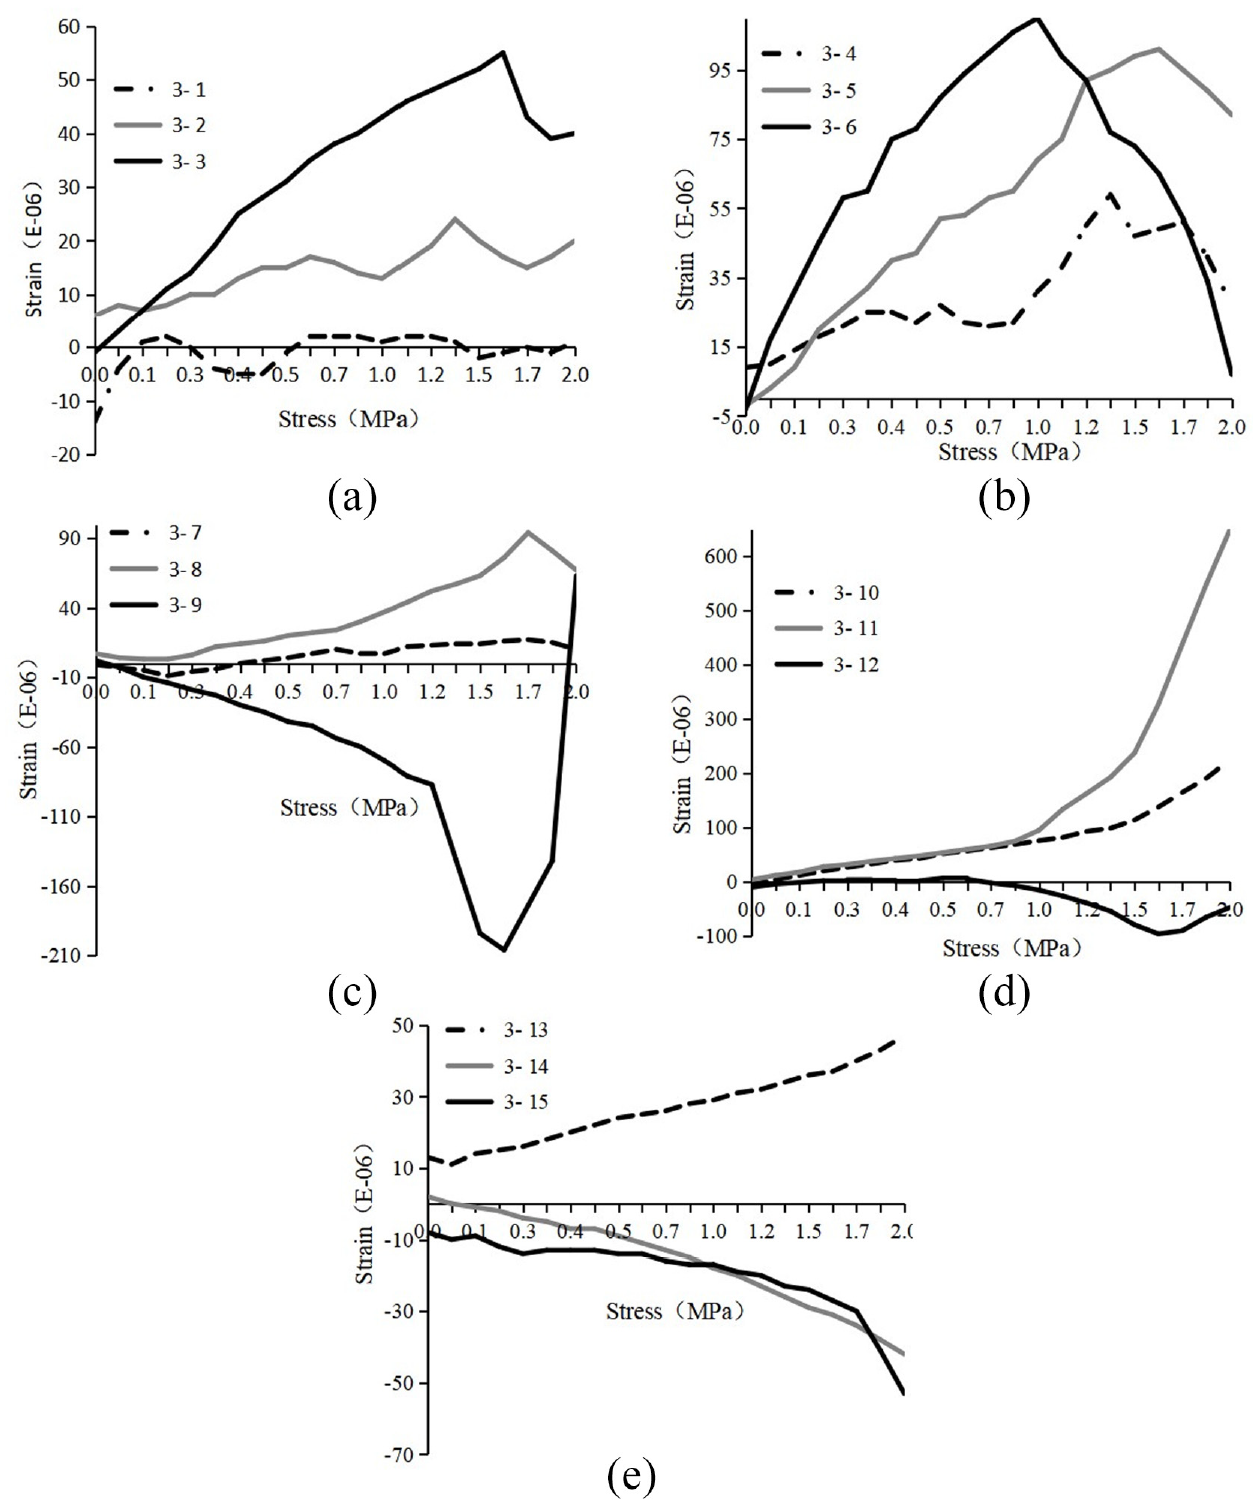
The loading stress–strain curve is shown in Figure 6, 3-1, 3-2, and 3-3 are the stress–strain curves of floor; 3-4, 3-5, and 3-6 are the stress–strain curves of arch foot; 3-7, 3-8, and 3-9 are the stress–strain curves of vault; 3-10, 3-11, and 3-12 are the stress–strain curves of spandrels; 3-13, 3-14, and 3-15 are the stress–strain curves of sidewall.

Stress-strain curves: (a) floor, (b) arch foot, (c) vault, (d) spandrel, and (e) sidewall.
Figure 6 shows that the strain at each measuring point gradually increases with increasing loading. The strain of both sidewalls changes seriously, and the change law is basically consistent with the testing results. The transverse deformation of the floor increases gradually, but the change in vertical strain is not significant, as shown in Figure 6(a). Figure 6(b) shows that the vertical deformation increases sharply and reaches a maximum value when the stress is approximately 0.6 MPa. As shown in Figure 6(c), the transverse strain of the vault changes from tension to compression, and the vertical deformation increases gradually. Figure 6(d) shows that the spandrel is tensioned vertically, and the oblique deformation of the spandrel increases slowly. As shown in Figure 6(e), the transverse deformation of the sidewall increases continuously. When the stress reaches the failure load, the transverse deformation increases sharply.
Model test of 10-year degradation
The failure feature is shown in Figure 7. The failure process of the model is as follows: In the initial stage, cracks appeared in the left spandrel, and swap block defects and cracks appeared in the middle of the floor slightly. With increasing loading, the right sidewall collapsed, and then the vault cracked. Finally, the right sidewall was damaged at the lower position, and the penetrating cracks extended from the sidewall to the bottom. The failure process of 10 years of degradation is shown in Figure 8.

Failure feature of 10-year degradation.

Failure process of 10-year degradation.
From Figure 9(a), it is found that the transverse deformation of the floor is mainly caused by horizontal tension. Figure 9(b) shows that the vertical deformation increases sharply when the stress is less than 1 MPa. When the stress is more than 1 MPa, the vertical deformation decreases, and the transverse deformation increases gradually. As shown in Figure 9(c), the vault is subjected to horizontal tension and vertical pressure, and the transverse deformation is small. Figure 9(d) shows that the spandrel is tensioned, and the oblique deformation of the spandrel increases gradually. Figure 9(e) shows that the sidewall is under the horizontal tension and vertical pressure, the deformation of the sidewall increases gradually, and the deformation of the spandrel and vault is the largest.

Stress–strain curves: (a) floor, (b) arch foot, (c) vault, (d) spandrel, and (e) sidewall.
Model test of 30-year degradation
The failure feature is shown in Figure 10. The failure process of the model is as follows: The failure feature of the model is similar to that of the 10-year degradation model. There are some differences in the failure sequence and loading stress. In the initial stage, cracks appeared in the left spandrel and did not develop continuously. When the loading stress was approximately 1.2 MPa, cracks appeared in the vault and developed upwards to the boundary with sound. With increasing loading, the right sidewall collapsed and developed to the lower position, and finally, the left spandrel cracked seriously. The failure process of the 30-year degradation model is shown in Figure 11, and the loading stress–strain curve is shown in Figure 12.

Failure feature of 30-year degradation.

Failure process of 30-year degradation.

Stress–strain curves: (a) floor, (b) arch foot, (c) vault, (d) spandrel, and (e) sidewall.
From Figure 12(a), it is found that the main deformation of the floor is transverse and the vertical deformation is small. Figure 12(b) shows that the arch foot is subjected to horizontal tension and vertical tension, and the vertical deformation is large. As shown in Figure 12(c), the vault withstands horizontal tension and vertical tension, and the failure stress is smaller than that of the 10-year degradation model. Figure 12(d) shows that the spandrel is under the action of horizontal tension and vertical pressure, the oblique deformation of the spandrel increases rapidly. Figure 12(e) shows that the sidewall is subjected to horizontal tension and vertical pressure, and the deformation increases linearly. The deformation of the spandrel and vault is the largest, as shown in Figure 12.
Model test of 50-year degradation
From Figure 13, it is found that the failure feature of the model is as follows: In the initial stage, cracks appeared in the left spandrel and developed upwards to the side boundary. With increasing load, cracks appeared in the vault and gradually extended to the top boundary. Finally, the model is damaged due to the cracks between the vertical top and the left sidewall. The failure process of the 50-year degradation model is shown in Figure 14.

Failure feature of 50-year degradation.

Failure process of 50-year degradation.
The floor is mainly subjected to horizontal tension, and the vertical deformation is very small, as shown in Figure 15(a). Figure 15(b) shows that the arch foot is tensioned, and the vertical deformation is large. Figure 15(c) shows that the vault is under the action of horizontal tension and vertical pressure, and the deformation increases rapidly when the stress is larger than 1.5 MPa. As shown in Figure 15(d), the oblique tension of the spandrel is large, and the oblique deformation increases linearly. From Figure 15(e), the spandrel is subjected to horizontal tension and vertical pressure, and the deformation is smaller than that at other positions. The stress–strain curves show that the deformation of the spandrel and vault is the largest.
Stress–strain curves: (a) floor, (b) arch foot, (c) vault, (d) spandrel, and (e) sidewall.
Above all, there is little influence on the failure modes of the model with the different degradation times, but there is a certain impact on the failure stress. The maximum loading stress of the 10-year degradation model is 2 MPa, while that of the 30- and 50-year degradation models are 85% and 75%, respectively, of the 10-year model.
Numerical analysis of the failure process of degradation
As mentioned above, the influence of degradation disease on tunnel structure is considered, but the time-dependent factor is not considered. To supplement the results of the model test and analyze the long-term stability36,37 of surrounding rock and concrete, a time-dependent failure constitutive model of brittle material is built based on the realistic failure process analysis (RFPA2D) system.38,39
Mesoscale time-dependent model
The strength of geotechnical materials decreases with the loading time, and the strength at t − ∞, which is called the long-term strength of materials σ∞. When studying the long-term stability of projects, the long-term strength should be taken as the research index. In the RPFA2D-Creep version, the influence of time on material strength is considered, and the long-term strength evolution equation is introduced, 40

where σti is the time-dependent strength at time ti, σ∞ is the long-term failure strength at time t approaching infinity, σ0,i is the initial short-term failure strength of each element, and a1 is the coefficient of strength degradation of the element.
If we let σ∞/σ0,i = k, defined as the ratio of the long-term failure strength to the short-term failure strength, equation (16) can be rewritten as,

In the RFPA2D model, it is assumed that the changing law of the elastic modulus is similar to that of the strength, and the parameters decrease with time. In the process of simulation, by introducing a time-dependent degradation of material properties into the model, the failure feature with time can be obtained 41 based on the elastic failure constitutive relation. As time goes on, the material degradation would cause the model to be damaged. The relationship between the long-term strength and transient strength of elements is shown in Figure 16.

Schematic of the strength degradation law of an element.
Numerical simulations
The size of the numerical model is 70 m × 70 m and discretised into 700 × 700 elements. The width of the tunnel is 12 m, the height is 10.2 m, the thickness of the lining is 0.8 m, and the height of the sidewall is 4.2 m. The model is loaded by the confining pressure, with 6.4 MPa constant load in the transverse direction and 4 MPa constant load in the vertical direction, as shown in Figure 17. The ratio of the long-term failure strength to the short-term failure strength was set to 0.8, the coefficient of degradation of each element was chosen to be 0.01 s−1, and the time step was 1 year. 42 The material properties of the surrounding rock and lining used for this model are shown in Table 4.
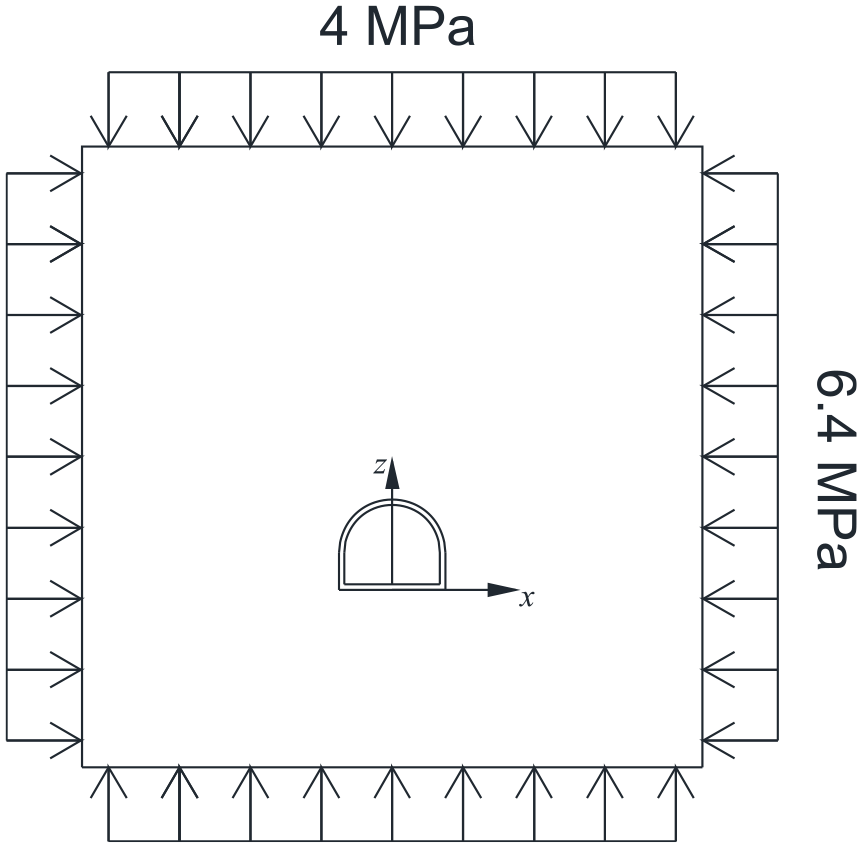
Numerical model of tunnel.
Parameters of numerical model.

The two numerical schemes are analysed. In the first scheme, the degradation of the surrounding rock and lining in a time-dependent manner is considered. In the second scheme, only the degradation of the surrounding rock in a time-dependent manner is considered.
Results
To study the influence of tunnel lining degradation on structural stability, two schemes are carried out. Scheme 1 shows that the time-dependent degradation of the surrounding rock and lining is considered. In contrast, the degradation of the lining is not considered in Scheme 2 but the time-dependent degradation of the surrounding rock is considered.
Acoustic emission (hereinafter referred to as “AE”) histograms at different times are shown in Figure 18, and the change rule of AE counts at different operating times is obtained. There are a large number of AE counts in the 3rd, 12th, and 30th years in Figure 18(a), and there are a large number of AE counts in the 3rd and 56th years in Figure 18(b). According to the comparative analysis, the stability of the surrounding rock is worse and the damage is more serious in Scheme 1.
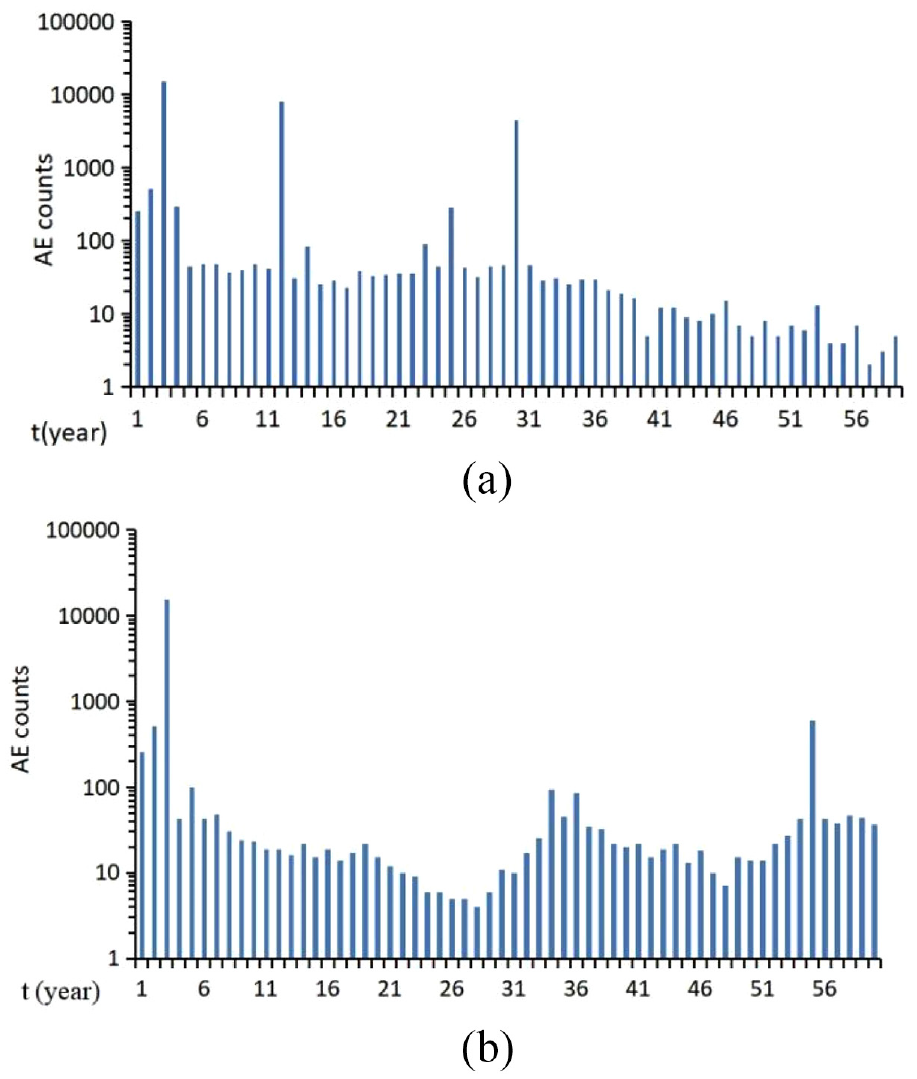
AE histograms of different-time: (a) Scheme 1 and (b) Scheme 2.
The displacement-Y curve at different times is shown in Figure 19. Displacement-Y increases suddenly in the 3rd, 6th, 36th, and 51st years, as shown in Figure 19(a), indicating that the stability of the tunnel has changed. As shown in Figure 19(b), abrupt changes in Displacement-Y are found in the 3rd, 31st, and 56th years. The phenomenon of the displacement springback occurs after the displacement mutation, which is caused by the lining constraining the surrounding rock deformation. After the 61st year, the change in displacement is relatively stable. According to the comparative analysis, without considering the time-dependent degradation of the lining, Displacement-Y is obviously smaller. Considering the time-dependent degradation of the lining, Displacement-Y increases continuously, which indicates that the deformation of the surrounding rock is significantly affected by the degradation of the lining.

Displacement-Y curve of different-time: (a) Scheme 1 and (b) Scheme 2.
The distributions of the stress, elastic modulus, and AE are shown in Figure 20. In the initial stage, the stress of the foot and vault is large. The floor, vault, and right sidewall of the model are damaged in Figure 20(a). In the third year, a great deal of damage occurs on the floor, and cracks appear from the feet of both sides to the middle position of the floor, causing a triangular failure area. In the 12th year, cracks appear on the left vault and extend upwards at an angle of 30°. After 56th year, the deformation becomes stable. Compared with the maximum principal stress and elastic modulus, the maximum principal stress decreases obviously in the area where the elastic modulus is smaller.

Stress, elastic modulus, and AE of different-time: (a) Scheme 1 and (b) Scheme 2.
The failure mode of Scheme 2 is similar to that of Scheme 1; a triangular failure area is formed from the foot to the middle of the floor, and oblique cracks are produced on the left vault. The difference is that the oblique cracks on the left vault start from the 21st year and expand more slowly than Scheme 1. The time-dependent degradation of the lining reduces the stability of the tunnel structure, expands the damage area of the surrounding rock, and has a great influence on the deformation of the arch roof.
By comparing the results of the numerical calculation and model test, it can be found that the area of the maximum displacement and stress in the numerical simulation is damaged in the model test. The surrounding rock is deformed and broken, and the lining is tension failure or compression failure. The variation in deformation is basically the same as that of the stress–strain curve.
Considering the time factor, the influence of time-dependent degradation disease on the damage process of the surrounding rock and lining is analysed. Based on the stress distribution, deformation and failure mode, the time-dependent failure features of tunnels are revealed. From the view of micromechanics, the study could provide a theoretical reference for the progressive failure process of surrounding rock and lining structure under loading. The research results would have great value in engineering applications for reinforcing and treating tunnel diseases.
Conclusions
The tunnel stability is affected by the degradation of the lining, which would worsen the structure stress, gradually lead to the instability of the surrounding rock, and finally lead to tunnel destruction. The degradation time is different, and the failure mode is different.
According to similarity theory, the material and size of the model test are derived. The failure mode and sequence of tunnels with different degradation times are obtained by model tests. There is little influence on the failure mode of the model with different degradation times, but there is a certain influence on the value of the failure loading stress. With increasing degradation time, the service life of the tunnel structure will decrease.
Based on the realistic failure process analysis (RFPA2D) system, a mesoscale time-dependent degradation model is established, considering the time effect of the failure process of the surrounding rock and lining. The model reproduces the progressive failure process of the tunnel model and supplements the results of the model test. Numerical simulations demonstrated that the time-dependent degradation of the surrounding rock and lining was a gradual process, which would seriously affect the operation and long-term stability of the tunnel. The degradation of the lining would not only increase the deformation of the vault and affect the stability of the tunnel structure but also expand the time-dependent damage area of the surrounding rock.
Footnotes
Acknowledgements
The authors would like to thank Northeastern University for providing access to the software and other facilities.
Handling Editor: Chenhui Liang
Author contributions
In this study, the concepts and designs were provided by Yu Liu. In situ data were obtained by Xiao-Quan Shao, and data were analyzed by Yu Liu and Yong-Ping Guan.
Declaration of conflicting interests
The author(s) declared no potential conflicts of interest with respect to the research, authorship, and/or publication of this article.
Funding
The author(s) disclosed receipt of the following financial support for the research, authorship, and/or publication of this article: This research was funded by National Natural Science Foundation of China, Grant Numbers 51474050, 52078306, and U1602232.
Data availability statement
The data supporting reported results by the authors can be sent by e-mail.