
Abstract
At present, with the rapid growth of manufacturing and big data, reliability technology has gradually become a topical issue in the industrial field. Aiming at the operation reliability assessment of rolling bearings, this paper proposes a bearings operational reliability assessment using an ensemble deep autoencoder based on asymmetric structure. In this method, an ensemble deep autoencoder is used to adaptively learn degradation features from condition monitoring data, where the ensemble deep autoencoder adopts an asymmetric structure with different activation functions in the encoder and decoder. Then, the learned features are classified by correlation analysis, and the typical features in each category are selected. Finally, the operation reliability of rolling bearings is evaluated through the definition of reliability based on Mahalanobis distance. Through the example evaluation of rolling bearing operation reliability and comparison with other feature extraction methods, it can be concluded that this method has stronger feature extraction ability and can effectively show the trend of bearing degradation.
Keywords
Introduction
The reliability assessment technology can excavate and determine the potential hidden dangers and weak links of the equipment, and guarantee the security and reliable operation of equipment. Therefore, reliability assessment technology has become a topical issue in equipment maintenance. The reliability assessment technology has undergone nearly a century of development and innovation, many reliability evaluation methods1–4 have been derived so far. In general, the reliability assessment methods can be divided into three categories: the mathematical statistics method, 5 the failure model method, 6 and the artificial intelligence method. 7
In the early stage of reliability evaluation technology development, reliability evaluation technology mainly relies on mathematical statistics. But with the sustainable development of science and technology, mechanical systems are getting more and more complex, the reliable test data of complex systems are difficult to obtain, so the traditional mathematical statistics method relying on large sample test data are difficult to apply, and the failure model method came into being. In the failure model method, the establishment of the failure model requires a lot of mechanical knowledge and expert experience, and it is difficult to build complex equipment. In this case, researchers proposed the accelerated life test or highly accelerated life test to obtain more reliable information at a valid time. 8 With the application of degradation data to reliability assessment, and the advantages of the wide source of degradation data and a large amount of data, many scholars have begun to apply the degradation data to reliability assessment. 9 Liu and Fan 10 designed a multistage model with variability according to the features of different degradation stages of rolling bearings and combined with the features of multistage and multivariability of bearing degradation, which effectively predicted the RUL of rolling bearings. Jiang et al. 11 combined the interval estimation method of the degradation model based on the inverse Gaussian process to obtain the generalized confidence intervals of other models by applying the generalized pivot quantity procedure, thus successfully evaluating the reliability of products.
With the further development of reliability technology, artificial intelligence methods have gradually developed in terms of reliability, and machine learning methods in reliability assessment attracted the attention of the general public. Elasha et al. 12 proposed a machine learning technique that combines regression models and multi-layer artificial neural network models, the method takes vibration measurements as input and uses predictive algorithms to diagnose the fault types and predict the remaining useful life (RUL) of turbine gearboxes. Madeira et al. 13 used multiple types of machine learning methods to predict the RUL of the mechanical system in order to find the best prediction model. This study evaluated various regression methods and classification methods and achieved good prediction results. In addition, deep learning (DL) is also an important part of artificial intelligence methods. DL is good at exploring complex relationships in multidimensional data. In DL, Stacked Autoencoders (SAE) can adaptively learn features from original data without outputting features. Miao et al. 14 designed an adaptive feature input selection method for RUL of bearing elements. This method relies on an adaptive evolutionary neural network (ACNN), which can remove invalid features for input features. Alrifaey et al. 15 proposed a new deep learning framework based on the recurrent neural networks (RNN) and long short term memory (LSTM), this framework centers on a series of features of historical data which are unlabeled to diagnose the fault of generators in power generation systems. The experimental results display that the framework can effectively detect the generator vibration fault signal and has good diagnostic accuracy. Liu et al. 16 proposed a fuel cell RUL prediction technique based on the sparse Autoencoders (AE) and deep neural network (DNN). The former is applied to automatically extract features, and the latter is used to achieve result prediction. The experimental outcome demonstrates that the RUL prediction of the new method is accurate.
The above methods based on single deep learning model has some problems, such as difficult parameter adjustment, large prediction deviation, and poor generalization ability. To solve these problems, ensemble learning has been widely used. Ensemble learning completes the learning task by constructing and merging multiple weak learners and constructs a strong learner with better performance than a single learner. Compared with the traditional methods, the advantage of ensemble learning is that it ensures the diversity of weak learners, which makes the results obtained often better than those of a single learner. Moreover, the generalized error can be reduced and the model performance can be improved. At present, the ensemble learning method has expanded its scope to various fields, including medical treatment, 17 manufacturing, 18 traffic, 19 and so on. In the field of reliability, ensemble learning is also widely used. Zeng and Cheng 20 proposed an ensemble learning method to predict RUL. SAE, LSTM, and convolutional neural network (CNN) are combined to predict the RUL of aircraft engines in this method, and the weight required for each algorithm is allocated according to the Euclidean distance. The results show that this RUL prediction algorithm has high efficiency. Kong et al. 21 carried out feature learning on vibration signals by establishing multiple SAEs with different network structures and extracted the featured ensemble through the K-means clustering algorithm and correlation analysis, completing the bearing operation reliability evaluation based on the reliability definition of state feature distance. Lin and Tao 22 presented a novel bearing health indicator construction method. This method uses the ensemble SAE to collect features from the Fast Fourier Transformation (FFT) results of the original signal and maps the multi-dimensional learning indicators to the one-dimensional healthy indicator through the trained nonlinear transformation neural network. The results reveal that this method of health indicators can be constructed effectively without processing the original data.
In general, the above works based on ensemble learning mainly uses the AE based on symmetric structure as the base model, namely the activation function types of encoding and decoding processes should be the same. However, if different kinds of activation functions are allocated to the encoding and decoding process of AE to combine the inherent attributes of different activation functions, the performance of asymmetric AE with different encoding and decoding activation functions will be better. Because different activation functions apply to the distribution of different input data, the combination of multiple activation functions can better adjust the weight and deviation, to capture the features that are difficult to be reflected in the original input and avoid the contingency to a certain extent. Based on the above, an ensemble deep AEs based on asymmetric structure for operational reliability assessment of bearings is proposed. Firstly, the parallel feature extraction model is constructed by AE of the difference between the front and back activation functions. Secondly, the feature selection model based on correlation analysis is used, and then the operation reliability is defined based on Mahalanobis distance. Finally, the experimental verification is conducted through the rolling bearing data set. The experimental results indicate that this paper can better extract features from the vibration signals of rolling bearings, and performs well in the operation reliability evaluation of similar objects. The novelty and merits of the proposed method are summarized as follows:
The proposed asymmetric SAE structure can be applied to the input data with different distribution via the combination of different activation functions, thus improving the feature extraction ability of the SAE structure.
The ensemble strategy with multiple asymmetric structures can enrich the degradation feature space, thus avoiding the insufficient performance of a single learner due to inappropriate hyperparameters.
The framework of this study is presented as follows. Section “Basic theory” introduces the basic theory of SAE. Then, Section “The proposed method” introduces the running reliability evaluation method of rolling bearing based on parallel learning and SAE. Section “Result and discussion” verified the proposed method with rolling bearing data. Finally, some conclusions are inferred in Section “Conclusion.”
Basic theory
The basic structure of SAE is an AE, which is trained to copy its input to its output.
20
The AE includes the encoder and the decoder. In the encoder network, the condition monitoring signal x = [x1, x2, …, xm] is transformed into the low-dimensional hidden feature

where fθ is the activation function,

where the activation function gθ is the same as the encoder network.
The AE training aims to optimize the parameter set {


where JMSE is defined by the mean squared error (MSE) between the original input

The architecture of AE. 23
In SAE, multiple AEs are stacked to form a DNN, and the hidden features of the previous AE can be used as the input for the next AE. By stacking the input layer and the hidden layer of multiple AE, SAE can be further extracted highly abstract degradation features layer by layer,24,25 as shown in Figure 2. Therefore, high-level degradation features can be extracted in an unsupervised manner by SAE.

The architecture of SAE. 23
The proposed method
Feature ensemble based on parallel learning
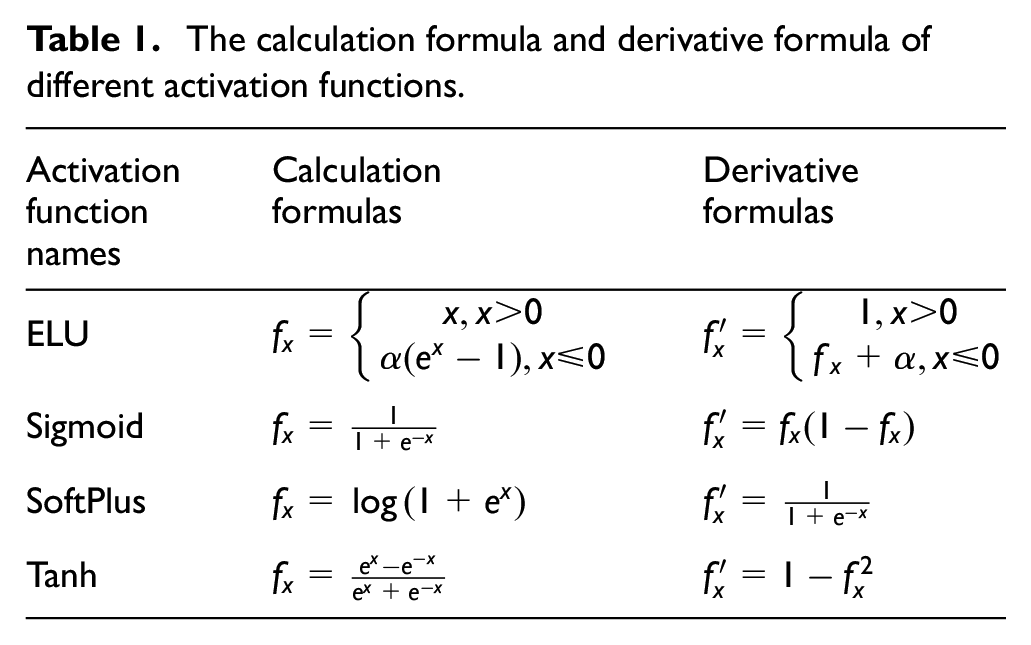
Generally, the degraded information learned by a SAE with the same activation function is limited. To make the extracted features diverse, different combinations of the activation functions are assigned to SAE. In this paper, four commonly used activation functions covering different features, namely Sigmoid, Tanh, SoftPlus, and Exponential Linear Unit (ELU), are selected to construct eight different SAEs, which help extract complementary and comprehensive features. Figure 3 listed the waveforms of the four selected activation functions. In Figure 3, Figure 3(a) represents the activation function ELU, Figure 3(b) represents the activation function Sigmoid, Figure 3(c) represents the activation function SoftPlus, Figure 3(d) represents the activation function Tanh. Table 1 lists the calculation formula and derivative formula of different activation functions.

Waveforms of four activation functions: (a) ELU, (b) Sigmoid, (c) SoftPlus, and (d) Tanh.
The calculation formula and derivative formula of different activation functions.
In this paper, the first combination mode is to assign different activation functions to the encoder and the decoder of each AE in SAE. The second combination mode is to assign the same activation functions to the encoder and decoder of each AE, but the previous AE and the latter AE have different activation functions. This asymmetric model structure is shown in Figure 4. Besides, except for the reconstruction error, to prevent overfitting, the loss function of each asymmetric SAE introduces the L2 regularization term. The loss function is shown in the following formula:


The structure of the proposed asymmetric model.
where λ is the tradeoff item, L is the number of network layers, and ωij is the weight of the ith neuron in layer L and the jth neuron in layer L + 1.
Next, the degradation features extracted by different asymmetric SAE can form the feature set. In addition, redundant features in the feature set should be removed to improve the performance of the reliability evaluation. In this paper, the Pearson correlation analysis is used to analyze the correlation of all features. In the Pearson correlation analysis, the Pearson correlation coefficient can measure the correlation degree of different features, and its formula is as follows:
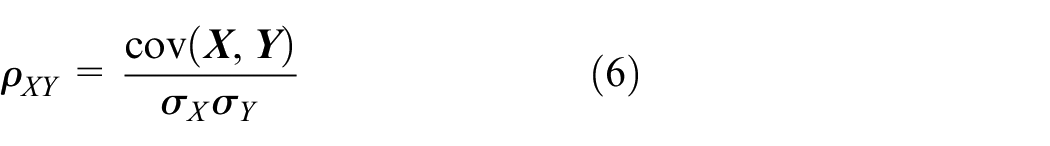
where

where

Flow chart of feature clustering method based on correlation analysis.
The pseudo-code of removing irrelevant and redundant features.

Reliability evaluation based on Mahalanobis distance
In this paper, the ratio of the deviation between the current state and the failure state to the deviation between the healthy state and the failure state is defined as the operational reliability, which is shown in Figure 6. To effectively evaluate the operation reliability, the Mahalanobis distance is used to measure the state deviation as follows:


Schematic diagram of operation reliability.
where μ represents the mean feature of the health state set,
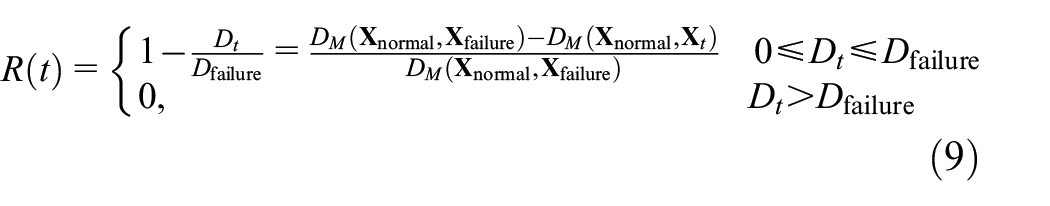
where R(t) represents the operation reliability,
General procedure of the proposed method
A reliability evaluation method of rolling bearing based on feature clustering of correlation analysis and Mahalanobis distance reliability definition is proposed in this paper. The framework of the method is shown in Figure 7.

Flow chart of rolling bearing operation reliability evaluation method based on feature parallel learning and selection.
The summary of the main procedures is as follows:
Step 1: Collect the vibration signal of the rolling bearing and divide the training dataset and test dataset.
Step 2:The original time-domain signal is transformed into a frequency-domain signal through FFT, and as the input of eight feature parallel learning models, extract the degraded features in the signal and form the original feature set.
Step 3:Through the correlation analysis of features, cluster the different features in the original feature set, and screen the typical features in each class to form an integrated feature set.
Step 4: Build the rolling bearing operation reliability evaluation model through the reliability of Mahalanobis distance.
Step 5: Apply the model to the operation reliability evaluation of the rolling bearing.
Result and discussion
Experimental setup
In this paper, the bearing dataset published by the FEMTO-ST institute is used to verify the validity of the rolling bearing operation reliability evaluation method based on parallel learning and SAE. The dataset was collected on the accelerated aging PRONOSTIA 26 platform as shown in Figure 8. To monitor the vibration of the bearing, two accelerometers were mounted vertically and horizontally on it. The vibration signal is sampled by two accelerometers every 10 s, the sampling duration and sampling frequency are 0.1 s and 25.6 kHz respectively. In this experiment, the operating condition is 1800 rpm and 4000 N. At the same time, the diameter of the bearing ball used in the experiment is 3.5 mm, the diameter of the inner ring is 22.1 mm, the diameter of the outer ring is 29.1 mm, and the number of balls is 13. In this paper, the lateral accelerations of seven bearings under the above condition are recorded as B1_1 to B1_7.

The PRONOSTIA platform.
Ensemble asymmetric SAE for feature engineering
In this experiment, the first bearing data (B1_1) is considered a training dataset for model training. Figure 9 shows the full life cycle vibration signal of B1_1, when t < 10,000 s, the vibration signal operates smoothly except for a few moments of fluctuation. When 10,000 s < t < 12,000 s. The vibration signal is slightly increased.When t > 12,000 s the vibration acceleration amplitude of the bearing began to rise significantly. The rising trend was slow first and then fast, and the performance gradually degraded until failure. The other bearings (B1_2 to B1_7) are used as testing datasets to verify model performance. In bearing B1, the first 40 data are assumed to be health status data. When the acceleration amplitude of the vibration signal is greater than 20g, the bearing enters a fault state. In this experimental case, the original vibration signal is transformed by FFT. The time-domain and frequency-domain signals of bearing B1_1 in the health state and the failure state is shown in Figure 10.
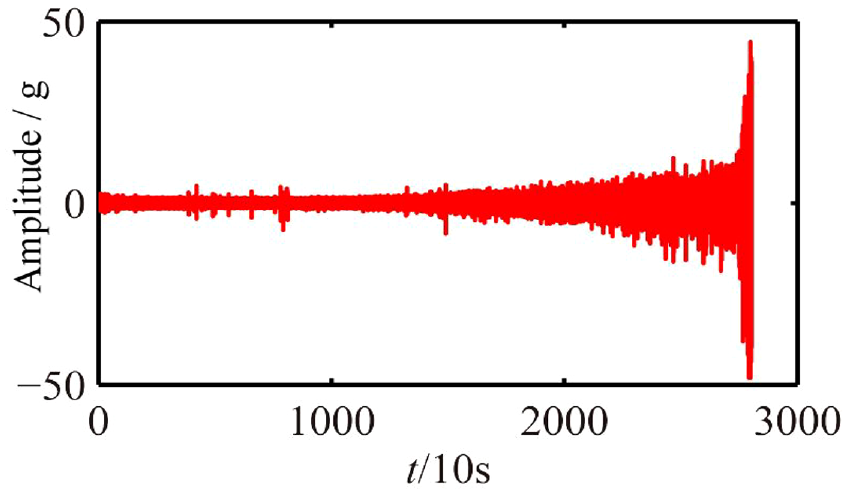
Vibration signal of B1_1.

The time-domain and frequency-domain signal in the health state and the failure state of B1_1: (a) health state time domain signal, (b) failure state time domain signal, (c) health state frequency domain signal, and (d) failure state frequency domain signal.
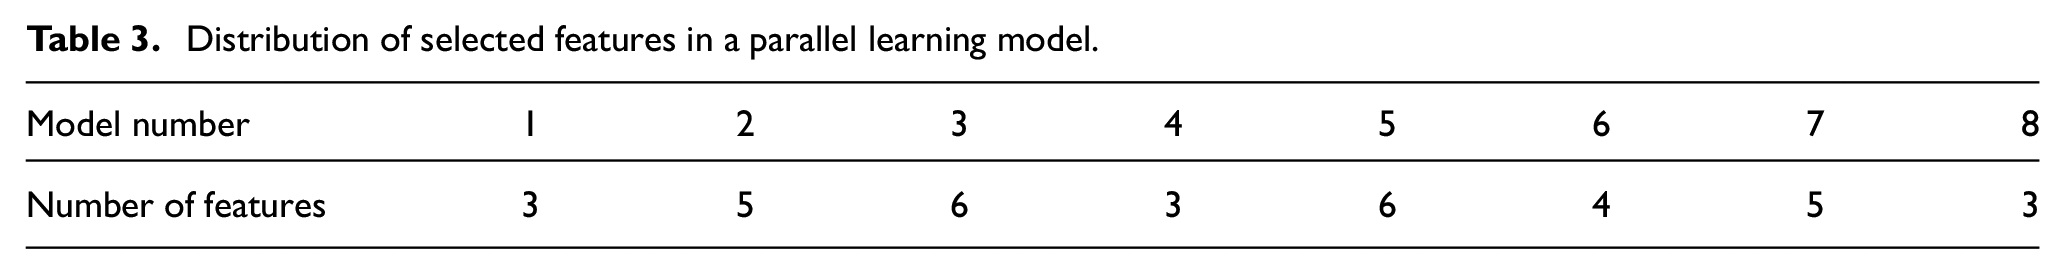
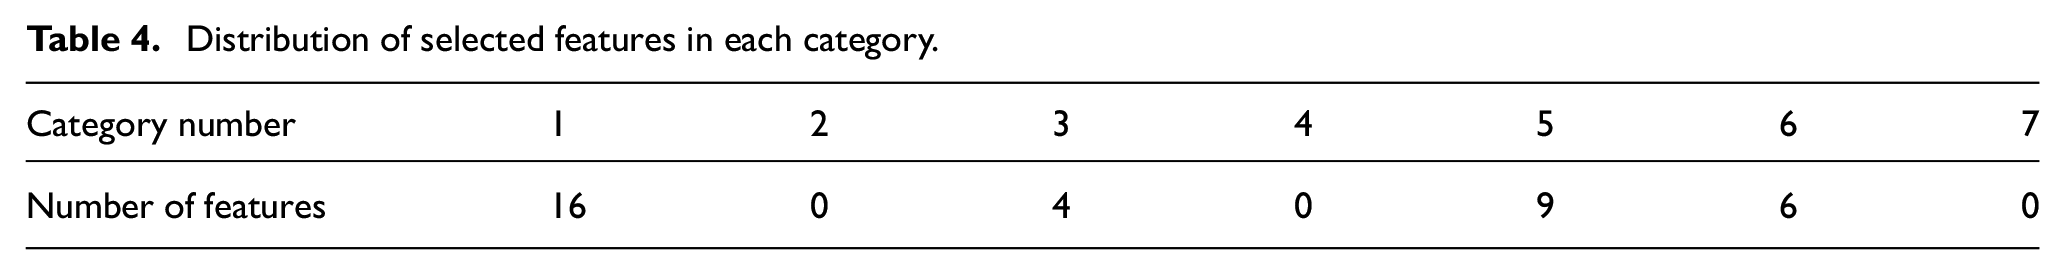
All SAE model network structures in this paper are 1280-450-200-50. The learning rate is 0.05, and the maximum iterations are 200. This setting finally forms a 400-dimensional original feature set. After that, the K value in the feature selection model based on correlation clustering is set to seven categories. Table 3 shows the number of features in each parallel learning model and Table 4 shows the number of selected features in each category. Table 3 shows the number of features are derived from various parallel models, it can be concluded that the proposed method can efficiently select the features related to bearing degradation from each model. In addition, the number of selected features in categories 2, 4, and 7 is 0 can be seen in Table 4, it can be concluded that the feature selection based on correlation analysis in this paper can cluster similar features together, and directly exclude the feature categories that are not related to bearing degradation.
Distribution of selected features in a parallel learning model.
Distribution of selected features in each category.
Reliability evaluation
After feature selection, the Mahalanobis distance is utilized to evaluate the bearing reliability, Figure 11 shows the outcomes. As can be viewed from Figure 11(a), when t < 10,000 s, except for the fluctuation in a few moments, the bearing B1_1 runs smoothly. When 10,000 s < t < 15,000 s, the vibration acceleration amplitude of the bearing begins to increase slowly, and the change is not obvious. When 15,000 s < t < 27,000 s, the amplitude increases obviously, and the growth speed is accelerated. When t > 27,000 s, the amplitude rises rapidly until it fails. Figure 11(b) shows the variation of bearing B1_1 operation reliability with time. When t < 10,000 s, the bearing operation reliability is in the best state. When 10,000 s < t < 15,000 s, the reliability of bearing B1_1 changes slightly, showing a slight degradation trend. When 15,000 s < t < 27,000 s, the reliability of bearing B1_1 begins to have an obvious degradation trend, and the degradation speed is slow first and then fast. When t > 27,000 s, the reliability decreases rapidly, enters the failure state, and the reliability will be 0. By comparing the life cycle vibration signal and reliability curve of bearing B1_1, the changing trend of the two is similar. The proposed method can effectively show the state and degradation trend of the bearing.

The life cycle vibration signal of bearing B1_1 and its corresponding reliability curve: (a) vibration signal of training dataset B1_1 and (b) operation reliability curve of training dataset B1_1.
The reliability of other bearings is evaluated by using the evaluation model trained by the bearings B1_1, the evaluation results are illustrated in Figure 12. Figure 12 indicates that the proposed method can effectively evaluate the reliability of the bearing and well show the performance change trend of each test bearing. It can be concluded from the results that the method proposed in this paper can availably evaluate the operation reliability of rolling bearing.
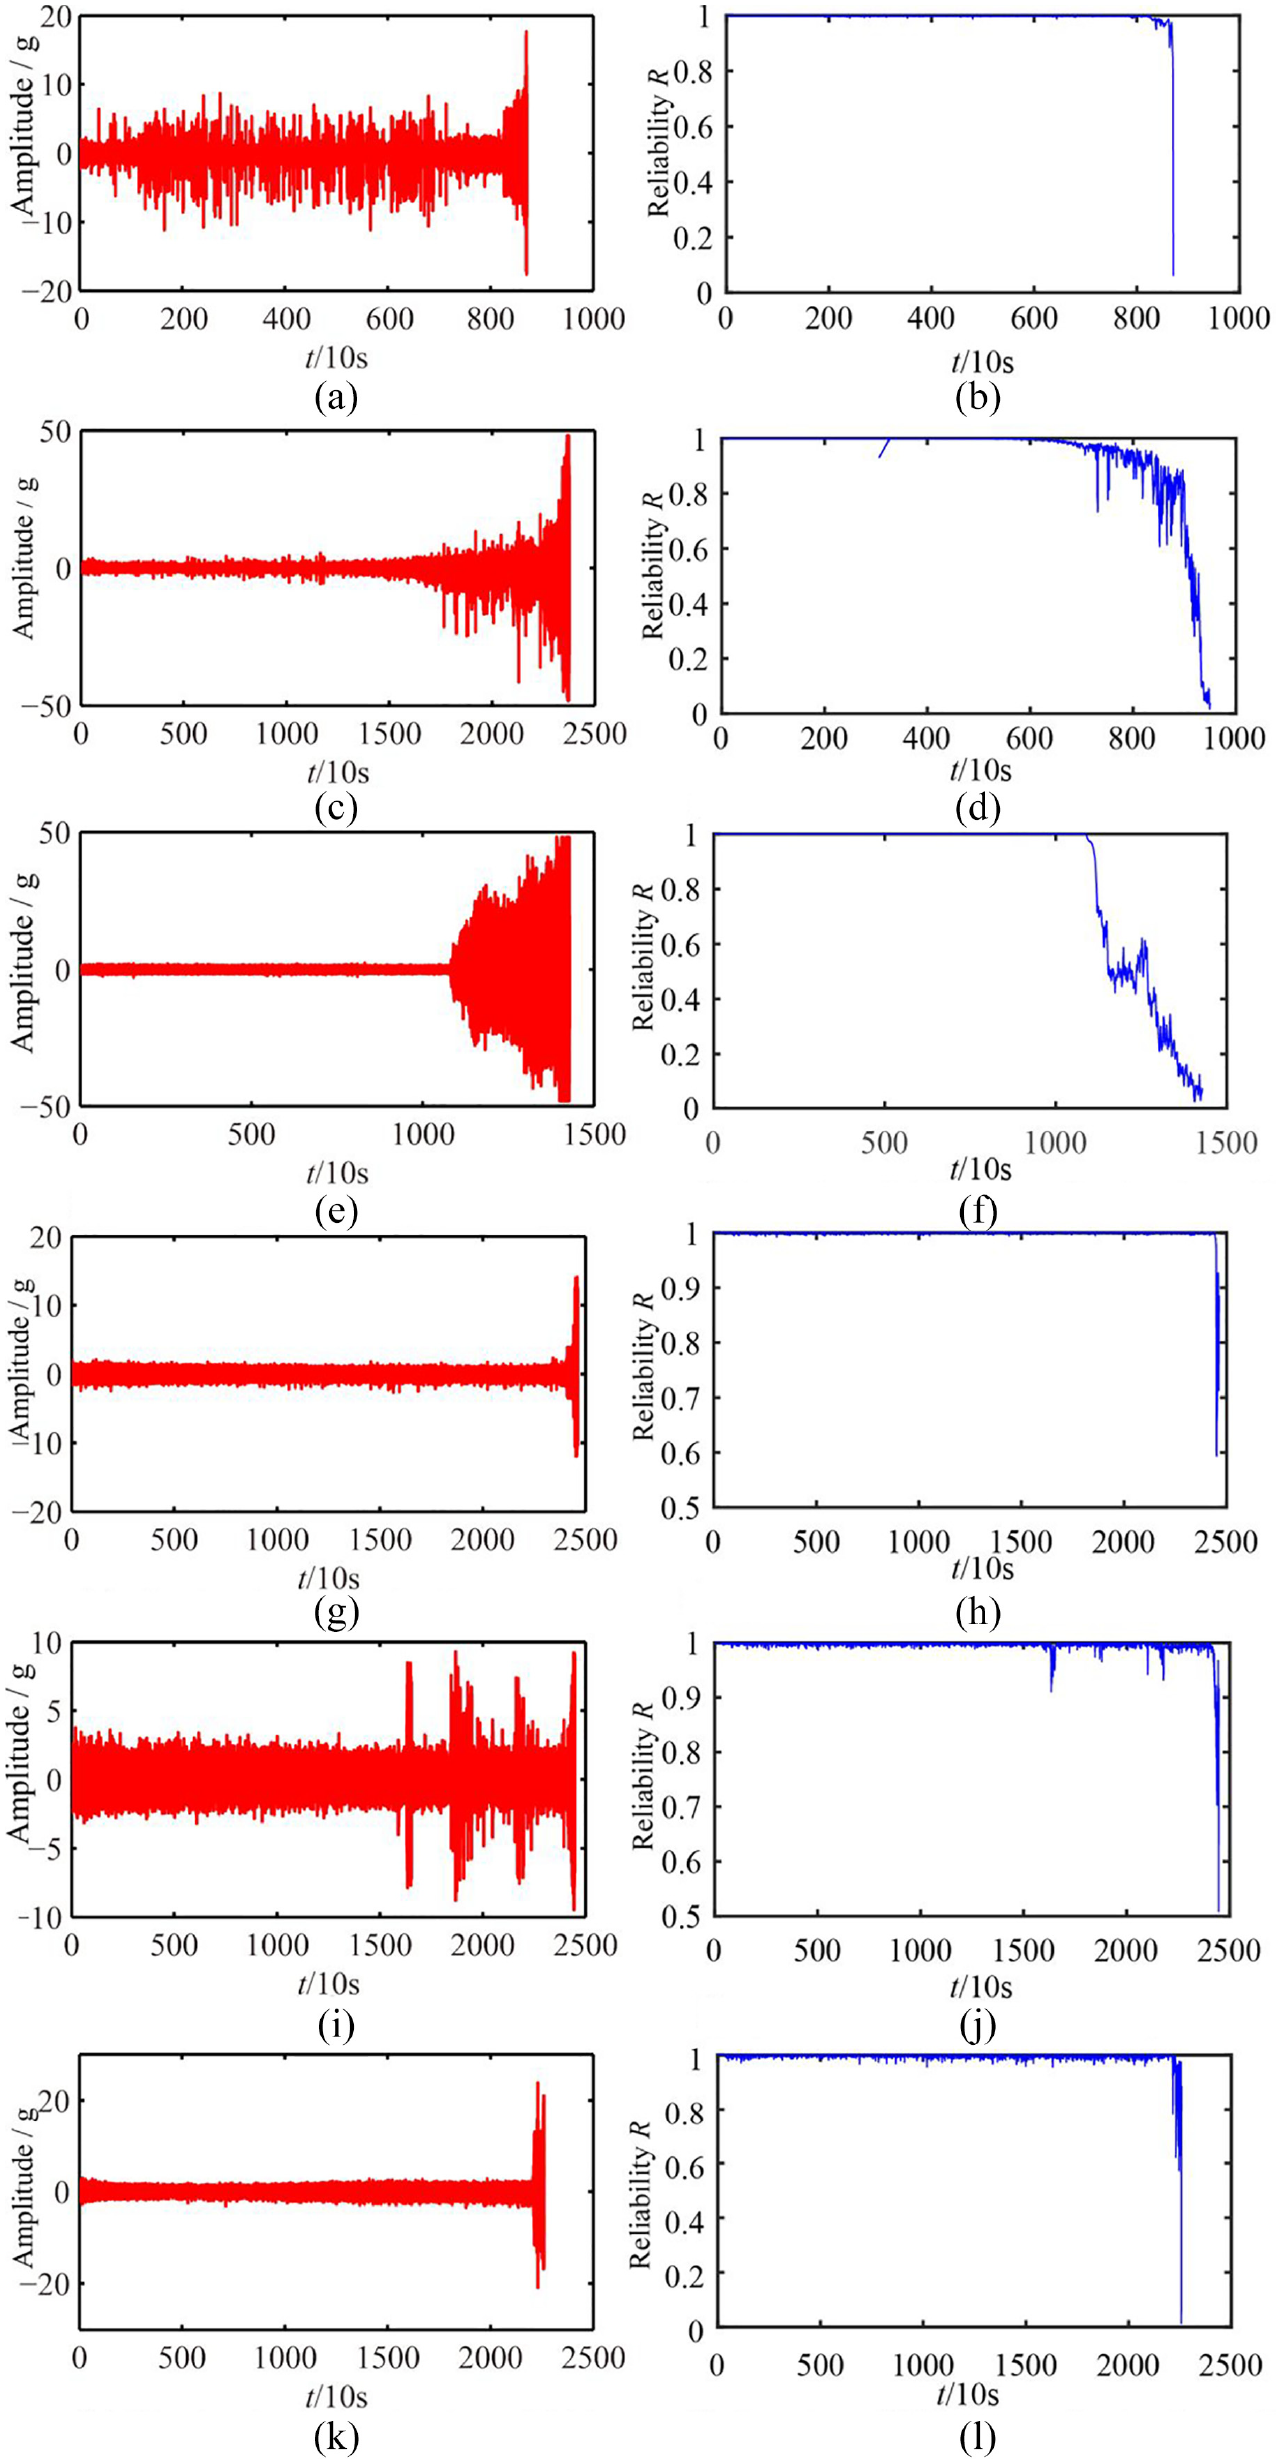
The life cycle vibration signal of the testing bearing and its corresponding reliability curve: (a) vibration signal of testing dataset B1_2, (b) operation reliability curve of testing dataset B1_2, (c) vibration signal of testing dataset B1_3, (d) operation reliability curve of testing dataset B1_3, (e) vibration signal of testing dataset B1_4, (f) operation reliability curve of testing dataset B1_4, (g) vibration signal of testing dataset B1_5, (h) operation reliability curve of testing dataset B1_5, (i) vibration signal of testing dataset B1_6, and (j) operation reliability curve of testing dataset B1_6.
Comparisons
The Cri index is introduced to further show the availability and superiority of the proposed method. The Cri index is shown in the following formula:

where Corr represents a correlation index indicating the correlation between features and running time, and Mon is a monotonicity index indicating the trend of feature change. The correlation index is the correlation between the running time and the feature, which is as follows:
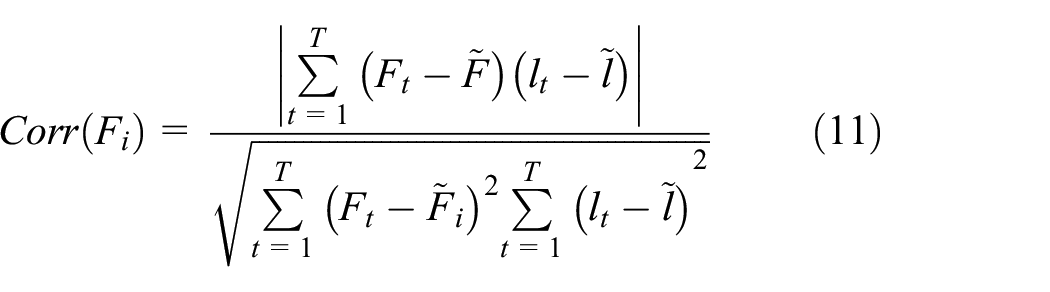
where lt and Ft represents the time point and the feature value at time t, respectively.

where dFi represents the differential of the feature sequence and T represents the length of the samples.
Comparison with asymmetrical structures
To demonstrate the advantage of the proposed method, ensemble AEs based on asymmetric structure are introduced for comparison. Figure 13 shows the degradation features with the highest Cri value and the lowest Cri value extracted by model 1 from B1_1. It can be viewed that the degradation features 14 with high Cri value have an obvious monotonic trend with time. In the degradation feature 50 with a low Cri value, most values of this feature are stable at a certain level and decrease suddenly in the end. Therefore, it is indispensable to choose the degradation features which is significantly helpful for reliability evaluation from the feature set.

Schematic diagram of feature value change with time under the different features of model 1: (a) feature 14 and (b) feature 50.
For the training dataset, Figure 14 shows the average Cri index of each feature parallel learning model and the feature selection model proposed in this paper. Among them, model 9 is the model proposed in this paper, model numbers 1–8 are the eight asymmetric SAE models in this paper. Figure 14 illustrates that this feature selection method can effectively select the high-level degradation features with a high correlation with bearing performance degradation, and obtain the highest average Cri value than the single model on the training dataset. Figure 15 shows the average Cri index on the testing dataset, model 9 also shows better performance. Table 5 lists the average Cri index of each model, the method in this paper has a higher Cri index than the single model. Therefore, the performance of the proposed model is remarkably higher than that of a single model, and the extracted features can meet the requirements of reliability evaluation.
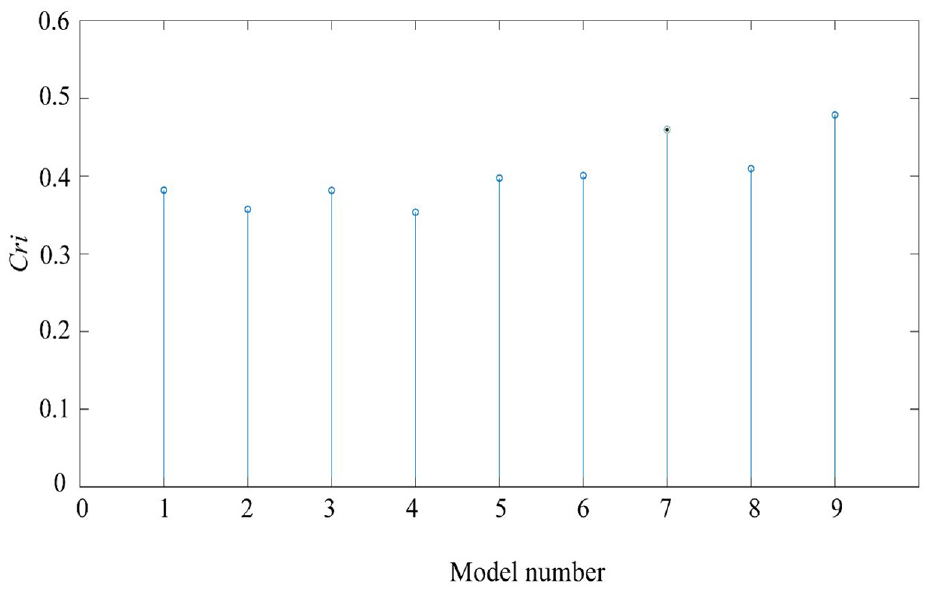
The comparison result of the Cri index of the features extracted from each model in bearing B1_1.
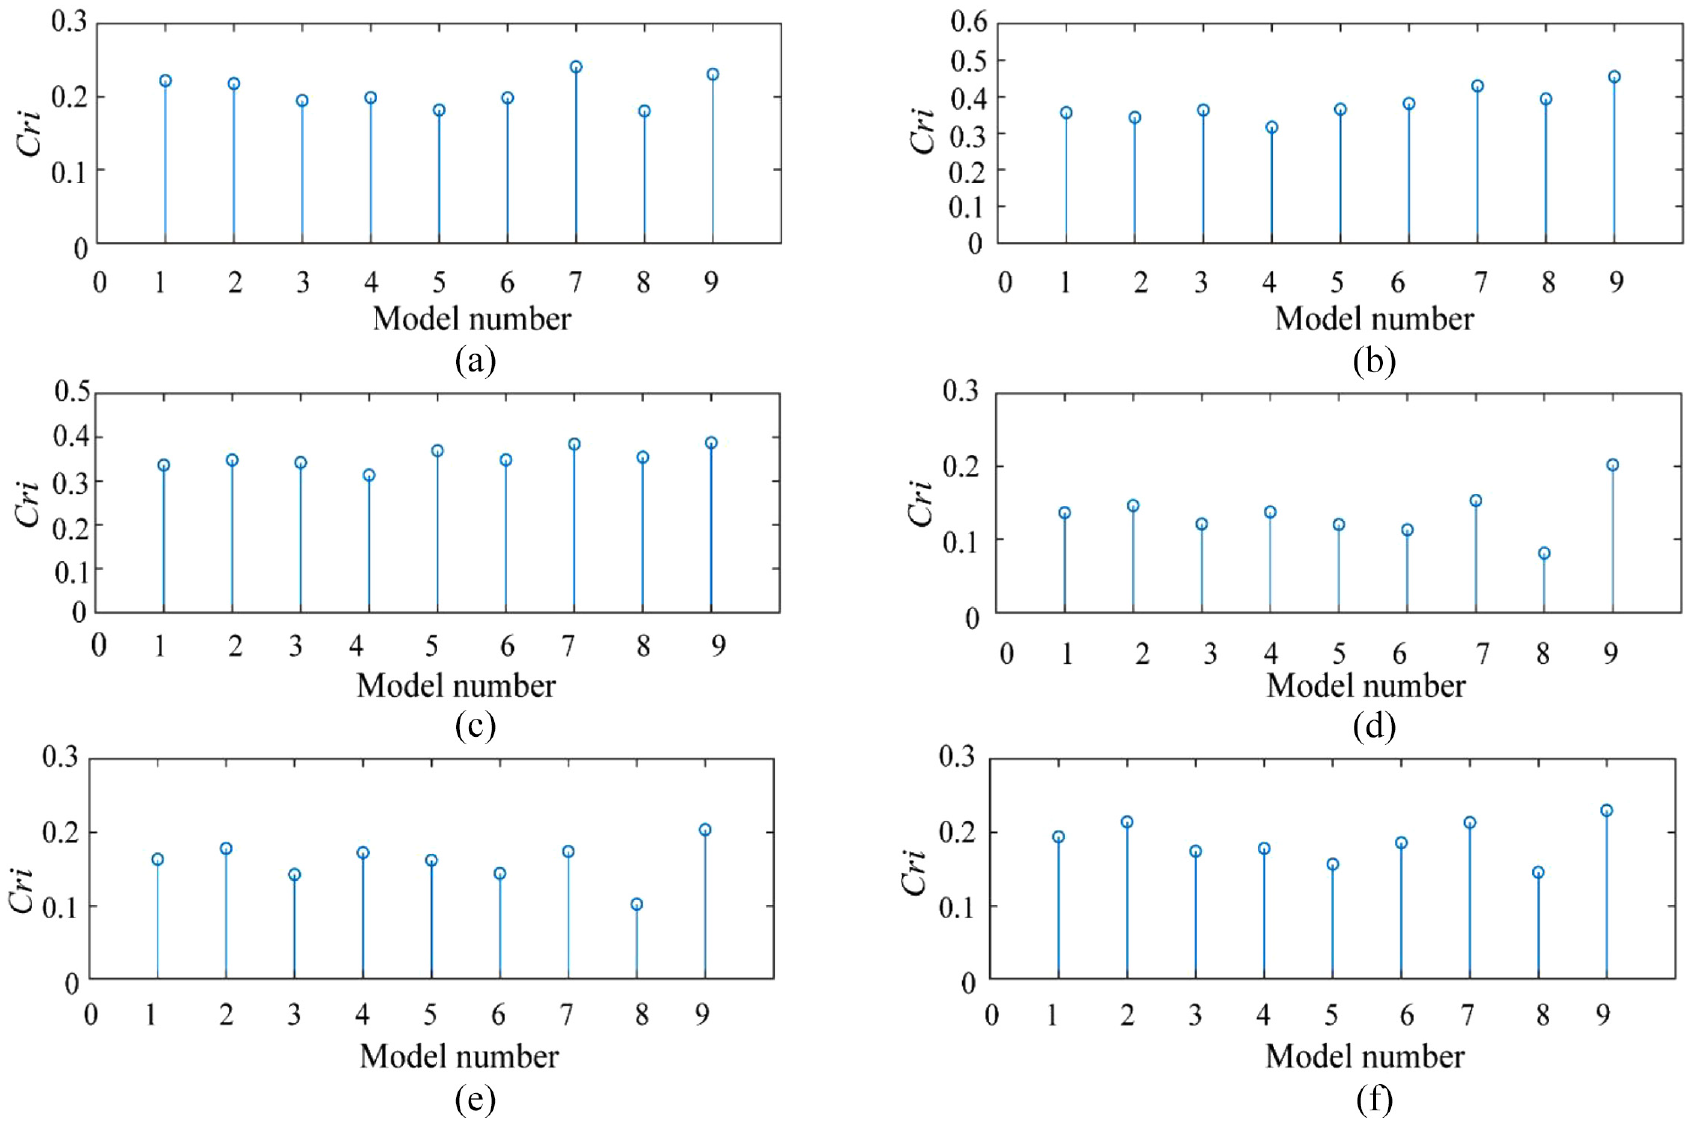
Average Cri index of tested bearing: (a) bearing B1_2, (b) bearing B1_3, (c) bearing B1_4, (d) bearing B1_5, (e) bearing B1_6, and (f) bearing B1_7
Feature average Cri index of each model.

Comparison with symmetrical structures
To show the advantage of the proposed method, ensemble AEs based on symmetric structure are also introduced for comparison. Figure 16 shows the model structure based on symmetric AEs. In this control experiment, various experimental parameters are consistent with the methods proposed in this paper, except that the activation function.

The structure of the symmetric model.
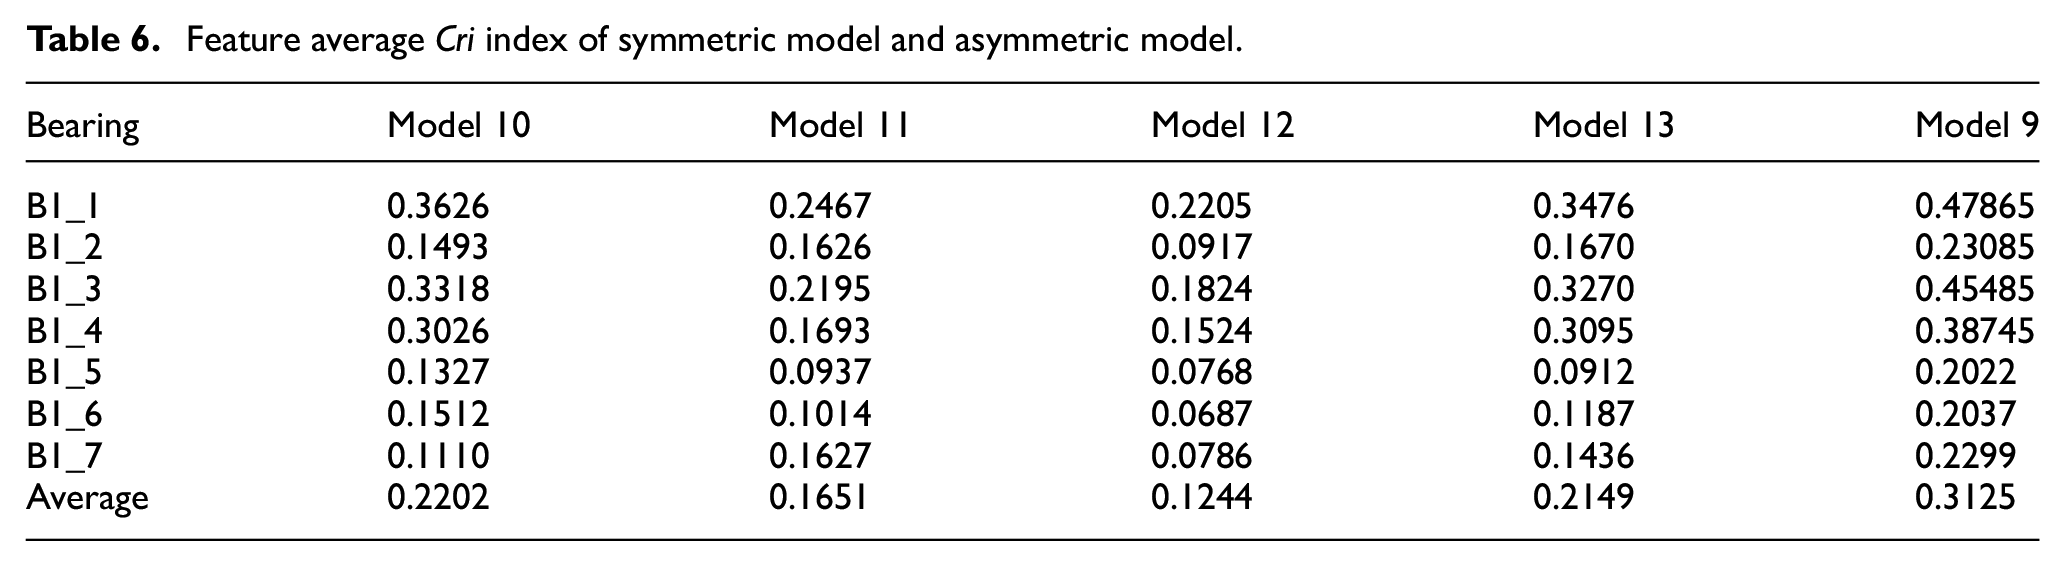
Table 6 lists the average Cri index of each model. Among them, model numbers 10–13 are the four symmetric models of this control experiment, and model number 9 is the model proposed in this paper. The B1_1 is used as the training dataset, and the remaining data sets are used as the testing datasets. It can be concluded from Table 6 that since the degradation trend of bearing 1 is obvious, it has a higher Cri index than other bearings. On the contrary, the insignificant degradation trend of bearing 5 determines that it has the lowest Cri index. The average Cri proposed in this paper is 0.0923, 0.1475, 0.1685, and 0.0976 higher than that of model 10, model 11, model 12, and model 13, respectively. The method in this paper has a higher Cri index than the model with a symmetric structure. Therefore, the performance of the proposed model is remarkably higher than that of the model with a symmetric structure.
Feature average Cri index of symmetric model and asymmetric model.
Comparison with other methods
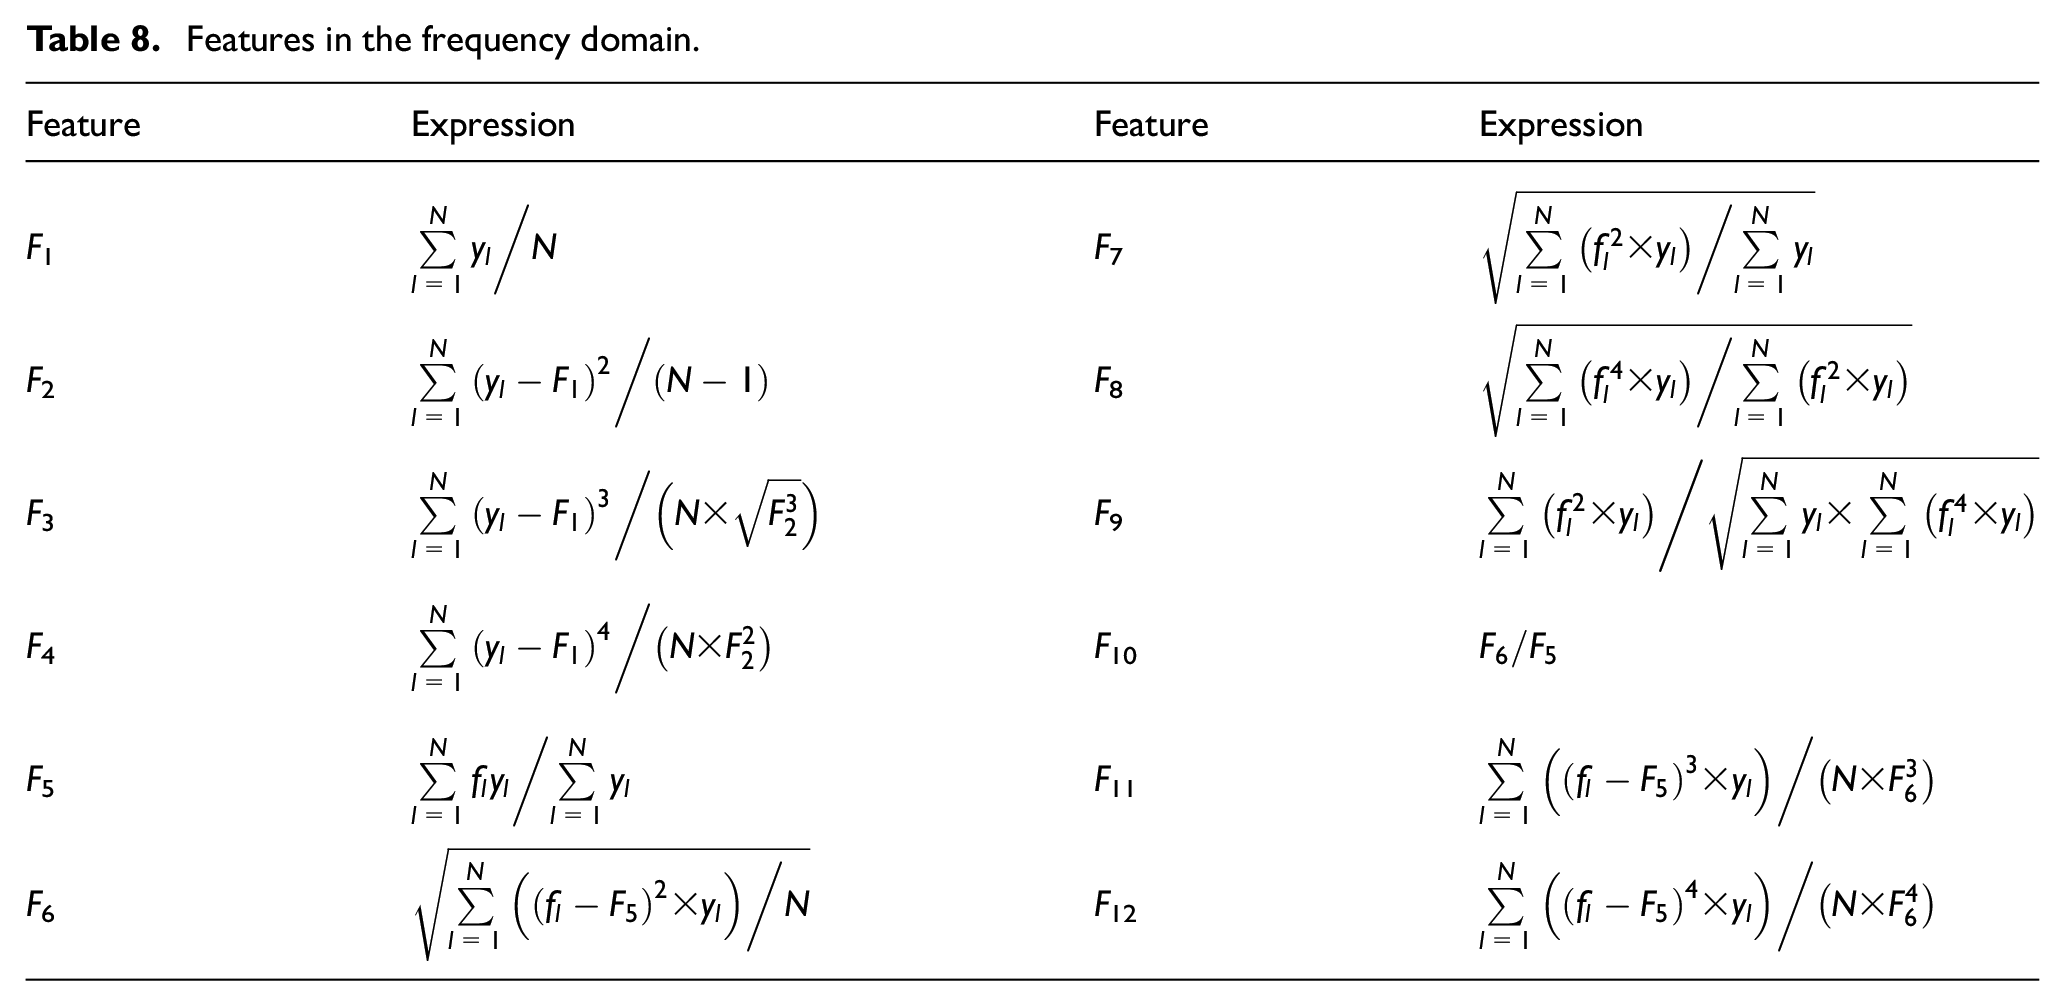
In the first strategy, statistical locally linear embedding (S-LLE) 27 is used to reduce the features dimension to five-dimensional. These features including the six time-frequency domain features extracted from the original vibration signal and the classical 28 features shown in Tables 7 and 8.
The second strategy is stacked denoising autoencoders (SDAE), which introduced a bagging ensemble strategy. 28 In this method, 10 bootstrap replicas are randomly generated from the training data, and then bootstrap samples were used to train 10 models respectively. The parameters of this method are shown in Table 9.
The third strategy is stacked multilevel-denoising autoencoders (SMLDAEs). 29 In this method, multiple noise levels are used to train the three SDAEs, the noise levels are 0.1, 0.2, and 0.3, respectively. All layers of representation are stacked after the unsupervised learning. The parameters of this method are shown in Table 10.
Features in time-domain.

Features in the frequency domain.
Parameters of SDAE.

Parameters of SMLDAEs.

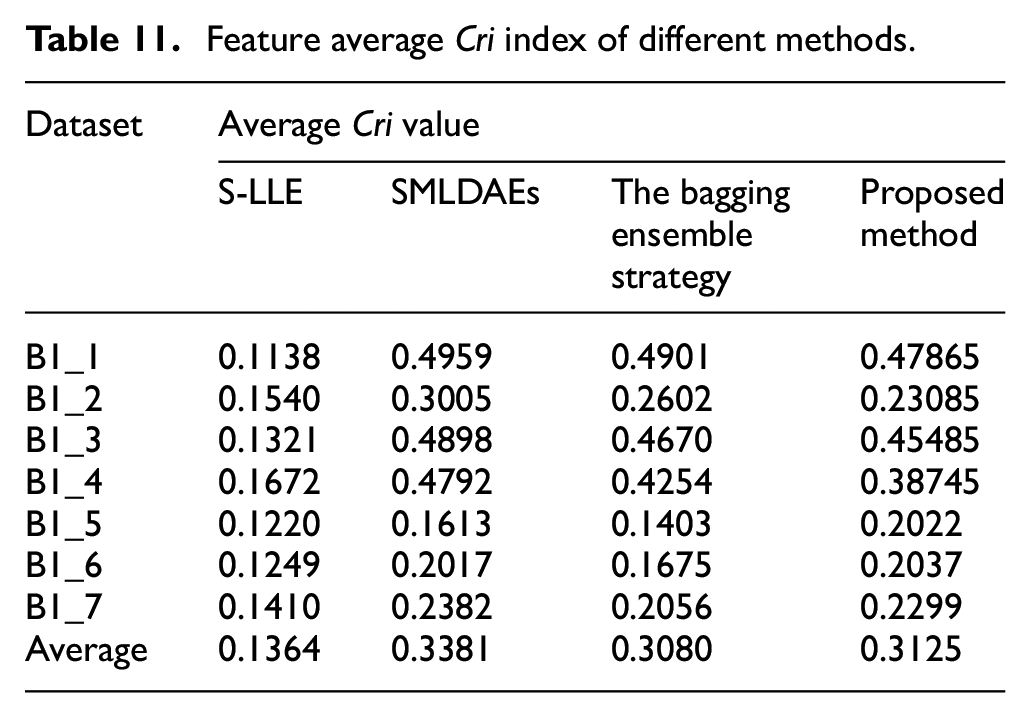
Table 11 lists the average Cri index of each method. Among them, B1_1 is used as the training dataset, and the remaining data sets are used as the testing datasets. It can be concluded from the Table 11 that the average Cri index in this paper is higher than the bagging ensemble strategy and S-LLE, the feature average Cri index of SMLDAEs is only higher about 0.025 than the proposed method, it can be seen that the proposed method performance well.
Feature average Cri index of different methods.
Conclusion
This paper proposes a bearing operational reliability assessment using an ensemble deep AE based on asymmetric structure. SAE feature extraction models with different activation functions of various types are set in this method, and the features of parallel learning are analyzed and clustered, the features highly correlated to the degradation of the rolling bearing are extracted. Combined with the reliability definition based on Mahalanobis distance, the running reliability evaluation model is established to realize the detection and reliability evaluation of rolling bearing.
The conclusions of the proposed method are summarized as follows. (1): The comparison proves that the proposed asymmetric SAE structure for feature extraction can more effectively extract features from the vibration signal of the rolling bearing, and this feature learning method learns the original signal from various aspects, and the obtained features are more comprehensive. (2): The ensemble strategy with a variety of asymmetric structure integrates the advantages of ensemble learning, which enriches the degradation features. (3): The feature selection based on correlation analysis can further screen out the features highly related to the performance degradation of rolling bearing and the reliability definition method of Mahalanobis distance can efficiently represent the performance change trend of rolling bearing.
The disadvantage of this paper is that this method is only applicable to a single working condition scenario and cannot adapt to the changes of working conditions. This is mainly caused by the assumption that the distribution of training data and test data in deep learning is consistent. In the future, further research will be done to solve this problem by transfer learning.
Footnotes
Handling Editor: Chenhui Liang
Declaration of conflicting interests
The author(s) declared no potential conflicts of interest with respect to the research, authorship, and/or publication of this article.
Funding
The author(s) disclosed receipt of the following financial support for the research, authorship, and/or publication of this article: This research was supported by Zhejiang Provincial Key Research and Development Plan of China (Grant No. 2020C01056).