
Abstract
The characteristic of rough contact interface has a major influence on overall performance of machines. To facilitate the setting of contact interface characteristics during the performance analysis of the whole machine, an equivalent characteristic model of a rough contact interface based on virtual material method is established. The normal and tangential properties of the rough contact interface per unit area are first experimentally conducted. Furthermore, according to the Greenwood-Williamson (GW) model and stress wave propagation conditions of discrete elements, the relationship between normal and tangential contact characteristics is explored by assuming the rough contact interface per unit area as a thin virtual layer. Based on virtual material method, the equivalent characteristic model of a rough contact interface is established, including equivalent virtual elastic modulus, Poisson’s ratio, thickness, and density. Finally, taking two step-shaped steel plates connected by four bolts for example, a numerical simulation of structural characteristics under different preloads is carried out. Numerical analysis results are then compared with tested results to verify the validity of the equivalent virtual material model of rough contact interface, and a good agreement between them is obtained.
Introduction
In order to satisfy different needs, a mechanical equipment generally assembled with multiple parts. Rough contact interfaces are used widely in a variety of mechanical equipment. Therefore, rough contact interfaces have a major influence on overall performance of an assembled system and are a major limitative factor in improving the operation accuracy and efficiency of a mechanical equipment.1,2
Numerous investigations on the properties of a rough contact interface have been conducted theoretically and experimentally. The characteristics of a rough contact interface are closely relevant to its rough surface profiles. In 1966, Greenwood and Williamson 3 made a basic elastic contact model (GW model) on the basis of the Hertz theory and the statistical theory, which only involved the elastic contact and ignored the elastoplastic and plastic deformation. In 1987, Chang et al. 4 proposed the CEB model on the basis of the GW model, which considered cohesion and the plastic deformation of asperities. In 1991, Majumdar and Bhushan 5 initially proposed the fractal contact model (MB model), which characterized rough surfaces by Weierstrass–Mandelbrot function. In 2000, Zhao et al. 6 proposed an elastic-elastoplastic-plastic contact model (ZMC model), which described the entire procedure from elastic deformation to fully plastic deformation of profile asperities. In 2002, Kogut and Etsion 7 simulated the contact hanging process of asperities following a statistical height distribution analyzed based on finite element method, and established the KE model by studying the micro-contact. In 2005, Jackson and Green 8 simulated the relationship between the yield strength ratio and average contact pressure in contact zones for multiple contact models, put forward an expression of hardness variety, and established the empirical elastoplastic contact model (JG model) for single asperity. In 2007, for solving a critical drawback of the MB model, Morag 9 proposed a new elastoplastic contact model of rough surfaces by assuming that the asperities are deformable. In 2012, Brake 10 proposed an elastic-elastoplastic-plastic contact model (Brake model), which involved the flow between the elastic zone, mixed elastoplastic zone and fully plastic zone. In 2013, Liu and Xia 11 proposed a general method for the adhesion behaviors of elastic systems with movable boundaries. In 2015, Shi et al. 12 assumed the asperity contact of the interface as an elliptical contact, and considered that the profile asperities followed a two-dimensional Gamma distribution. In 2017, Yuan et al. 13 provided a revised MB model between elastic-plastic rough contact interfaces, which revealed that roughness levels have an impact on the contact characteristics of rough interfaces. In 2019, assuming that the interface is a thin virtual-material layer, Xiao and Sun 14 put forward an explicit approximated expression to represent the contact stiffness of a rough contact interface and deduced the properties of a rough contact interface on the basis of the statistical contact theory. In 2019, Wang et al. 15 proposed a harmonic interpolation method to describe rough surfaces in the deterministic elastic-plastic contact simulations under the normal and tangential loading. The method can push the simulation results closer to reality. In 2022, based on physically-rooted contact mechanics laws, Xu et al. 16 used a statistical model to describe the contact between a smooth rigid flat surface and a nominally flat linear elastic rough surface, which considered the quasistatic tangential loading, up to full sliding. In 2022, Kang et al. 17 put forward the non-Gaussian property to describe rough surfaces in the contact model of coated piston ring and honed cylinder liner.
Experimental research works on the properties of a rough contact interface use spring dampers, contact elements, and virtual materials. By examining the frequency-response function, the ultrasonic reflection coefficient, and the loading-deformation relationship, the characteristics of a rough contact interface are separated from the whole structural system. In 1971, Kendall and Tabor 18 put forward a spring model by modeling the rough contact interface as a stiffness layer, and describe the relationship between the ultrasound reflection and the interface stiffness. In 1988, Tsai and Chou 19 adopted the frequency-response-function (FRF) method to distinguish the characteristic of a rough contact interface by only thinking about rigidness and damping. In 1996, Drinkwater et al. 20 achieved the contact stiffness of a rough contact interface under different pressures on the base on the spring model; however, the measured stiffness values were always higher than the predictions by the elastic GW statistical contact model. In 2004, Song et al. 21 proposed a new beam element for the kinetic reaction of structures with rough contact interfaces. The element was made up of two adjusted Iwan models, and owned the typical free degrees of the displacement and rotation. In 2012, using a dynamic model of experimental system, Vakis and Polycarpou 22 assumed that a rough contact interface of the tested structural system was a virtual subsystem, and obtained the characteristic parameters for the rough contact interface. In 2017, Lee et al. 23 studied experimentally on the contact behavior of micro/nano devices, and verified the analysis results of other statistical methods by the obtained experimental results. In 2021, using instantaneous contact stiffness, Ranjan and Pandey 24 obtained the hysteresis loop during pinning due to compression and restitution and integrated the hysteresis loop into the Iwan model. In 2021, Saeed 25 proposed a correlation based approach in the system equivalent model mixing (SEMM) method, which is an FRF based expansion method. By using different combinations of the experimental FRFs and computing parameters, the method generated systematically several expanded models and improved the quality of the expanded sub-models.
At present, there is still a lack of an effective parameter model for rough contact interfaces, which leads to poor simulation results of mechanical equipment characteristics. During the analysis, existing setups usually vary from individual to individual. In the present paper, a rough contact interface is estimated by assuming it as a thin virtual layer. For the same type of rough contact interface, assuming that the contact pressure per unit interface area is the same, the characteristics of the rough contact interface per unit area are the same. This is convenient to apply the research results of the rough contact interface to the numerical analysis of the machine characteristics.
The remainder of this article is organized as follows. In section “Characteristic analysis of a rough contact interface,” the characteristic study of the rough contact interface per unit area is first experimentally conducted. Furthermore, on the basis of the GW model, the relationship between the normal contact stiffness and the equivalent virtual elastic modulus of a rough contact interface per unit area is explored. In section “Equivalent characteristic model of a rough contact interface based on virtual material method,” the equivalent characteristic model of a rough contact interface based on virtual material method is established. The equivalent characteristic model of a rough contact interface includes the equivalent virtual elastic modulus, Poisson’s ratio, thickness, and density. In section “Calculation example,” taking two step-shaped steel plates connected by four bolts as the research object, a finite element analysis of structural properties is carried out. Computational results are compared with experimental ones to verify the validity of equivalent virtual material model of a rough contact interface. In section “Conclusion,” the conclusion of this paper is shown.
Characteristic analysis of a rough contact interface
Numerous complicated factors influence the characteristics of a rough contact interface: materials, contact surface appearance, pre-tightening force intensity, medium between two contact surfaces, interface size and geometry, and force characteristics. Fu et al., 26 Soom and Serpe, 27 and Kucharski and Starzynski 28 all had an identical opinion that the influential factors of joint surface can be classified, and characteristics of the per unit interface area were independent of the structure of the contact specimen. For a kind of rough contact interfaces, supposing that the contact pressure of the per unit interface area was same, the characteristics of a rough contact interface per unit area were identical. Consequently, it is only necessary to research the contacted specimens per unit area of a simple structure in studying the characteristic parameter of rough contact interface.
Experimental research of a rough contact interface
The experimental diagram is displayed in Figure 1. The experimental device could precisely measure the normal pressure deformation of the rough contact interface. The rough contact interface loading exists in the contact region of the upper specimen A and the bottom specimen B. The bottom specimen B serves as a benchmark for approach (displacement of the upper specimen A) measurement. The quasistatic load is imposed progressively by a hydraulic press, which is measured by a tensometric bridge.

Experimental diagram for normal pressure deformation measurement of the rough contact interface.
The normal parametric relationship for a rough contact interface per unit area under the cases of different contacted materials, machining methods, surface topography, and intermediate medium can be written as

where
On the basis of the meaning of stiffness, the normal stiffness of a rough contact interface per unit area can be written as

where
The experimental diagram for the tangential pressure deformation measurement of the rough contact interface is presented in Figure 2.

Experimental diagram for the tangential pressure deformation measurement of the rough contact interface.
The tangential stiffness of a rough contact interface per unit area can be determined as

where
Theoretical research of a rough contact interface based on the GW model
According to Greenwood and Williamson, all roughness asperities of a rough contact interface between two rough surfaces have the identical curvature radius, and the heights of these asperities are randomly distributed around an mean value, as shown in Figure 3. There is no interaction between these neighboring asperities, whose deformations are independent of each other. Therefore, these asperities’ position and the exact shape of the surface have little practical significance in the issue of contact; thus, only the height distribution of the asperities should be considered. The contact between two rough surfaces could be simplified into a contact between a group of elastic hemispherical convex bodies and a smooth rigid plane.3,29
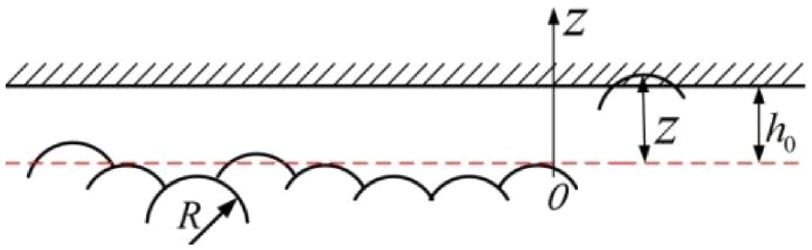
Model of a stochastic surface of the GW model.
According to the GW model, equivalent curvature radius of these elastic asperities with a predefined statistical roughness is R, the distance of a rigid plane from the middle level is

and the force is

where
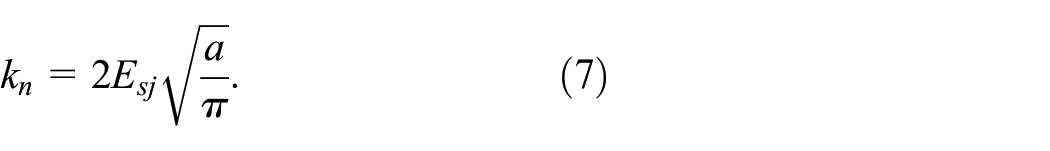
The normal contact stiffness of a single asperity with a smooth flat surface (

According to equations (4) and (6), the normal contact stiffness of a single asperity with a smooth flat surface can be obtained as
In Figure 3, supposing that the asperity height of the rough surface is distributed according to the probability density function, 28 the contact probability of the rough surface, can be obtained as

Assuming that the asperity number of a unit-area rough contact interface is
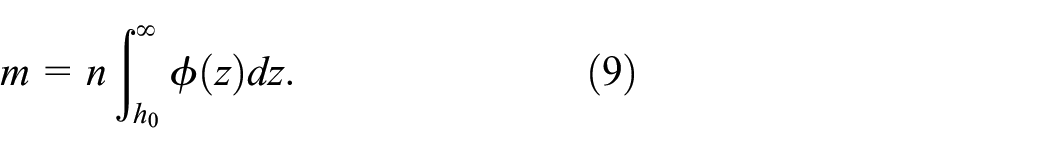
According to equation (9), the real contact area of a rough contact interface per unit area (

Then, the total bearing load (W) of the real contact area is

where
According to equations (7) and (9), the normal contact stiffness of a rough contact interface per unit area can be expressed as

According to equation (12),

Equivalent characteristic model of a rough contact interface based on virtual material method
A rough contact interface is a layer of space region and also a transition region of properties change, 30 as shown in Figure 4. When two machined surfaces come into contact with each other, the asperities of rough surfaces contact with one another firstly. These isotropic asperities of the rough contact interface are distributed according to Gaussian function. The real contact region only accounts for a small portion of the whole rough contact interface.

Diagram of a rough contact interface.
During a numerical analysis, in order to improve the versatility and simplicity of the characteristics of rough contact interface, a rough contact interface is supposed as an isotropic virtual material. The numerical model of a contact structure is made up of three parts: part I, part II and the rough contact interface. The properties of part I are identical to properties of component A, and the properties of part II are identical to properties of component B; thus, the rough contact interface is composed of the contact areas of components A and B.
Equivalent virtual elastic modulus (
) of a rough contact interface
As the asperity height of an rough surface is relative to statistical distribution characteristic 29 and the asperity height obeys an index distribution approximately, thereby according to the results of the above-mentioned analysis from the GW contact model, equations (10) and (11) can be revised as


According to equations (14) and (15), the real contact area of a unit-area rough surface (

Then, from equations (13) and (16), the equivalent virtual elastic modulus of the actual contact surface per unit area can be expressed as

Assuming that the nominal contact area is
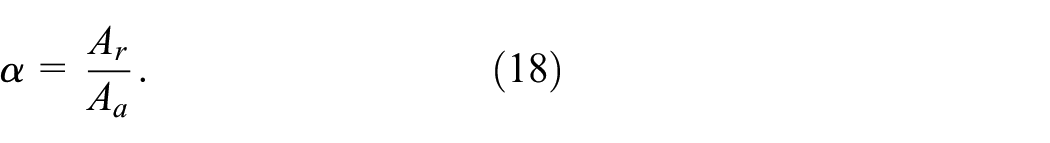
On the basis of the meaning of elastic modulus and substituting equation (18) into equation (17), the equivalent virtual elastic modulus of the rough contact interface per unit area can be expressed as

where
Equivalent virtual Poisson’s ratio (
) of a rough contact interface
During the numerical analysis of the rough contact interface, in order to simulate the interface easily, the interface was equivalent to an isotropic continuous medium, and the discrete model of the interface was established on the scale of unit area. In the discrete model, when an element was in equilibrium, forces on the element were certain.
Two block elements with masses m1 and m2 were used as objects to establish a contact model shown in Figure 5, where

Contact model of two block elements.
Generally, the separation between two blocks leads to a shortening of the vibration wavelength and an increase of the natural vibration frequency (Figure 5). The natural frequency (or minimum frequency) of the system (

where

where
When the pressure is applied to the boundary of the isotropic continuous block element, the maximum wavelength of the stress wave is twice the minimum side length of the block element. As the block element is small, the maximum wavelength of the stress wave is also small; however, the natural frequency of the block element is high. The maximum natural frequency of the system (
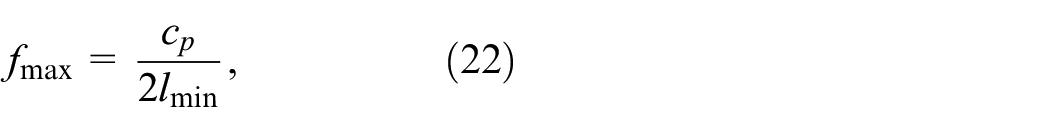
where
The dynamics of the system is analyzed according to Newton’s second law, and the maximum natural frequency of the system can also be defined as

According to equations (21) and (22), the normal stiffness of a rough contact interface per unit area (
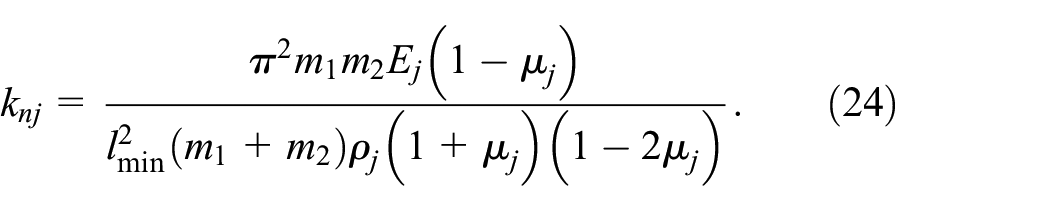
Similarly, according to the maximum propagation speed of the stress shear wave in the block element, the tangential stiffness of a rough contact interface per unit area (

where
From equations (23) and (24), the equivalent virtual Poisson’s ratio of the rough contact interface (

Equivalent virtual thickness (hj ) and density(
) of a rough contact interface
The contact interfaces are mostly consisted of mechanically processed surfaces, which are composed of multiple surface layers with different physical, chemical and mechanical properties. A typical surface layer structure of machined metal is shown in Figure 6, which is usually consisted of absorption film, oxidation film, beneath layer, deformation layer.
29
By analysis of 45 steel surface layer structure with roughness of 0.8 μm, the equivalent virtual thickness (

Typical metallic surface layer structure.
According to the definition of material density, the equivalent virtual density (

where
Calculation example
Two step-shaped steel plates connected by four bolts are taken as the research object, and its schematic diagram is displayed in Figure 7. The two step-shaped steel plates are both 45 steel, which have a length of 240 mm, a width of 80 mm, and a height of 15 mm at one end and 20 mm at the other end. The rough contact interface between these two steel plates has a length of 80 mm, a width of 80 mm, and a roughness degree of 0.8
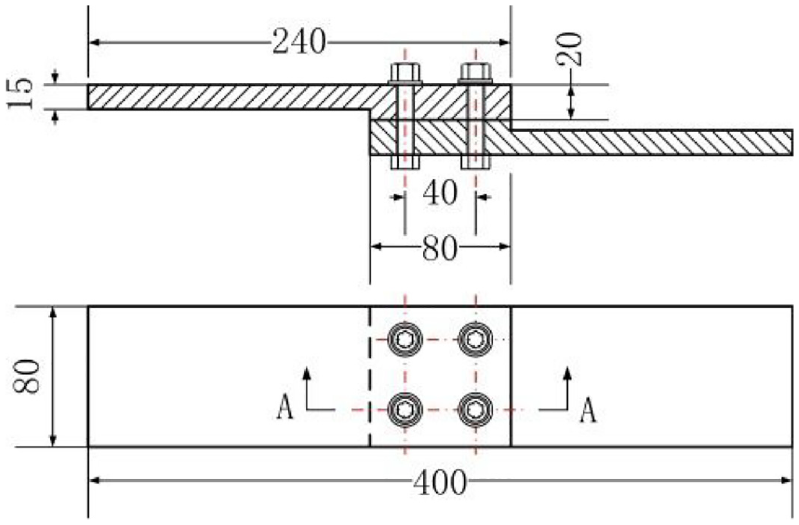
Mechanical structure connected by bolts.
Figure 8 presents the characteristic test setup of the proposed structure. The test piece is hung by elastic ropes to simulate a free degree of freedom state. A pre-tightening force is applied to the bolts by a torque wrench. The steel plates are vibrated at a single point in a vibration exciter, and vibration signals are collected by an accelerator sensor. The collected vibration signals are analyzed, and the first three frequencies under different preloading moments are obtained. The main equipment of the test system includes: ICP piezoelectric three-way acceleration sensor of DYTRAN company, TV51110-S513 exciter of TIRA company, and SO Analyzer dynamic analysis system of M + p company.

Characteristic test setup of the mechanical structure: (a) schematic diagram of experiment and (b) experimental field.
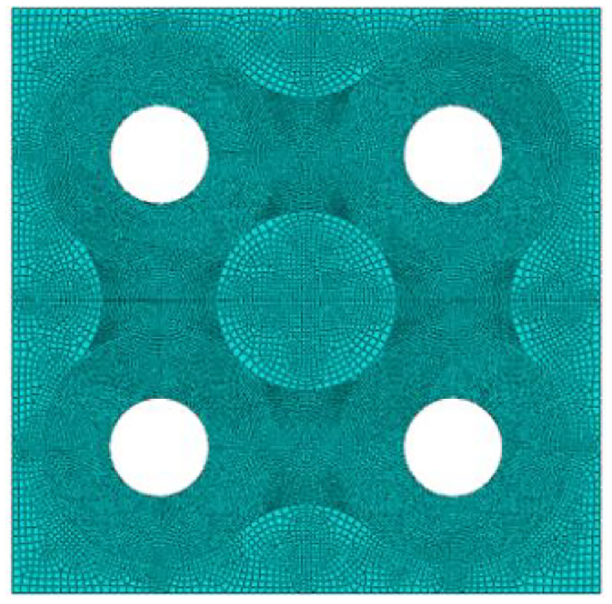
The characteristics of the rough contact interface are related to the contact conditions and stress conditions of the contact parts. Finite element models for the bolted steel plates are established in ABAQUS software, as shown in Figure 9, consisting of 286,512 C3D8R elements.

Finite element model of the steel plates.
The rotation torque of the bolts is 15, 25 and 35

Stress diagram of the contact area: (a) 15
The simplified calculation model of the steel plates is presented in Figure 11. The specimen is divided into three parts. The characteristics of the first and second parts are similar to those of the stepped steel plates. The third part is the rough contact interface.

Calculation model of the steel plates.
According to the literature
33
and normal stress distribution of the contact area under different rotating torque, the applied preloading moment is simplified. As the normal stress at the rough contact interface is centrosymmetric, the normal stress analysis is carried out at the rough contact interface of section A-A in Figure 7. When the rotation torque of the bolts is 15

Simplified normal stress model of section A-A.
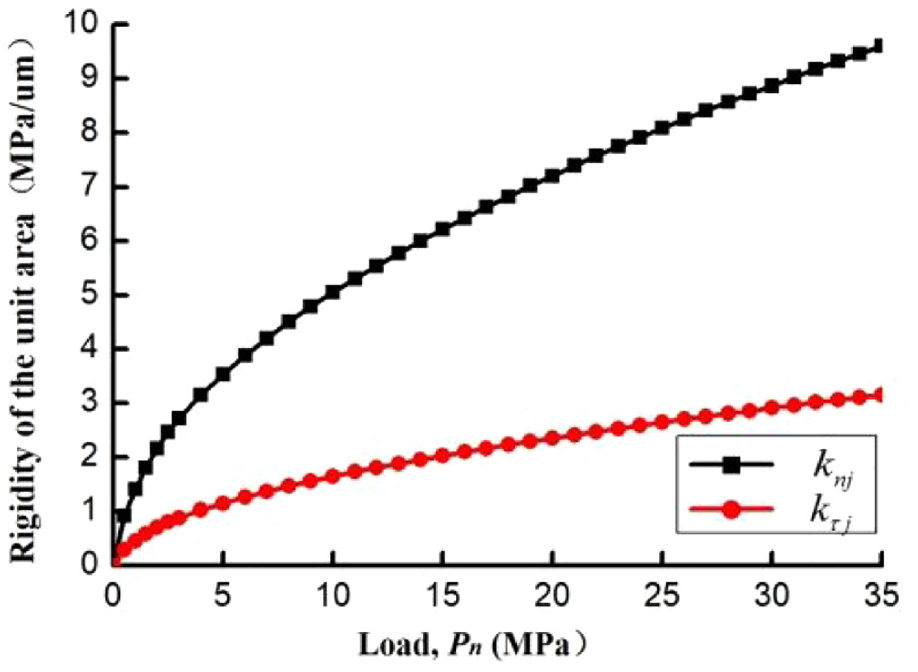
Based on equations (2) and (3), the characteristics of the rough contact interface are experimentally obtained. Figure 13 plots the experimental results of
According to the statistical theory and the literature,
34
the root-mean-square value (

Ej/μj versus normal pressure plots.
To verify the validity and accuracy of the equivalent virtual material model of a rough contact interface, finite element models for the bolted steel plates are established in ABAQUS software, and the lower third-order frequency of the mechanical structure are obtained. According to the literature,
31
the equivalent density of the rough contact interface (
Stress diagram of the contact area.
When the rotation torque of the bolts is 15
Comparison between experimental and simulation results of the first three modal frequencies.


The first six modes of the model.
The main reasons for the error of the equivalent characteristic model of a rough contact interface based on virtual material method are as follows:
Although the roughness of the contact surface in the normal/ tangential stiffness experiment per unit area is the same as that in the calculation example, the micro morphology between them is not exactly the same and there are differences.
The GW contact model simplifies the rough surface for contact analysis. With the progress of surface measurement technology, the GW contact model can be modified to improve the accuracy of contact analysis. Because the stiffness expression of the whole rough surface is relatively simple compared to other contact models, the GW contact model has been widely used in contact analysis. 14 However, the model is mainly aimed at the elastic deformation of the micro convex body, and the micro convex body has elastic-plastic deformation in the contact process of the rough interface. The GW contact model can’t accurately describe the deformation process of the micro convex body on the rough contact interface.
Conclusions
It is difficult to directly use the results of contact theory and experimental research when analyzing composite structures with commercial finite element software. In order to solve this problem, a virtual material is proposed to simulate the rough contact interface, and the material characteristics are derived from the coupling contact model and experimental research. First, the universal expressions of different characteristics of a rough contact interface (normal and tangential contact stiffness per unit area) are established experimentally. Second, according to the GW model and stress wave propagation conditions for discrete elements, the equivalent virtual material model of a rough contact interface is derived.
Finally, taking two step-shaped steel plates connected by bolts as the research object, the modal frequencies of the test specimen under different preloads are calculated by the modal analysis. The modal characteristics of the specimen are analyzed numerically. The error between the simulation and test modal frequencies under the same pre tightening torque is within 5%, which verifies the accuracy and usability of equivalent virtual material model of a rough contact interface. The outcomes of this research lay a foundation for future studies on rough contact interfaces.
Footnotes
Handling Editor: Chenhui Liang
Declaration of conflicting interests
The author(s) declared no potential conflicts of interest with respect to the research, authorship, and/or publication of this article.
Funding
The author(s) disclosed receipt of the following financial support for the research, authorship, and/or publication of this article: This work is supported by the National Natural Science Foundation of China (11872300) and the Key Research and Development plan of Shaanxi Province of China (2017ZDXM-GY-133).