
Abstract
Marble is a fragile and heterogeneous material whose properties vary depending on the nature and origin of the marble. Therefore, the marble machining process requires the skills and know-how of the stone cutter to manually configure the machining parameters for each piece of marble. This study addresses the enhancement of quality achieved by marble drilling processes in the industry. The objective of this work is to drill marble with high quality performance and avoid fracturing the material. This article focuses on the process of drilling white Carrara marble with an abrasive water jet. This unconventional tool significantly reduces unwanted damage resulting from the drilling process (fractures, spalling) compared to the conventional drilling process (rotating abrasive tools). The effect of waterjet cutting parameters, namely jet pressure, stand-off distance, nozzle traverse speed, abrasive flow rate, and hole diameter on drilling tolerances is studied. Five defects in the drilling process are modeled in this work: surface roughness, hole circularity, hole cylindricity, hole location error, and hole taper, using analysis of variance of linear regression models and an artificial neural network width high accuracy. These models could be of great interest to stone cutters to configure marble machining parameters and improve marble manufacturing quality.
Keywords
Introduction
Marble is a rocky material produced by the metamorphism of carbonate sediments consisting mainly of crystals of calcite CaCO3 and or dolomite. It is a compact limestone difficult to cut with a beautiful polish and frequently contains colored veins according to Liu et al. 1 its mineral constituents (especially organic contents) as well as the temperature and pressure occurring during metamorphism. Karaca et al. 2 call marble rocks containing pure calcite mono-mineral marbles and the marble rocks containing minerals other than calcite, poly-mineral marbles. Another classification of marble cited by Taelman et al. 3 and Columbu et al. 4 is based on its provenance by performing mineralogical and petrographic observations of thin marble is used everywhere in the construction and decoration of buildings, flooring, individual architecture and sculptured statues, and the construction of sections to determine the quarry of origin. This provenance affects the processing and marketing of marble. Marble monuments. However, its microstructure affects the machining process.
This article is focused on white Carrara marble which is very popular for its high quality and resistivity. Sheremeti-Kabashi and Snethlage 5 proved that Carrara marble has an anisotropic structure. Boudani et al. 6 consider that Carrara marble is a heterogeneous calcitic marble that includes different sedimentation layers, different grain size sand resistances, internal flaws (e.g. micro and macro cracks and pores) and they proved that the higher solubility of calcite can facilitate the enlargement of microcracks and form more crystalline salts following the evaporation of water. The anisotropy of the material and its heterogeneity implies that the same material behaves differently when machined in different positions. Furthermore, the calcite nature of the rock causes the coalescence of internal defects over time. These factors are all involved in the brittleness of marble and in the fracture process. Therefore, the efficiency of digital machining of this material is limited. Indeed, the machining of marble depends on several factors such as cutting tool properties, machining parameters, workpiece properties, and cutting phenomena.
These factors include working machines that are classified as conventional and non-conventional. Conventional machines use rotating tools which remove the material while non-conventional machines use non sheer cutting tools such as electroerosion, laser, and abrasive water jets. Abbassi et al. 7 performed an experimental study of drilling white Calacatta–Carrara marble using a vertical 5-axis machining center (OMAG) and four diamond tools to predict the cylindricity, circularity, roughness and localization of holes as a function of tool parameters using an Artificial Neural Network ANN model and concluded that rotation speed was the most dominant factor, followed by feed speed, drill bit diameter, and the number of pecking cycles.
Simsir 8 studied the marble cutting process with computer numerically controlled (CNC) saw machines, employing the adaptive adjustment of feed rate, which saves material as well as time, labor and cutting costs. Suharto et al. 9 examined the surface roughness of marble machined by the Router 3-Axis CNC machine using carbide cutting tools. In the same context, Özkan et al. determined appropriate machining parameters (Depth of cut, Feed rate and Cutting feed) for the CNC milling of marbles. Their results showed that the parameters of depth and feed rate have the greatest effect on surface roughness when machining marbles. 10
Thus, the literature cites several cases of studies of the quality of the surface machined by conventional machines, such as geometric tolerances and shape tolerances as a function of the parameters of the rotating tools used. However, a critical drawback of conventional machines is that marble can be severely damaged during machining. When performing primary tests to select the proper range of variation of the different parameters of the conventional drilling process for Carrara marble, Abbassi 11 mentioned, the fracture of Carrara marble plates and the tearing of the material on the profiles of the exit holes. Similarly, Mikhailova et al. tested marble drilling with three different tools (core bit, masonry bit, HSS (High Speed Steel) jobber). The marble was chosen with fine grain to reduce the fluctuations of cutting force during the drilling process, but the higher stress initiated in the samples by the CD (conventional drilling) exceeded the strength of the sample, with the drill breaking the material as it exited the hole, creating a crucible and causing significant damage to the marble. 12 A study by Wu et al. 13 on the effects of marble micro-structure on marble fracture highlighted that the degree of rock broken increases with grain size, signifying that the more the grains become irregular, the greater the damage to the rock. Therefore, the contact between the rotary tool and the marble and the fragility of the latter participate in limiting the conventional drilling process.
In the following part, a non-conventional marble drilling tool is proposed, namely an abrasive water jet, to overcome the fracture of the material during drilling, which is a critical phase for a brittle material. Indeed, Natarajan et al. 14 confirmed that compared to other non-traditional cutting machines such as Electrical Discharge Machining (EDM) and the laser machining process, the Abrasive Water Jet Machining (AWJM ) process remains more efficient and is able to cut all kinds of materials such as metals, non-metals, composites, and ceramics with no thermal distortion and minimum cutting force exerted on work materials. Another advantage cited by Miranda and Quintino 15 is that this new technology can be easily integrated with existing computer-aided design (CAD) and computer-aided manufacturing (CAM) systems, thereby greatly optimizing the shape cutting process, the elimination of dust, and ensuring good working conditions and environmental performance. The AWJ process overcomes the risk of fracture to marble slabs but this process presents certain limitations. Hlaváč et al. 16 and Pawar et al. 17 asserted that the AWJ process causes the inclination of cut side walls between the surface and the bottom of the part and the appearance of striations according to the thickness of the material. Therefore, the last part of the introduction presents results found by other researchers using an abrasive waterjet during marble machining and positions this study in the literature.
Generally, the quality control of AWJM is done using performance indicators such as surface roughness Ra, cutting depth CD, Kerf width KW, Kerf angle KA, depth of striation free surface d and surface waviness Wa depending on the parameters of AWJM which are jet pressure P, standoff-distance SOD, abrasive flow rate AFR, the nature of the abrasive, the size of the abrasive grains, the traverse speed of the nozzle TS, the diameter of the nozzle, and the nozzle incidence angle and the mechanical properties of the marble (porosity, Shore hardness, Bohme surface abrasion resistance, uniaxial compressive strength (UCS) and density).15–29
To predict the performance of the marble machining process, statistical and metaheuristic models were applied. Table 1 summarizes marble machining quality with the conventional process and the AMJM process according to performance indicators predicted by different models.
Quality prediction of the machined rock surface.
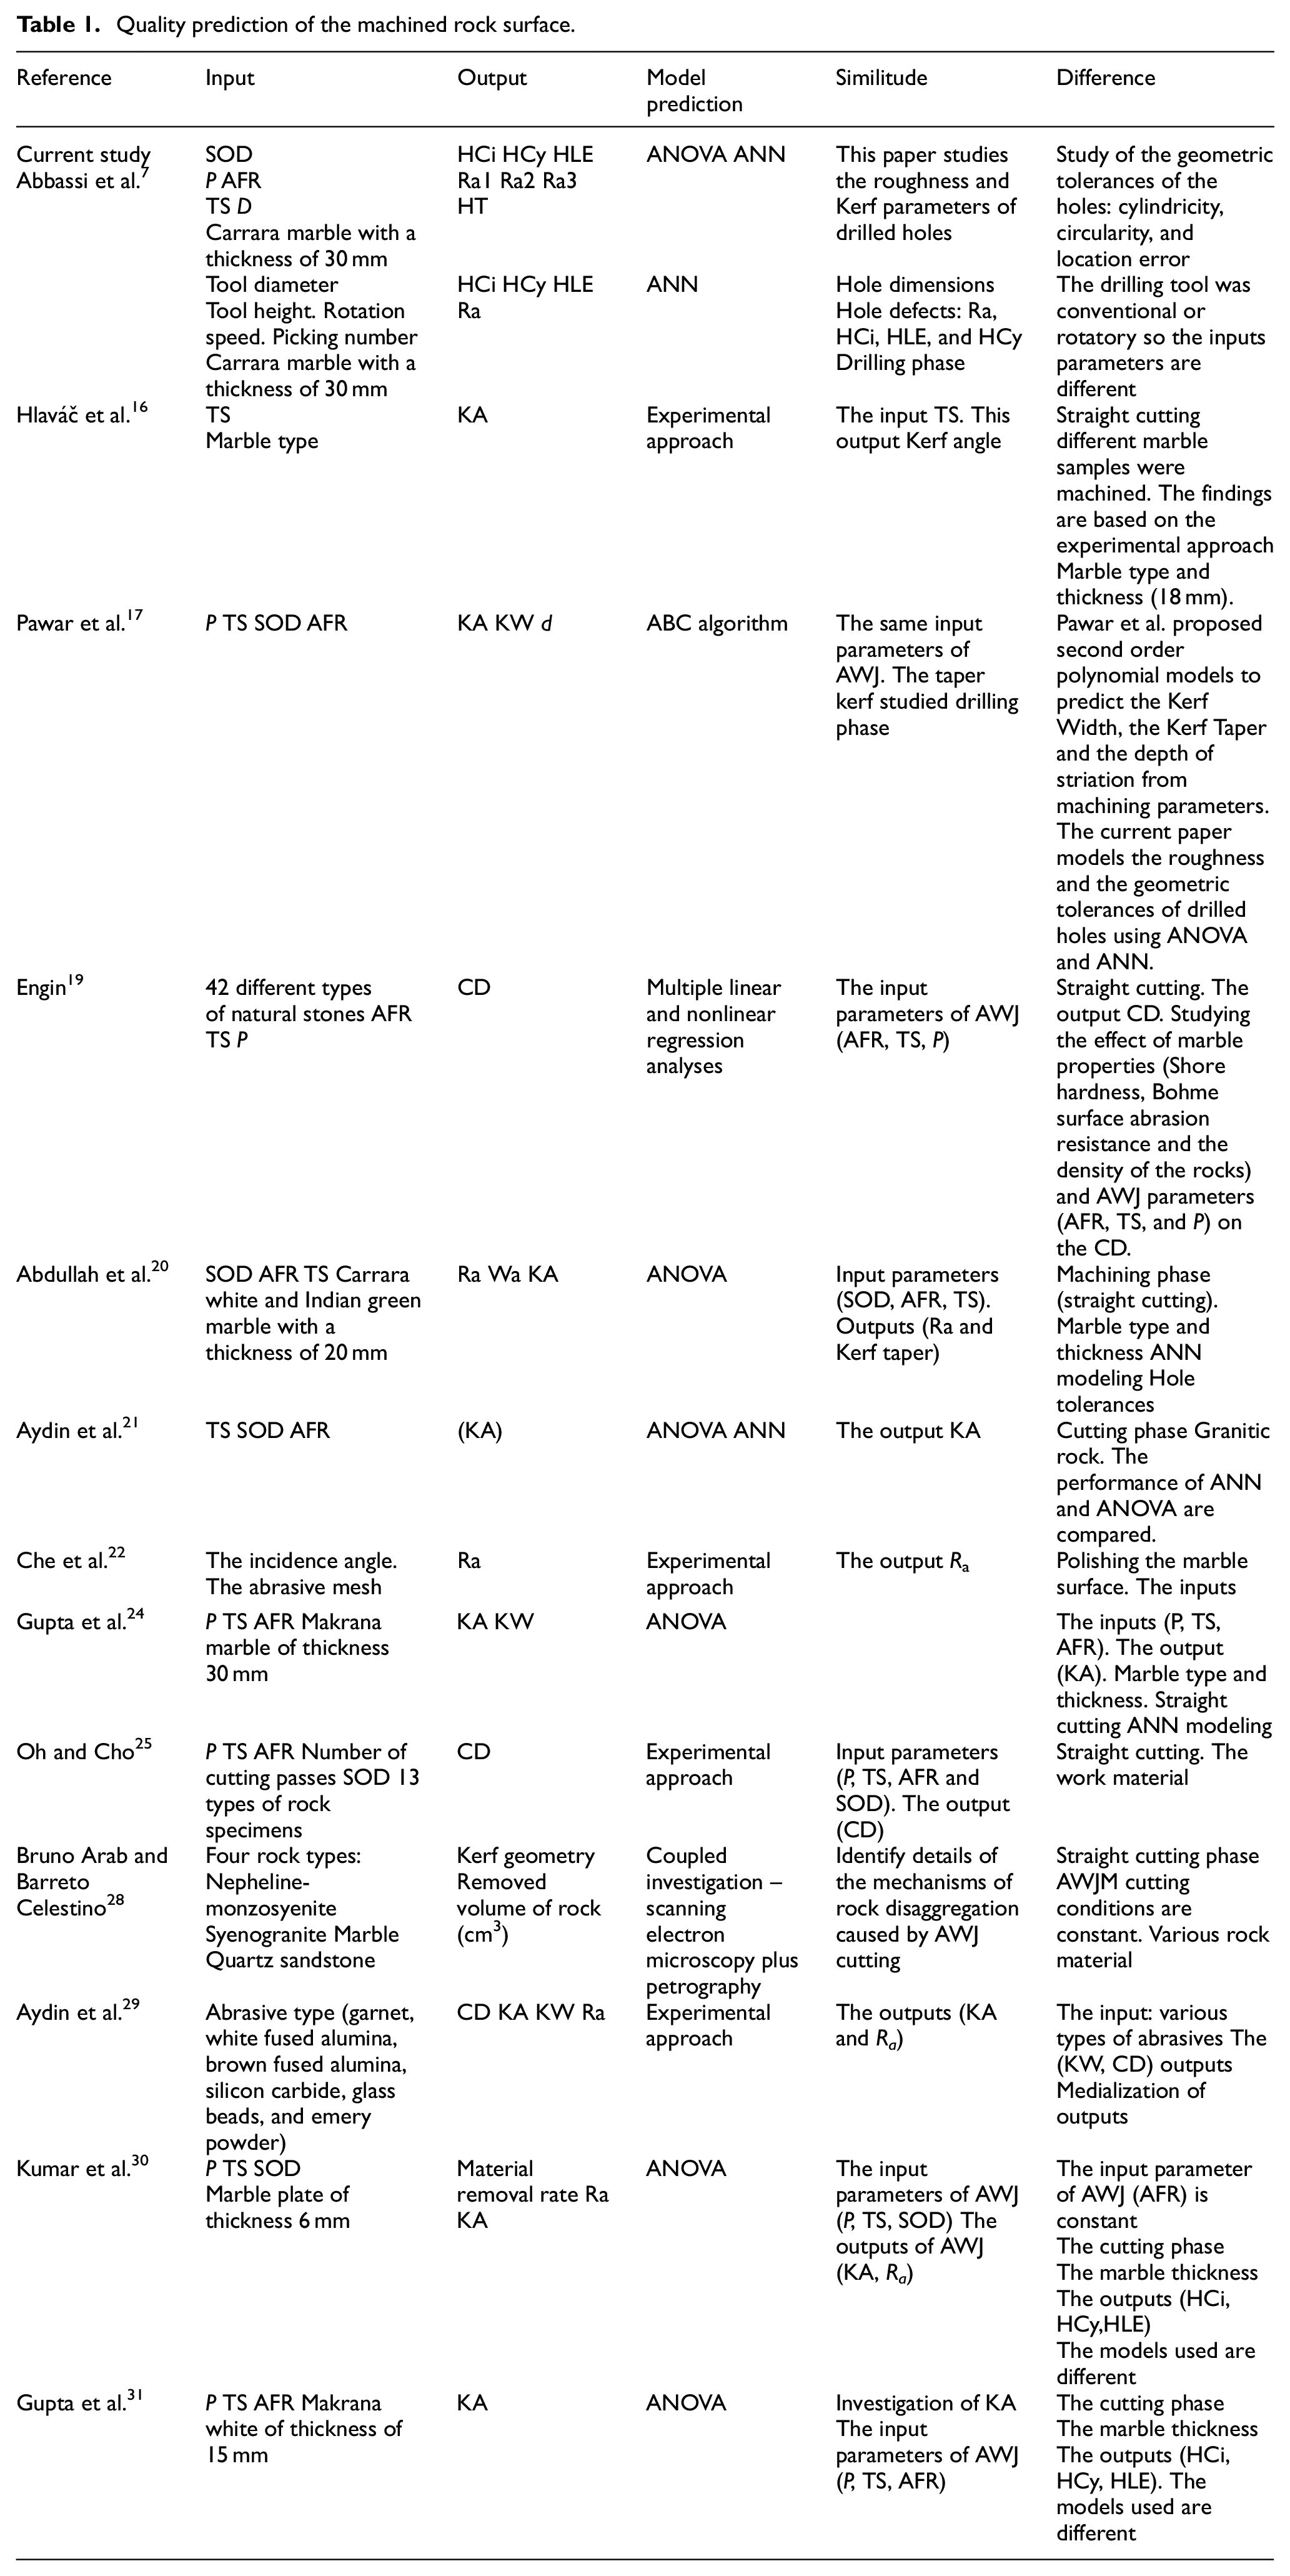
Table 1 provides information on the machining of marbles for different phases such as straight cuts, drilling and polishing for different thicknesses and properties of the material. For this study, the inputs are common with those of the literature on machining by AWJ, that is P, SOD, AFR, and SOD. However, the novelty of this work is that it studies macroscopic defects related to drilling, that is roughness according to the drilled depth, cylindricity, circularity, conicity, and localization error of the AWJ in the hole removed from marble. This work allows modeling the geometrical and dimensional tolerances of the holes according to the parameters of AWJM and improving the quality of marble drilling. It also allows comparing this quality that achieved by rotary tools.
The following part will describe the experimental approach followed to ensure the drilling tests, model the collected data, and then discuss the results with regards to the literature.
Experimental work
The aim of this article on drilling Carrara white marble is to study the effect of the cutting conditions of the abrasive waterjet machine on the quality of the holes. Figure 1 highlights the experimental approach followed in this part:
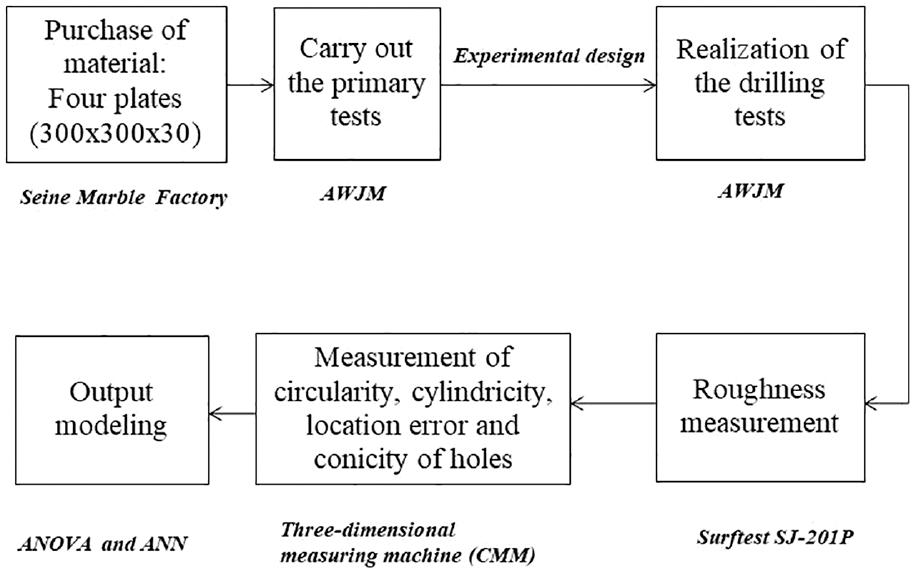
Flowchart of experimental part.
The standardized defects considered in this work to assess hole quality are: hole roughness for three depths of plate thickness (Ra1, Ra2, Ra3), hole cylindricity (HCy), hole circularity (HCi), hole localization error (HLE), and hole taper (HT) as a function of the cutting conditions (P, SOD, TS, AFR, and D). Figure 2 shows the inputs and outputs of the abrasive waterjet machine employed.

The drilling process parameters.
The following part describes the Carrara marble and its physical-mechanical properties, the drilling conditions of the marble slabs, the measurements of key performance indicators (KPI), and the interpretation of the relationships between the cutting conditions and the quality of the holes, based on a statistical model and artificial intelligence models.
Materials and methods
Figure 3 was produced by an Environmental Scanning Electron Microscope at the National Center for Research in Material Sciences in Tunisia (CNRSM), showing that the working marble is heterogeneous, containing grain widths of different sizes and impurities such as voids and microcracks.

White Carrara marble microstructure with Scanning Electron Microscopy (SEM).
This marble is from the marble factory of the Seine in France, whose physical-mechanical properties are given by the same company (Table 2). Note that the white Carrara marble has a high resistance.
Physicalmechanical properties of white Carrara marble (Seine Marble industries).

Two marble specimens with dimensions of 300 mm length, 300 mm width, and 30 mm thickness were drilled by an abrasive water jet machine. Figure 4 shows the abrasive water jet machine installed in the mechanical manufacturing workshop of a mechanical engineering school (ISAE-SUPMECA).

PTV-CNC machines for high pressure waterjet cutting.
Despite the fact that the garnet type and jet diameter influence marble cutting quality, the drilling tests were performed with the same type of abrasive and the same nozzle available in the workshop, hence the constant parameters of this drilling process are listed in Table 3.
Constant parameters.

Primary tests were performed to determine the range of variation of the cutting conditions (Pressure, Standoff distance, Abrasive flow rate, hole Diameter, and Advance speed) of the white Carrara marble specimens, as shown in Figure 5. Firstly, the minimum and maximum pressures are able to completely drill the marble, so the pressure (P) is varied between 2000 and 4000 bar. Secondly, the standoff distance, a trial of 20 and 10 mm, causes the undesirable removal of material where the drilled hole is much larger than the required diameter and there is a large error in the hole location, as shown in Figure 5.

Primary tests of stand-off distance variation.
On the other hand, Engin et al. 19 considered that 5 mm was the optimal stand-off distance value for the abrasive waterjet machine and this is justified, since a gap distance less than 5 mm increases the cutting depth but may also damage the nozzle and the rock sample due to back pressure or obstruction. Therefore, two standoff-distances (SOD) were selected: 5 and 7 mm. Thirdly, the transverse speed set, within the range of 400 and 350 mm/min, does not completely cut the marble. Indeed, these speeds are fast and the jet does not have enough time to perforate the material. For traverse speeds lower than 300 mm/min, the cut is achieved for all the thicknesses and thus the selected traverse speeds (TS) were 300 and 240 mm/min. Fourthly, the hole diameters (D) were chosen at 20 and 15 mm in order to compare the quality of drillings of the same dimensions performed by Abbassi et al. 7 on Carrara marble using conventional machines.
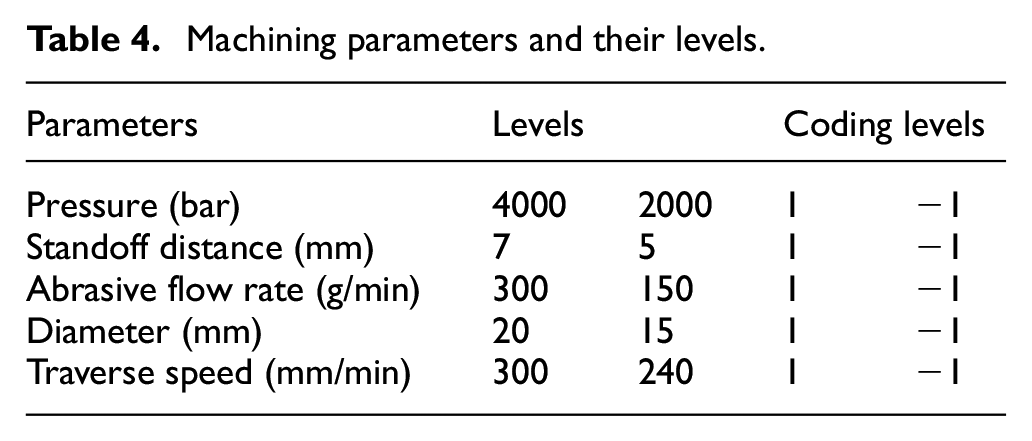
Finally, the abrasive flow rate was set at 150 g/min to ensure cutting the material, hence the abrasive flow rate (AFR) values chosen were 150 and 300 g/min to prevent the Focal Canon from being clogged above this value. Table 4 summarizes all the selected machining parameter ranges and their coding levels.
Machining parameters and their levels.
Design of experiments
The experimental study included five machining inputs, namely P (jet pressure), SOD (standoff distance), TS (traverse speed), AFR (abrasive flow rate), and D (hole diameter). Each input has two different levels that were selected based on primary tests in AWJM and they are divided into constant and variable parameters. The constant parameters are abrasive type, abrasive size, orifice diameter, focusing tube diameter, and length, as shown in Table 3, and the variable parameters are P, SOD, TS, AFR, and D with two levels were taken for each parameter, as shown in Table 4. The order of drilling holes was fixed by fractional replicated factorial design of fraction 1/2. Sixteen runs for each marble sample were carried out as shown in Table 5 and a total of 32 tests were performed.
Fractional replicated factorial design of fraction 1/2.

Drilled plate holes are numbered as shown in Figure 6, to facilitate the measurement step of the key performance indicators given in Table 5.
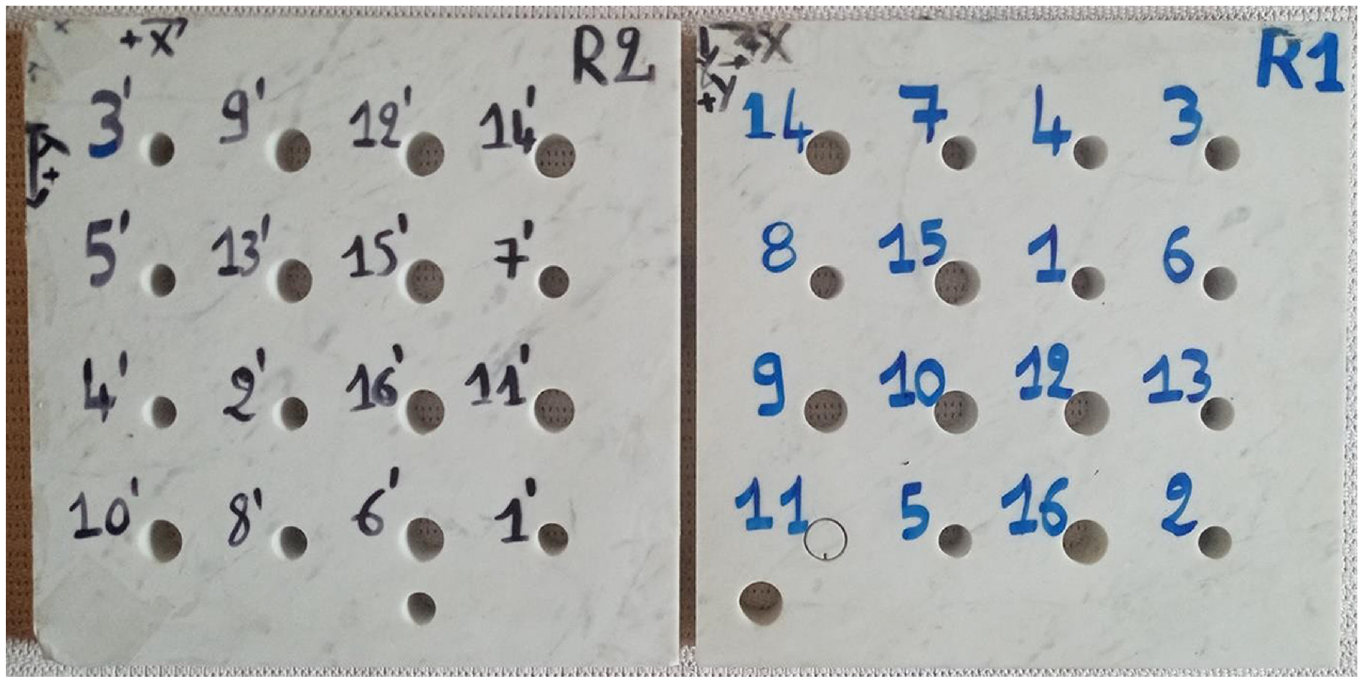
Drilled plates (R1: replication 1, R2: replication 2).
Drilling performance assessment
Carrara marble hole quality depends on the values of the key performance indicators which are measured with the following devices:
A Surftest SJ-201P roughness tester (portable surface roughness tester) shown in Figure 7 is used to check the machining quality by measuring the arithmetic mean of the roughness profile (Ra in μm). After calibrating the device, surface roughness is measured by moving the stylus across the surface through a transducer that converts the movement into a digitally transformed signal. Some drilling tests show striations on the bottom of the holes. In order to measure the roughness of all the holes, the maximum depth was chosen as 21 mm which was divided into three successive zones of 7 mm depth. At each height, the roughness is measured at four different points which form the angles (0, π/2, π, 3*π/2) from the center of the hole and then the average value is taken. For each hole Ra1, Ra2, and Ra3 correspond to the three successive depths respectively (0–7/7–14 and 14/21 mm).
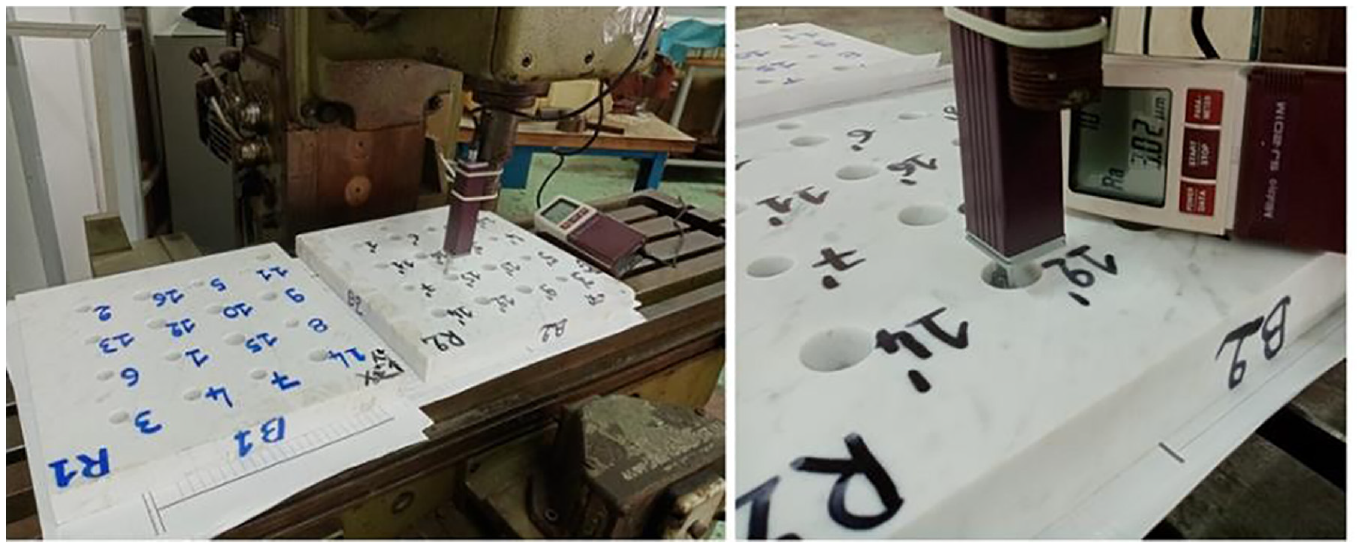
Roughness measure with a Surftest SJ-201P roughness tester.
The measurements of hole cylindricity, hole circularity and hole localization error are determined using a three-dimensional measuring machine (CMM) as shown in Figure 8.

Three-dimensional measuring machine (CMM) (5-axis CMM; Brown & Sharpe Global Status 9128 5PDEA CMM).
All the measurements are shown in Table 5 constituting the fractional factorial design of fraction 1/2.
Results and discussion
This section focuses on the exploitation of the experimental data obtained from the proposed 25−1design of experiment. A linear regression analysis was proposed for the prediction of each key performance indicator, whether the model was effectively linear according to the cutting conditions, and the model retained. Otherwise, a more general and non-linear model using artificial neural networks was applied.
Estimation of outputs by regression analysis
The quality of drilling Carrara marble by abrasive water jet was controlled by performance indicators, namely the geometric and dimensional tolerances of the hole. According to Tosun and Özler 32 and Çaydaş and Hasçalık, 33 the regression analysis method includes the experimental investigations, mathematical methods, and statistical analysis. In the current investigation, a complete analysis was carried out using experimental data and a multiple regression analysis was performed to predict the key indicators performance using MINITAB 19 software. Data from the fractional design of experiment presented in Table 5 were considered for this regression analysis.
As part of the regression analysis, the Analysis of Variance (ANOVA) method was considered to analyze the experimental data. This tool was developed by Sir Ronald Fisher in the 1920s. 34 Alejano et al. 35 defined ANOVA as a particular form of statistical hypothesis testing used to analyze experimental data. They considered that a statistically significant result is when a probability (p-value) is below a specific threshold making it possible to reject a null hypothesis. This case can be linked to all sets of results randomly sampled from the same population. Kanlayasiri et al. 36 assumed that interpreting the results only from the p-values of the ANOVA table without carefully checking its assumptions is very uncertain and unreliable, often leading to misleading results. Thus, it is highly recommended to examine residuals for normality, independence, and constant variance when using ANOVA. This approach has been retained in this paper.
The ANOVA diagrams of the residual values present four graphs:
Henry’s line of residual values (used to test the assumption that residual values are normally distributed);
the residuals versus fitted values (used to test the hypothesis if the residuals have a constant variance);
the histogram of residuals (determines whether the data are symmetrical or contain outliers);
the residual values versus data order (used to test if the residual values are correlated with each other).
For each output considered in this work, when running a regression analysis, the variance of the error terms must be constant and they must have a mean of 0. Otherwise, the model may not be valid. 37
Influence of process parameters on surface roughness
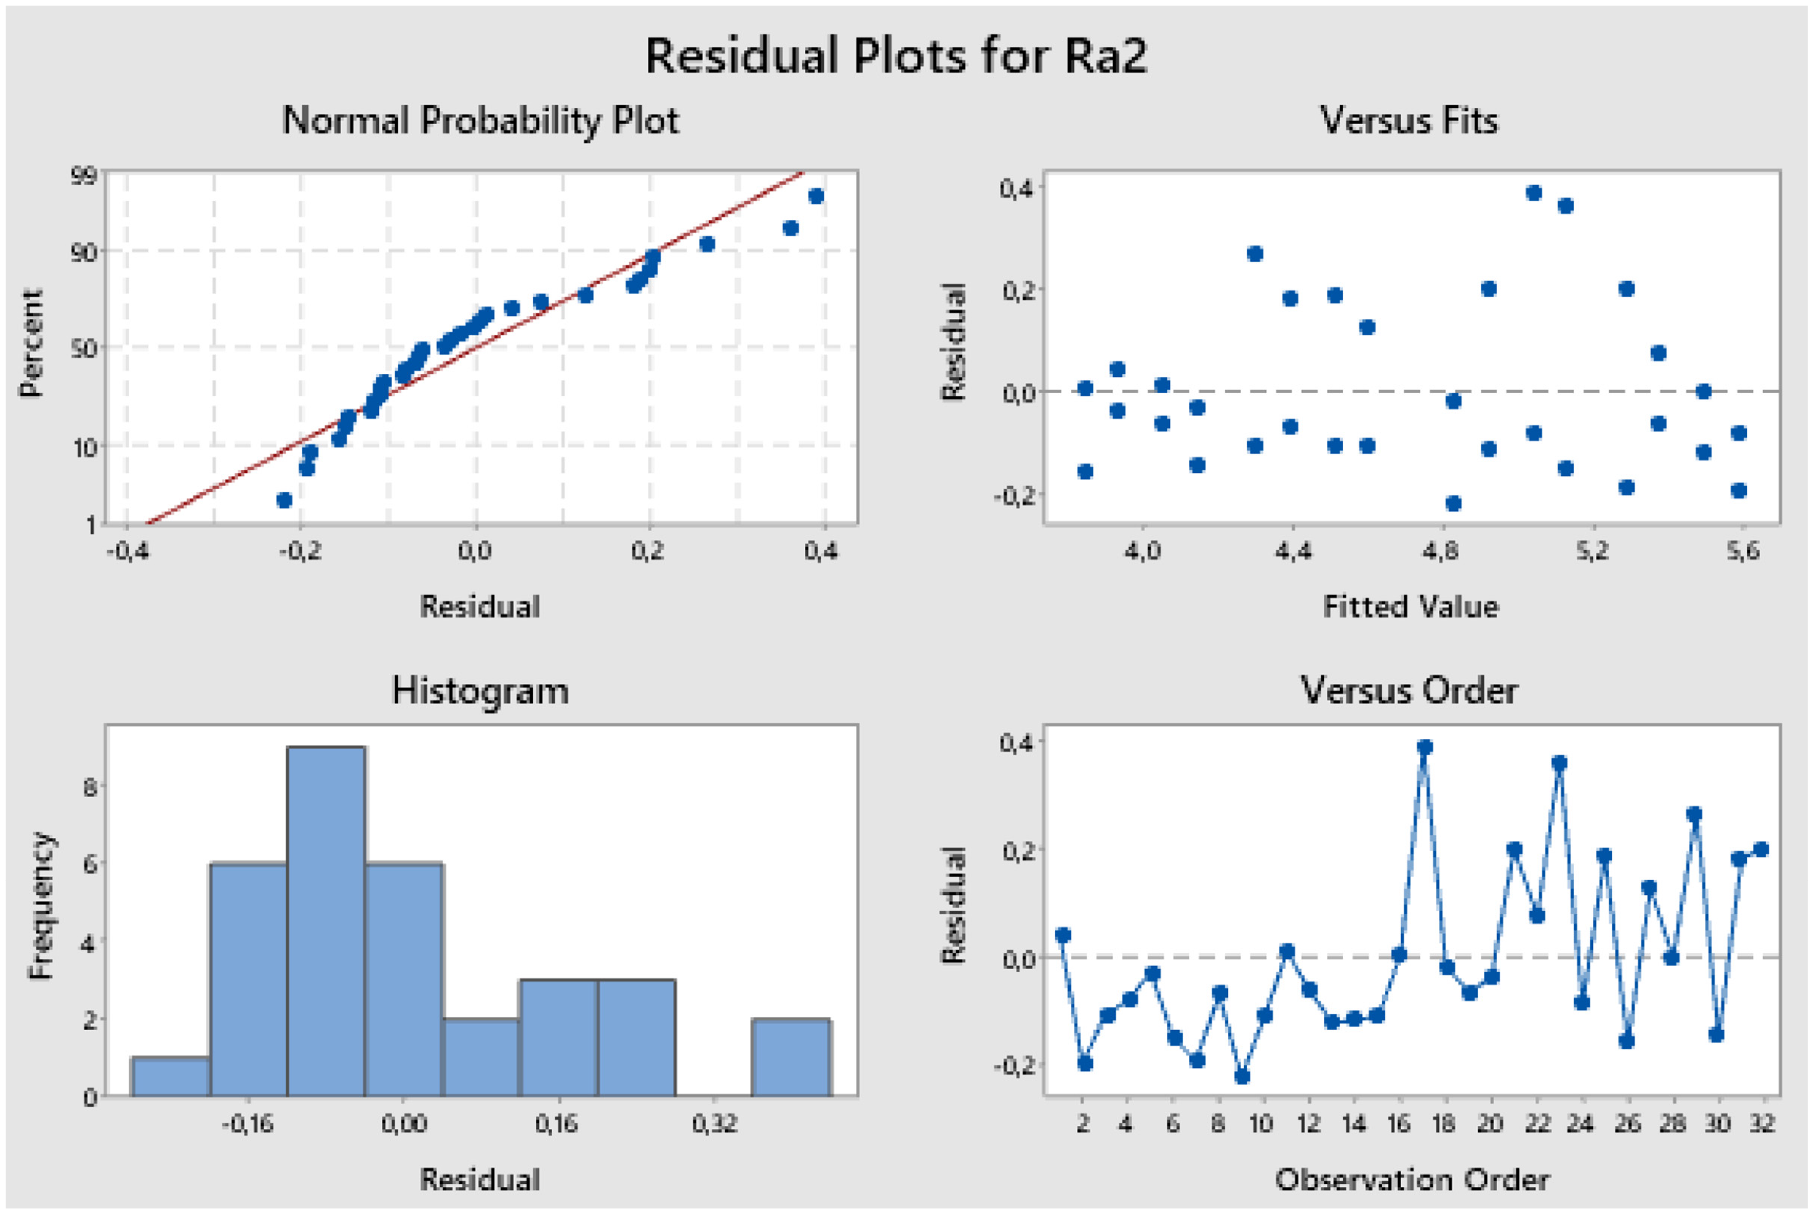
The aim of this part is to find a regression model between the roughness of the holes and the cutting conditions of the abrasive waterjet. This subsection presents the results of the ANOVA on surface roughness Ra1, Ra2, and Ra3. Table 6 contains the four residual plots, the ANOVA results of Ra1 and the regression model (equation (1)) of Ra1 as a function of the cutting condition.

Similarly, Tables 8 and 9 describe regression models for the two KPI Ra2 and Ra3 respectively.


Regression model for Ra1.


From the results in Tables 6–8, it can be seen that the normal probability plots for Ra1, Ra2, and Ra3 are linear and the variances of the versus fits are constant. The vertical width of the dispersion does not seem to increase or decrease for the adjusted values, for Ra1 it varies between 0.1 and −0.1, for Ra2 it changes between 0.2 and −0.2, and for Ra3 it ranges between 0.4 and −0.4. Thus, the variance of the error terms is therefore constant for Ra1, Ra2, and Ra3 and the error residuals have an average of 0. Therefore, the model performances values [
Regression model for Ra2.

Regression model for Ra3.


Abdullah et al. 20 studied white Carrara and green Indian marble and noticed that the increase of SOD induces jet divergence at the exit of the nozzle near the impact region, leading to an increase of the jet diameter and a reduction of the kinetic energy of the jet in this region, causing higher surface roughness of the hole. This confirms the relationship between the roughness and standoff distance concluded in the present work. The effect of the nozzle feed speed on the roughness of the holes was also observed in this work. It was seen that if parameters P, D, SOD, and AFR were fixed and the traverse speed increased, the speed varied from 240 to 300 mm/min in this study, with increased machined surface roughness. Abdullah et al. 20 confirmed this observation on two types of marble (white Carrara and green Indian marble).
Thus, by comparing the roughness provided by the abrasive water jet and by the rotating tools, we noticed that the surface roughness of the holes drilled in white Carrara marble with the abrasive water jet did not exceed 6 µm while the roughness of similar holes (same dimensions) drilled with conventional tools reached 11 µm7. Regardless of the choice of input parameters, the AWJ left a smoother surface in the drilled holes than rotary tools. Therefore, to minimize the roughness of the hole, the material must be cut at high pressure, a safe and minimal standoff distance, and with an adequate and minimal traverse speed.
More practical observations were obtained from the roughness of the marble holes made by the abrasive water jet which explained the differences between the roughness values on the vertical and radial axis of the hole. First, it was noticed that the roughness of the hole inner surface varied depending on the angular position. Figure 9 illustrates the angular distribution of the roughness of a typical holes drilled with abrasive water jet. This dependence was justified by the speed of travel which is involved in the roughness of the machined surface and related to the exposure time of the jet on the marble. Thus, at high speed, the exposure time was shorter and the surface was rougher. Therefore, the jet started from the center of the hole toward the outside, passing first through points P1, P2, P3, and finally P4. The velocity of the jet at the beginning and at the end of the trajectory was slower than the average velocity set and therefore the roughness in the zones (P1 toward P2) and (P4 toward P1) was lower than the remainder of the hole.

Radial roughness variation for hole samples.
The second note illustrated in Table 9 of a typical slug obtained after drilling a hole in a plate of marble with an abrasive water jet. The roughness varies in drilling depth in three different zones. It can be seen that the zone 2 was smoother than zone 1 and zone 1 was smoother than zone 3.
Roughness evolution according to the depth (zone1 = Z1, zone2 = Z2, zone3 = Z3).
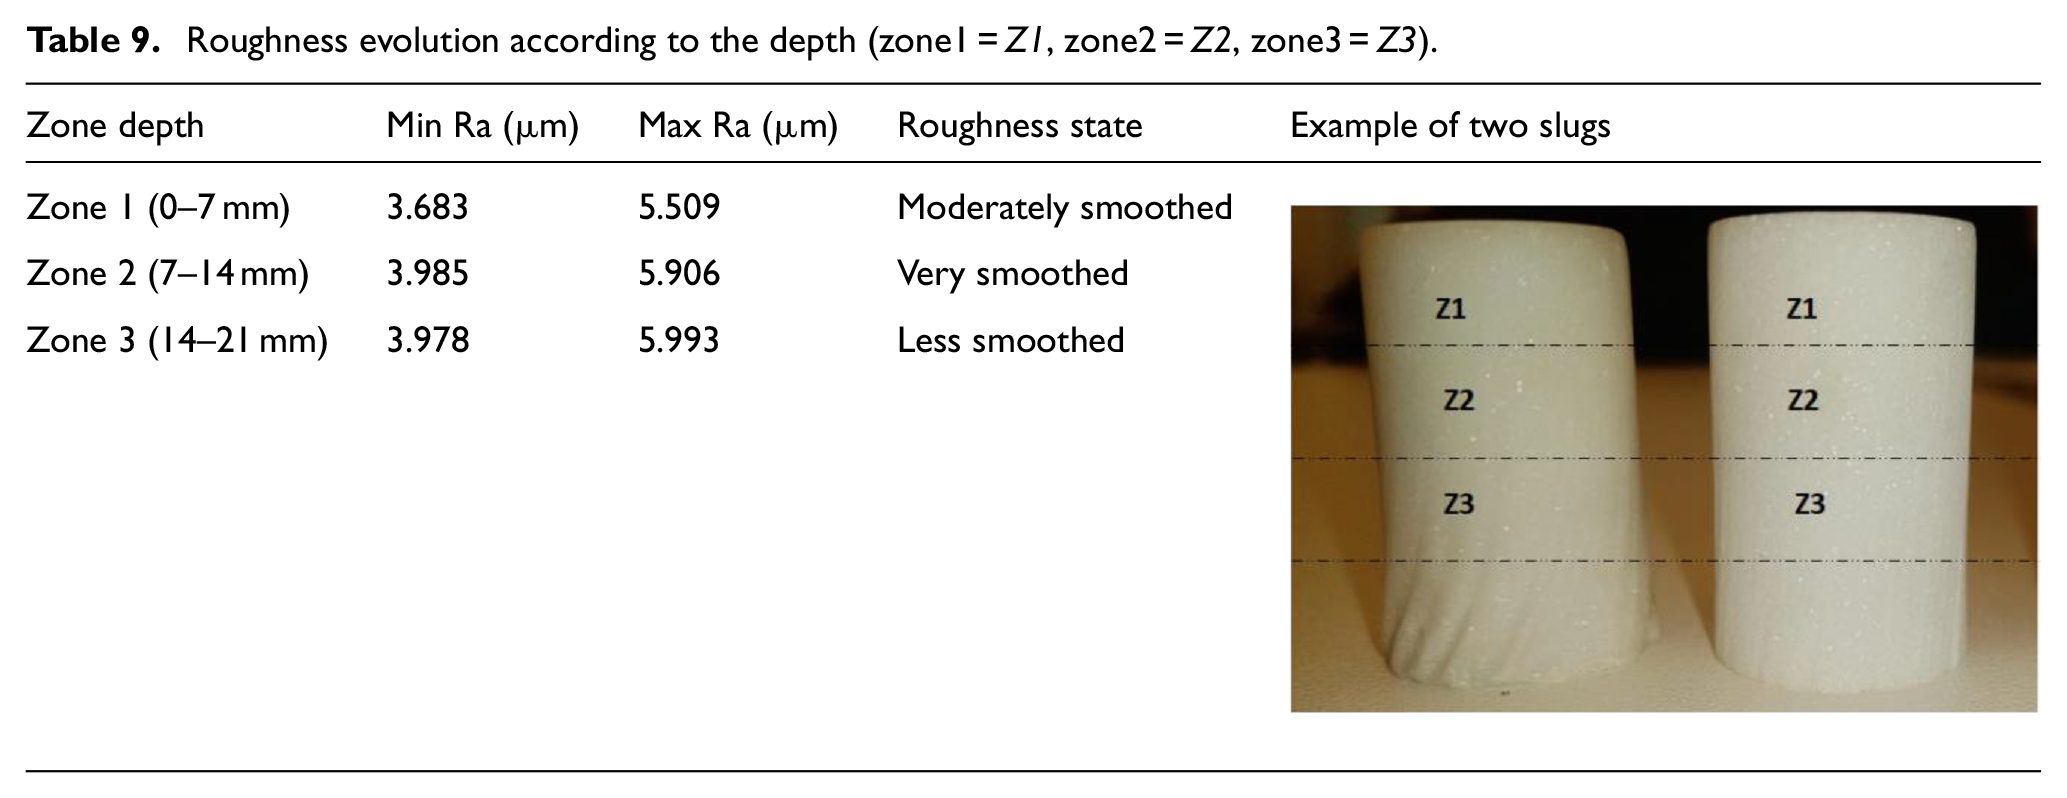
This phenomenon can be explained by the loss of energy of the jet according to the material depth. The minor difference between the roughness of zone 2 and 1 is because zone 1 was the first contact between the jet and the material so it caused more disturbance to the material than to the full material (zone 2). Then, zone 3 shows the beginning of the striations in the material due to the divergence of the jet is more irregular than zones 2 and 1. In the same way, Çaydaş and Hasçalık 33 concluded that a typical AWJ machined surface of AA 7075 aluminum has three distinct zones along the kerf wall, that is an initial damage region (IDR), a smooth cutting region (SCR), and a rough cutting region (RCR) from the jet entry to the exit of the workpiece. The IDR is the shallow dark wear track created by shallow angles of attack. The SCR exists between IDR and RCR with a small area, formed by a large angle of attack. The surface roughness worsens through the RCR because of the upward deflection of the jet. In the RCR, the surfaces generally exhibit striations or wavy characteristics. In addition, Charles 38 explained that the presence of these three zones shows that the AWJ loses its erosive energy as it penetrates the workpiece during cutting on ceramics, rocks, marble, diamonds, and metals. 38
Influence of process parameters on hole circularity, hole cylindricity, and hole localization error
This subsection focuses on the KPI associated with hole circularity HCi, HCy, and HLE. The four-in-one plot of the residuals against the fitted values given in Table 10 indicates that the assumption of constant variation of the HCi, HCy, and HLE outputs is not satisfied. A natural log transformation of the response is therefore applied on these outputs. Likewise, the four-in-one plot of the residuals as a function of the fitted values of the transformed response does not validate a variance of the constant error terms of the residuals and the stability of the variance. Linear regression models are therefore not adapted to modeling HCi, HCy, and HLE as a function of machining parameters. Non- linear regression models are therefore necessary. Moreover, ANN-based models are investigated in Section 3-2.
Four-in-one plot of the residuals as a function of the fitted values for HCi, HCy, and HLE.

Influence of process parameters on hole taper
Finally, the Kerf angle is investigated. Table 11 presents the residual plots, the model performances and the model equation.

ANOVA of HT.


From the results in Table 11, it can be seen that the vertical width of the dispersion does not seem to increase or decrease for the adjusted values for HT, and the HT values vary between 0.2 and −0.2. Thus, the variance in the error terms is constant and the error terms have a mean of 0. The model performance values [
Figure 10 illustrates the variation of HT as a function of the two most dependent parameters P and SOD. The minimum conicity is obtained for a maximum pressure of 4000 bar and a minimum SOD of 5 mm and is in the region of −0.089° (Figure 10(b)). This means that the hole does not present striations and is completely cylindrical. If at this pressure, the SOD increases from 5 to 7 mm, (Figure 10(d)), the slug starts to widen and the conicity of the hole reaches an approximate null angle. But if the drilling is done at minimum pressure, conicity is more noticeable and the drilling is therefore defective (Figure 10(a) and (c)).
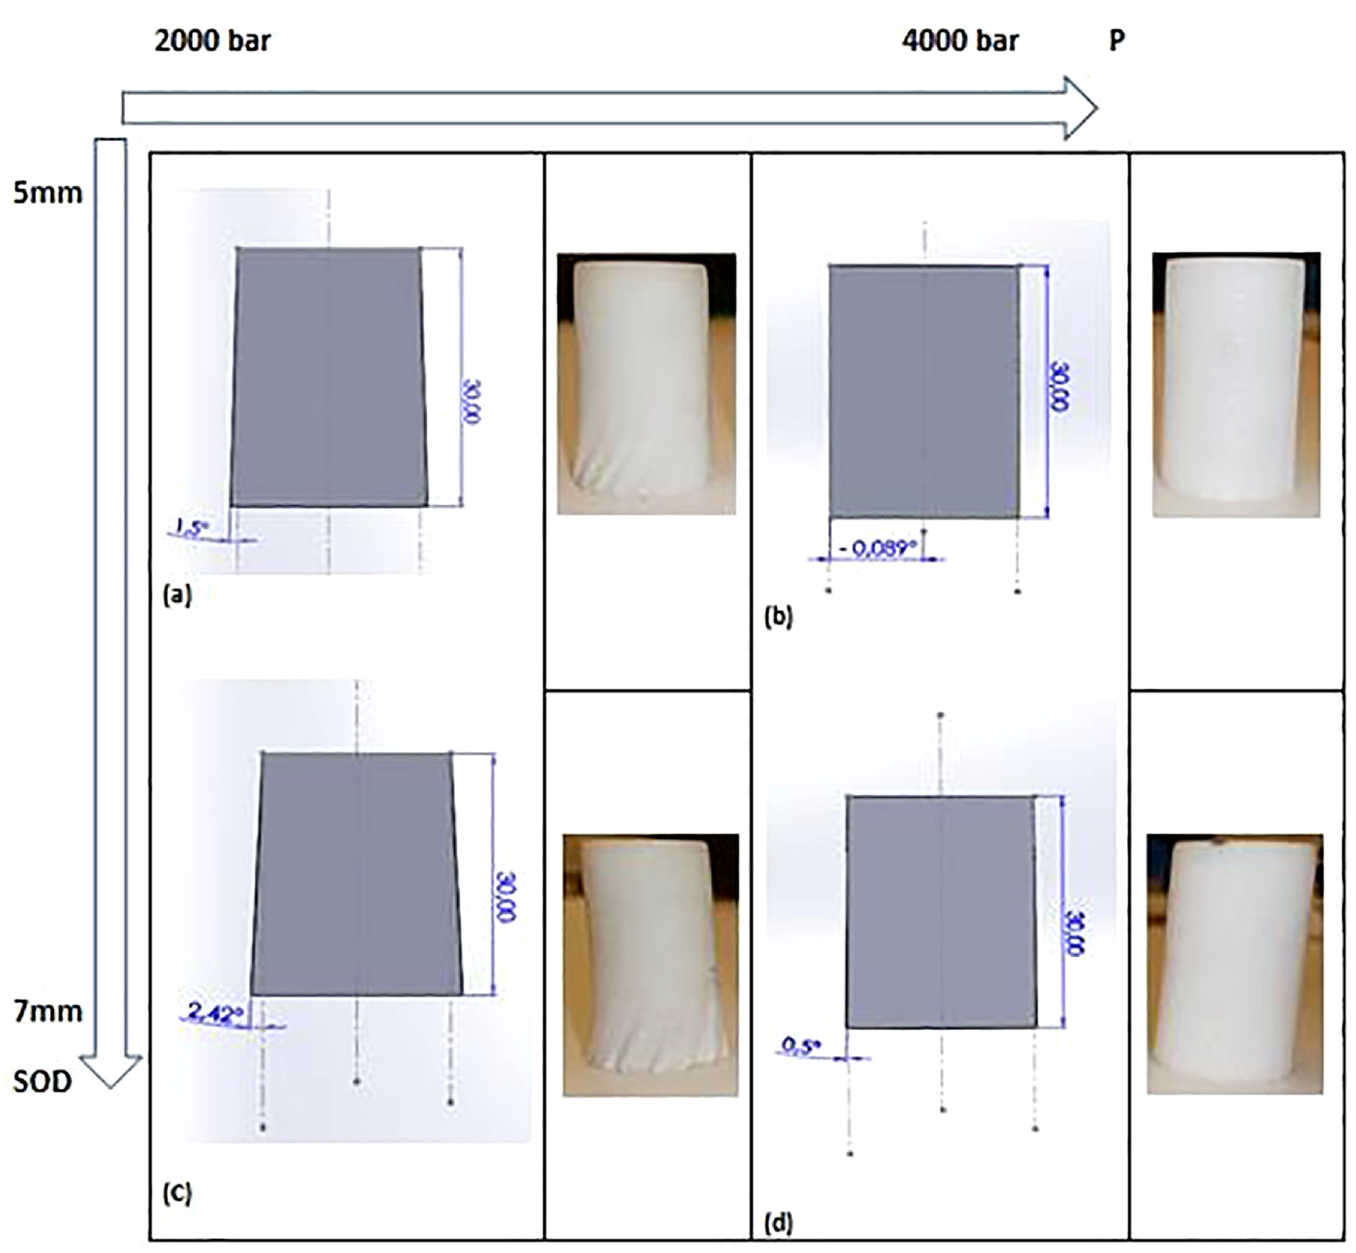
Critical taper values in degrees as a function of the pressure and the stand-off distance: (a) HT(P = 2000 bar, SOD = 5 mm), (b) HT(P = 4000 bar, SOD = 5 mm), (c) HT(P = 2000 bar, SOD = 7 mm) and (d) HT(P = 4000 bar, SOD = 7 mm).
The regression models predicted the hole taper with high accuracy and proved that this parameter depends more strongly on pressure than on traverse speed and stand-off distance.
As a preliminary synthesis on hole taper, it can be concluded that this output depends strongly on pressure, about 85%, and the stand-off distance, about 11.4% approximately. Pawar et al. 17 drilled marble samples 18 mm thick and noticed that for pressures lower than 2420 bar (1380 and 1900 bar), striations appeared on all holes at different depths from the free surface varying between 3.2 and 15.10 mm. This confirms our conclusions on the major effect of pressure on the occurrence of striations and the increase of hole taper. Abdullah et al. asserted that the Kerf taper ratio increases with SOD during marble cutting. This may be related to the increase of the jet divergence induced by energy loss and loss of jet momentum during cutting when SOD increases. 20 The work of Abdullah et al. confirmed the evolution of the Kerf angle observed in this paper. Therefore, to minimize hole taper, the material must be cut at high pressure with a minimal but safe standoff distance.
This part highlighted that simple linear regression models are not adapted to model HCi, HCy, and HLE as a function of drilling parameters. Therefore, the next section proposes another regression model for predicting these KPI.
Estimation of HCi, HCy, and HLE using ANN
The neurologists Warren McCulloch and Walter Pitts 39 invented the formal neuron at the end of the 1950. Sarkar et al. 40 defined ANN as a highly flexible modeling tool with the ability to learn the mapping between input and output. ANN was used to model the non-linear input-output relationships of the drilling process. Abbassi et al.7,41 used neuronal approaches to predict surface roughness and geometric defects (circularity, cylindricity, and localization) and assess the cylindricity and roughness tolerances of holes drilled in Carrara-Calacatta marble with a diamond cutting bit. Akıncıoğlu et al. 42 used an artificial neural network (ANN) for modeling surface and hole quality in the drilling of AISI D2 cold work tool steel with uncoated titanium nitride (TiN) and titanium aluminum nitride (TiAlN) monolayer- and TiAlN/TiN multilayer-coated-cemented carbide drills.
This section focuses on ANN models used to predict hole performance indicators HCi, HCy, and HLE as function of the cutting conditions of the abrasive water jet machine. The Neural Network Toolbox of the MATLAB software presents several ANN models. In this work, a Multi- Layer Perception MLP network with back propagation was used due to its adaptability to many engineering problems.7,43
A 5-NN-1 ANN architecture (5 inputs and 1 output) was considered and one model trained for each KPI (cylindricity, circularity, and localization error). The 5-NN-1 architecture is presented on Figure 11. The NN constitutes the number of neurons in the hidden layer. Different sizes of hidden layer were tested, from 2 to 20 hidden neurons. The optimal number of hidden neurons was chosen to minimize a Root Mean Square Error (RMSE) and maximize a coefficient of determination (R-sq) defined in equations (5) and (6) respectively.


k is the total number of measurements.
Yi is the measured value.
y^ is the predicted value.
y’ is the average of the measured values
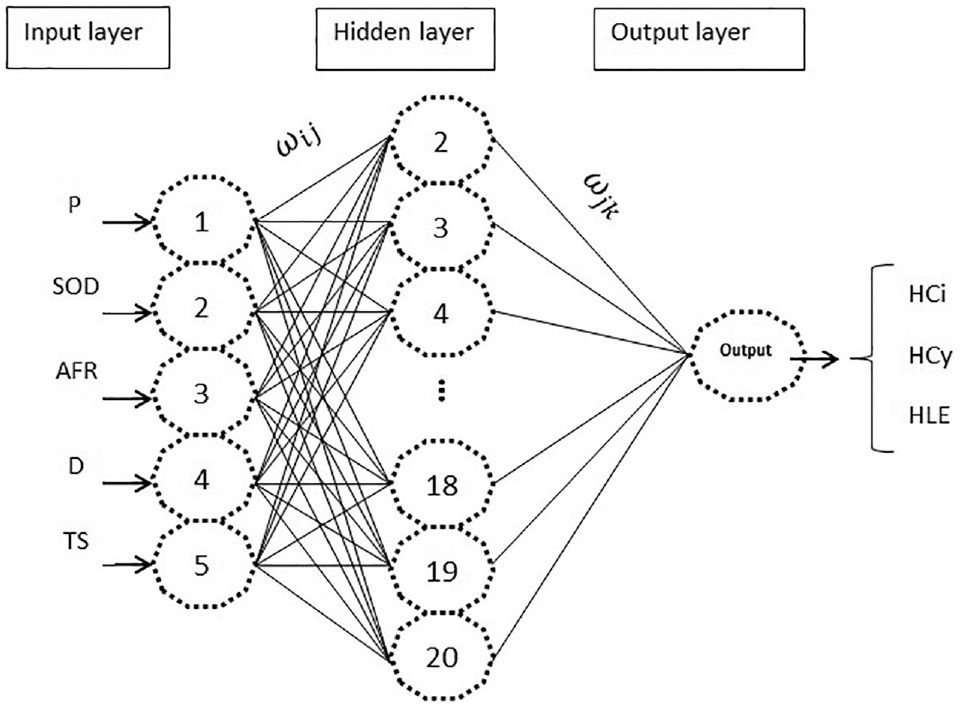
The 5-NN-1 ANN architecture.
The ANN model is efficient if the (RMSE) tends to 0 and the coefficient of determination (R-Sq) tends to 1. R-Sq measures the magnitude of variability modeled by the artificial neural network in the desired output, and MSE calculates the difference between the target values and the real values. Taghavifar and Mardani 44 took R-Sq as the first criterion and the root mean squared error (RMSE) as the second criteria to assess the performance of each trained algorithm. This method is applied in this study in the same way.
The five nodes in the input layer represent the five decision values, namely P, SOD, AFR, D, and TS. One node for the output layer stands for the predicted values of HCi, HCy, and HLE. For the number of hidden layers, Sarkar et al., 40 confirmed that the back-propagation architecture with one hidden layer is enough for the majority of machining applications. The network is trained using the Levenberg- Marquardt algorithm. The input and output layers were triggered using sigmoid and linear activation functions, respectively. The data set was split into three separate parts for learning, test, and validation purposes. Twenty-two out of 32 samples were used for training, accounting for 70% of the total data set, five samples for validation, accounting for 15% of the total data set, and five datasets for testing, accounting for 15% of the total data set.
Multilayer feedforward ANN for Hci, Hcy, and HLE
The number of neurons in the hidden layer of the multilayer feedforward ANN structure 5-NN-1 changed for 2–20 and the optimum Number of Neurons NN was selected according to the RMSE and R-sq indices. Table 12 shows the best feed forward ANN architecture selected for HCi, HCy, and HLE.
Estimation of the optimum number of hidden neurons NN according the model performances.

The 5-6-1 ANN model is the optimal structure for HCi with an accuracy of 98.91%. Then, the 5-20-1 ANN model is the optimal structure for HCy with an accuracy of 97.89% and finally the 5-4-1 ANN model is the optimal structure for HLE with an accuracy of 98.91%. The ANN model overcame the failure of linear regression models to find the relationship between HCi, HCy, and HLE and the drilling parameters with an accuracy greater than 97.9%. In the Appendix, Table 13 presents the real and predicted values for HCi, HCy, and HLE.
The high accuracy of the different ANN models proves the high correlation between the real output values and the ANN predicted values. Based on this high correlation, Figures 12–14 show the dependency of the real outputs HCi, HCy, and HLE on the drilling input process (P, SOD, AFR, D, TS):

Variation of hole circularity as a function of outputs: (a) variation of HCi in function of (P, SOD), (b) variation of HCi in function of (D, TS) and (c) variation of HCi in function of (P, AFR).

Variation of hole cylindricity as a function of outputs: (a) variation of HCy in function of (P, SOD), (b) variation of HCy in function of (D, TS) and (c) variation of HCy in function of (P, AFR).

Variation of hole localization error as a function of outputs: (a) variation of HLE in function of (P, SOD), (b) variation of HLE in function of (D, TS) and (c) variation of HLE in function of (P, AFR).
Figure 12(a) shows that when P increases from 2000 to 4000 bar, HCi decreases remarkably while when SOD passes from the min value to the maximum value, there is no significant variation in the HCi values. Figure 12(b) shows that when TS increases from 240 to 300 mm/min, HCi increase significantly but D has no effect on this output. Figure 12(c) illustrates that AFR has minimal effect on HCi.
Figure 13 illustrates that HCy was impacted only by P and TS but AFR, SOD, D have negligible effect. HCy was minimal at high pressure and low traverse speed.
Figure 14 displays that HLE was affected only by P and TS but AFR, SOD, D have negligible effect. HLE was minor at high pressure and low traverse speed.
At a high pressure of 4000 bar, HCi, HCy, and HLE are minimal because the jet is focused. Then, TS decreases slightly, HCi, HCy, and HLE decrease, which can be explained by the decrease of energy of the jet at 240 mm/min and consequently the amount of material removed on first contact jet-material decreases.
In the light of these observations, it can be concluded that pressure is the main factor influencing HCi, HCi, and HLE, followed by the traverse speed. The minimization of the geometrical tolerances required a maximum abrasive pressure and a required and minimal traverse speed.
It can be concluded that both the ANN and Multiple linear regression provide accurate models to predict abrasive water jet drilling performances on white Carrara marble. Linear regression models and ANN models can both be trained quickly and provide accurate prediction with negligible computation time (in comparison with high resolution machining simulations). Linear regression models have the advantage of providing an explicit mathematical model of the output as a function of inputs, thereby making them particularly interesting for stonemasons to configure abrasive water jet machines according to specific hole tolerances. ANN models, on the other hand, remain black- box models. Nevertheless, ANN models have the advantage of solving complex models of higher order, making it possible to model complex relationships between water jet machining parameters and hole cylindricity, circularity and localization errors.
Conclusions
An analysis of the white Carrara marble drilling process with abrasive water jet was carried out. The influences of the abrasive waterjet characteristics on the geometric and dimensional tolerances of holes (circularity, cylindricity, location error, roughness, and taper angle) were studied. Regression models based on linear regression and Artificial Neural Networks were proposed to easily and accurately predict hole tolerances as a function of water jet machining parameters. These models can be used by marble workers to define the cutting parameters of white Carrara marble plates in order to reach tolerances imposed by customer requirements. These accurate and computationally efficient models may also be used in an optimization process in view to finding the optimal machining parameters to minimize one or several machining defects. These models also help understanding the behavior of marble as a brittle material during non-conventional abrasive water jet machining.
The abrasive waterjet applies low mechanical and thermal stress on marble and ensures a smoother marble surface than other drilling tools such as diamond drills, score drills, masonry drills and HSS (high speed steel) drills and it is not necessary to change the drilling tool each time the hole dimensions change. The regression model analysis described the variation of roughness and the taper angle as a function of the abrasive jet cutting conditions with an accuracy higher than 92.46%. This highlighted the mathematical models that link roughness and the Kerf angle to the drilling parameters. It was concluded that pressure is the most decisive parameter at 75% and 85% respectively, and that the maximization of the jet pressure minimizes the roughness and the taper angle. Traverse speed also had an influence on the roughness at 15% and higher speed induced a rougher inner surface of the hole. The stand-off distance also affected the hole taper at 11%, and a slight increase of a few millimeters of the stand-off distance induced a divergence of the jet and an increase of the taper by a few degrees. The hole diameter D and the Abrasive Flow Rate AFR had a negligible effect on all the outputs. The artificial neural network models predicted the hole circularity, hole cylindricity, and hole localization error with high accuracy, at 98.91%, 97.89%, and 99.72% respectively. This work highlighted that drilling with a high pressure of 4000 bar, with a medium traverse speed capable of penetrating the whole material and with a minimal (but safe) stand-off distance ensures local drilling without the occurrence of striations. This high drilling quality allows avoiding finishing operations. Regarding the perspectives of this work, for the same experimental design, other input parameters such as plate thickness and marble damage state could be integrated to generalize the study of drilling quality. Pattern recognition studies have been started to detect cracks and brittle spots in marble using image and signal processing tools so that the position and type of defect detected will be an additional input parameter in the abrasive waterjet machine reconfiguration system.
Footnotes
Appendix
Predicted values of HCi, HCy, and HLE.

| Output | HCi | HCi predicted | HCy | HCy predicted | HLE | HLE predicted |
|---|---|---|---|---|---|---|
| 1 | 0.064 | 0.063 | 0.044 | 0.044 | 0.108 | 0.108 |
| 2 | 0.126 | 0.124 | 0.141 | 0.137 | 0.412 | 0.413 |
| 3 | 0.017 | 0.016 | 0.012 | 0.012 | 0.041 | 0.041 |
| 4 | 0.107 | 0.105 | 0.053 | 0.088 | 0.244 | 0.248 |
| 5 | 0.036 | 0.032 | 0.037 | 0.037 | 0.070 | 0.074 |
| 6 | 0.139 | 0.138 | 0.133 | 0.130 | 0.393 | 0.403 |
| 7 | 0.132 | 0.115 | 0.171 | 0.169 | 0.454 | 0.454 |
| 8 | 0.065 | 0.068 | 0.044 | 0.044 | 0.119 | 0.119 |
| 9 | 0.128 | 0.125 | 0.155 | 0.019 | 0.430 | 0.438 |
| 10 | 0.046 | 0.045 | 0.043 | 0.043 | 0.099 | 0.098 |
| 11 | 0.015 | 0.015 | 0.012 | 0.012 | 0.041 | 0.027 |
| 12 | 0.149 | 0.224 | 0.187 | 0.188 | 0.515 | 0.517 |
| 13 | 0.114 | 0.115 | 0.132 | 0.123 | 0.311 | 0.252 |
| 14 | 0.133 | 0.132 | 0.175 | 0.175 | 0.459 | 0.459 |
| 15 | 0.037 | 0.035 | 0.042 | 0.042 | 0.084 | 0.087 |
| 16 | 0.042 | 0.026 | 0.043 | 0.043 | 0.087 | 0.623 |
| 17 | 0.101 | 0.105 | 0.122 | 0.088 | 0.251 | 0.248 |
| 18 | 0.121 | 0.125 | 0.156 | 0.019 | 0.447 | 0.438 |
| 19 | 0.014 | 0.015 | 0.012 | 0.012 | 0.027 | 0.027 |
| 20 | 0.065 | 0.063 | 0.043 | 0.044 | 0.103 | 0.108 |
| 21 | 0.134 | 0.132 | 0.177 | 0.175 | 0.472 | 0.459 |
| 22 | 0.137 | 0.224 | 0.189 | 0.188 | 0.517 | 0.517 |
| 23 | 0.117 | 0.138 | 0.127 | 0.130 | 0.412 | 0.403 |
| 24 | 0.120 | 0.124 | 0.133 | 0.137 | 0.414 | 0.413 |
| 25 | 0.015 | 0.016 | 0.012 | 0.012 | 0.059 | 0.041 |
| 26 | 0.044 | 0.026 | 0.043 | 0.043 | 0.092 | 0.623 |
| 27 | 0.035 | 0.035 | 0.043 | 0.042 | 0.087 | 0.087 |
| 28 | 0.104 | 0.115 | 0.123 | 0.123 | 0.252 | 0.252 |
| 29 | 0.045 | 0.045 | 0.043 | 0.043 | 0.096 | 0.098 |
| 30 | 0.032 | 0.032 | 0.034 | 0.037 | 0.077 | 0.074 |
| 31 | 0.068 | 0.068 | 0.044 | 0.044 | 0.119 | 0.119 |
| 32 | 0.115 | 0.115 | 0.166 | 0.169 | 0.458 | 0.454 |
Acknowledgements
We thank the laboratories LMPE and QUARTZ VAST, and the PHC Utique 19G1127 project for the funding given and their reactivity in this research. We also thank the Sousse training center its effort and the knowledge shared in order to make this work successful.
Handling Editor: Chenhui Liang
Declaration of conflicting interests
The author(s) declared no potential conflicts of interest with respect to the research, authorship, and/or publication of this article.
Funding
The author(s) received no financial support for the research, authorship, and/or publication of this article.