
Abstract
Five series of specimens with two different print orientations (−45/45 and 0/90) and two print layer thicknesses (0.1 and 0.2 mm) were made. In total 60 specimens with 100% filament infill were made. One specimen series (20 pieces) was isolated as a reference or thermally untreated. Before the thermal treatment (annealing), two specimen moulding methods were used: NaCl powder (granulation 63 mm: 20 pieces) and Calcium Sulphate (Gypsum: 20 pieces). During the annealing, specimens immersed in NaCl powder were heated in a drying oven to the filament melting point (for PLA: 200°C, with a duration interval of 30 min), while the treatment of the heated specimens in gypsum was performed at a temperature of around 190°C, with duration interval of 3 h with the observed temperature inside the mould of about 100°C. An ultrasonic bath and a drying oven were used in the gypsum treatment. Temperature measurement and control during both annealing treatments were performed using a thermal imaging camera, while the temperature control inside the drying oven was performed using a digital thermometer. After treatment, the specimens in the moulds were cooled at room temperature, and the dimensions of annealing and untreated specimens were controlled. Surface morphology was characterised using scanning electron microscopy (SEM). The SEM analysis reveals improved internal structure after heat treatment of the PLA specimens. These results show that the investigated specimens after heat treatments had better structural properties than the referent specimens. Tensile testing on a universal testing machine in compliance with the ASTM D638 standard was also performed. The referent PLA specimen with −45/45 and layer thickness of 0.1 mm had the highest tensile stress value (64.08 MPa) while the specimen with minimal tensile stress value before fracture was 0/90, 0.2 mm (54.81 MPa). Heat treatment in gypsum showed the most significant increase in strength with −45/45 (0.1 mm) being the strongest (71.66 MPa) while the strongest specimen treated in sodium chloride was −45/45 (0.1 mm) with maximum tensile stress of 70.08 MPa. The mechanical characteristics of the PLA were characterised using the Vickers microhardness tester. The PLA microhardness value was calculated according to standards ASTM E384 and ISO 6507. The referent PLA specimen with −45/45 (0.2 mm) orientation shows the maximal microhardness value (125 MPa), and the minimal microhardness value was observed for the 0/90 (0.1 mm) orientation specimens (108 MPa). The heat treatment specimens in gypsum have a better hardness (185 MPa) than those treated in gypsum (165 MPa), with microhardness increasing by about 12%. The essence of the work is reflected in the additional filament processing to achieve a better structural and mechanical performance of the materials and reduce the anisotropy that is characteristic of 3D printing.
Introduction
Additive manufacturing (AM) enables the rapid realisation of parts and components with complex geometry regarding small series. When it comes to the aerospace industry and the development of complex mechanical-electrical products, AM provides fast production of tools and moulds. 1 Thus, the AM received the most significant industrial certification in the aerospace, automotive and electronics industries, as well as biomedicine.2 The parts are realised according to the digital display of the design model using a computer, without including machining, injection moulding and casting.3 Fused deposition modelling (FDM) is a widely accepted AM technology. FDM technology (or 3D printing technology) has a relatively low market price, low material consumption and is easy to use. 4 FDM provides effortless model realisation, low maintenance costs and affordable production of very complex models in a wide range of materials. 5
The FDM process involves melting the thermoplastic material through a heated nozzle, see Figure 1. The filament is fed from the coil of material to the extruder. The extruder is transported to the guide via a stepper motor. Further, filament moves through the heater and exits through the nozzle as a molten material in a string form, after which it touches the active plate and sticks to it. 6 The extruder is an essential part. It consists of two interconnected parts: (a) the hot part – which contains a nozzle and heater and (b) the cold part or mechanism that cools and drives the hot part of the extruder. A toothed mechanism drives the filament to the extruder.

Extruder and model making.
Finally, the material is cooled and solidified as a printed element. Standard filament diameters of 1.75 and 3 mm are most often used, while nozzle diameter ranges from 0.1 to 1 mm. The heater’s maximum temperature usually reaches 280°C (depending on the type of material). This technology realises a 3D model by depositing molten material ‘layer by layer’ through a nozzle.
Many literature sources compare the mechanical properties of pure PLA and PLA with impurities of other materials that may be in the form of fibres or metal/nanometal tiny particles. In Zhang et al., 7 the authors analysed PLA samples reinforced with aluminium fibres. The results showed that this composite has lower tensile strength and Young’s modulus than the pure PLA sample. The tensile zone at fracture increases in PLA with Al fibres, which have better elasticity. Also, bronze particles 8 harden the PLA filament, and the composite gives a higher surface hardness because it is filled with hard particles.
PLA composite with microcrystalline cellulose (MCC) and silver (Ag) nanoparticles gives good mechanical properties and thermal stability. 9 In this composite, silver nanoparticles provide antimicrobial properties, while MCC reduces the permeability of the polymer. Thermal analysis revealed that MCC increased PLA crystallinity and improved the Modulus of elasticity.
Glass fibre composites (M-GF) 10 significantly improve the mechanical properties and thermal stability of PLA. Microscopic morphological analysis showed a good bond with the PLA matrix, while thermal analysis showed that glass fibres increase the heat removal temperature.
Hasan et al. 11 analysed the effect of thermal treatment (annealing) of Polylactic Acid (PLA) specimens on material ageing. It was found that heat treatment improves the structure strength of printed parts and can slow the degrading effect of material ageing.
Amza et al. 12 investigated the mechanical properties of manufactured specimens of polyethylene terephthalate glycol (PETG) using the fused deposition modelling (FDM) procedure with annealing. The printed specimens were packed with sodium chloride powder (NaCl) mould, and the specimens were thermally treated at a temperature of 220°C, for 5–15 min. This research showed improvements in the mechanical properties of printed specimens. Regarding moulding, Kim et al. 13 used a profiled mould with a negative specimen shape, 4 mm thick, heated close to the material melting temperature. It was observed that better surface roughness and PLA strength can be achieved by annealing. The procedure took place in two phases, heating (140°C–160°C, temperature below the melting of the polymer material) and cooling (about 35°C) of the specimens.
Also, Chalgham et al. 14 performed mechanical tests of PLA specimens made by the FDM method. The specimens were tested for further material application in the manufacture of orthopaedic equipment. Tests were performed on bending and tightening at three points, before and after annealing. An additional annealing treatment was performed above the glass transition temperatures to obtain the desired stiffness. It is shown here that the material’s mechanical properties depend on additional thermal treatment, besides the parameters. The specimens were subjected to additional heat treatment at 75°C, which increased the maximum bending force. A step further, Shaik et al. 15 examined the behaviour of PLA specimens after additional autoclave treatment. Mechanical characteristics testing was performed under certain conditions of pressure and temperature setting. It was concluded that the given autoclave pressures and temperatures positively affect the structural reorganisation within the material, which significantly improves the material strength.
Pure PLA is widely available in the spool filament form of all colours, inexpensive and the most widely used. Unfortunately, it has poor mechanical properties. The main goal of this research is to improve the materials’ mechanical properties through thermal treatment by immersing samples in non-toxic, environmentally friendly media available at a low price, establishing a baseline for further research in PLA reinforced materials.
In this paper, annealing of PLA specimens was performed. The annealing process begins with the packaging of the specimen in two types of moulds. The first group of specimens was submerged in a NaCl mould, while the second group was submerged in a gypsum mould. Annealing was used to determine which technological moulding procedure gives better mechanical properties.
Material and specimens
Material
PLA is a biodegradable, thermoplastic material obtained 100% from renewable sources such as beets, potatoes and corn.16,17 Unfortunately, this material is hygroscopic and not resistant to high temperatures. PLA begins to soften at 150°C, while at 210°C, it becomes liquid (maximum 220°C according to Wanhao recommendations) and at the end of the process, the model cools down. 18 In the case of high temperatures settings (above the defined ones), the previously formed layer may dissolve, which eventually, in the end, leads to inaccuracies in the dimensions of the specimen. Also, there is a risk of cooling the molten material in layers, that is in the end, a model of incorrect dimensions and irregular shape is obtained. Therefore, the temperature difference between the nozzle and the specimen should be as small as possible, and the cooling process should take place slowly and gradually. 19
Wanhao PLA white filament was used for the specimens. The main printing settings recommended by the manufacturer for the used PLA filament are shown in Table 1.
Chracteristics of the commercially available Wanhao PLA filament 20 (white colour).

Specimen preparation and FDM technology
The specimens were made according to the ASTM D638 standard, 21 which tests the tensile strength of plastics. According to mentioned standard, a series of bone-shaped specimens, with a thickness of 3 [mm] and an initial distance between grips of 106 [mm] were considered.
The specimens creating process begins with a 3D CAD model, which is realised using CAD software packages. Finally, the model is implemented as a physical object using FDM technology,22,23 that is imported as *stl. file in the specialised ‘open source’ program Ultimaker Cura 4.3.0, which sets the system’s operating parameters, see Figure 2.
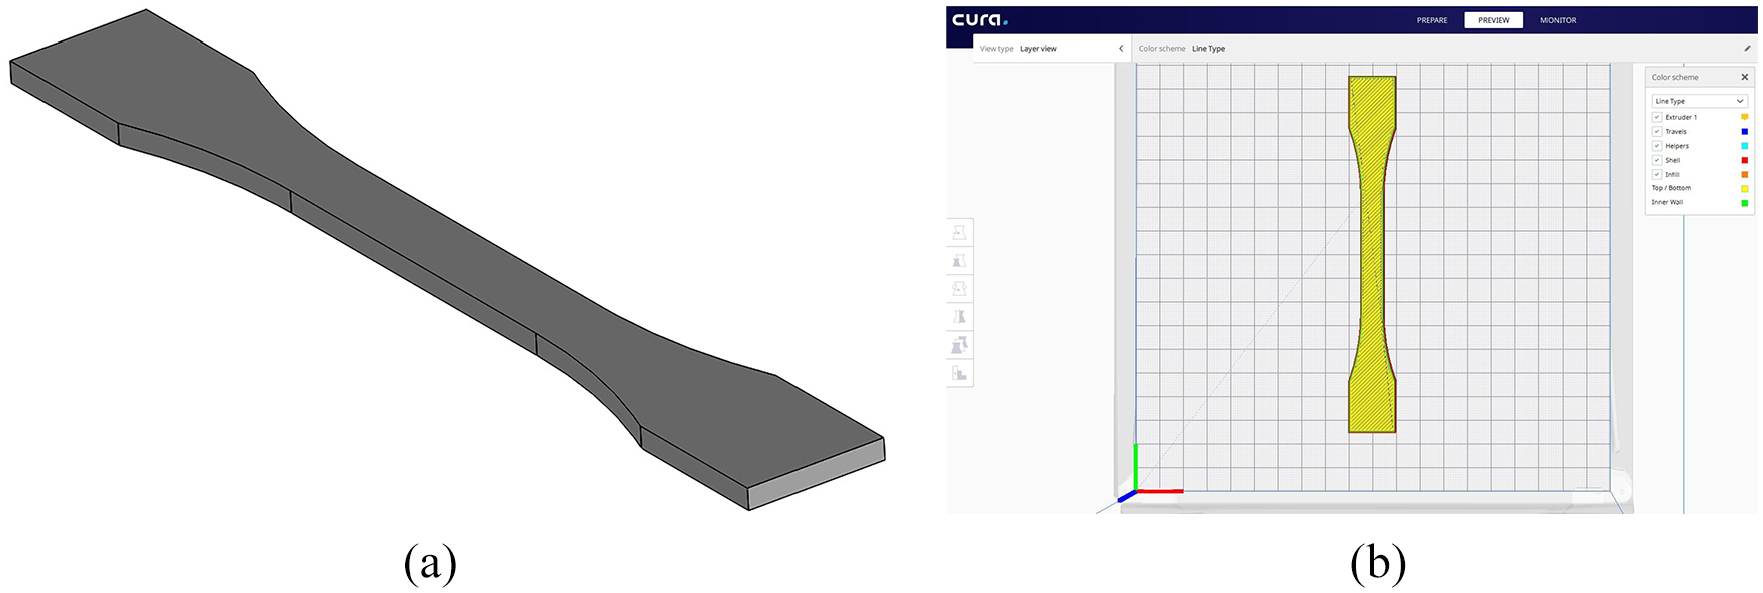
Specimen: (a) 3D model layout and (b) Ultimaker Cura desktop 4.3.0.
The printing parameters of the PLA samples are given, and they are: plate temperature (60 [°C]), nozzle temperature (215 [°C]), infill density (100 [%]) and printing speed (60 [mm/s]) The parameters are identical for all specimens.
In total 60 specimens were made. One specimen series (20 pieces, see Figure 3) was singled out as reference or thermally untreated, and 40 specimens were prepared for treatment (see Table 2). The dimension quality, the quality of gluing/melting of the layers and the specimens’ mechanical properties depend on the flow velocity and the molten filament temperature.24,25 A WANHAO i3 duplicator 3D printer, P.R. China, with a nozzle diameter of 0.4 mm, was used to make the specimens. The specimens were made in a laboratory with a temperature of 23°C and relative humidity of 55%.

Realised specimens according to defined orientation and print thickness (ASTM D638).
Specimens clafication.

FDM 3D printers use a variety of thermoplastics that can withstand different temperatures. The advantages of applying this FDM procedure are reflected in: reduction of excessive use of materials, shortening of time for design and manufacturing, parts manufacturing with complex geometry, the usage of materials with different characteristics and realised parts/elements reduced volume. 26
Unfortunately, there are numerous disadvantages when using FDM devices: geometrical inaccuracy due to material shrinkage during cooling, deficient strength in the layer printing direction, layer delamination issues, need for finishing due to the large surface roughness, need for additional chemical or thermal treatments, etc. 27
Moulding and annealing
In this paper, the authors applied additional specimen annealing to examine whether there was an improvement in the material’s mechanical properties. The procedure took place in two directions: (1) immersing the samples and moulding them with NaCl salt powder (see Figure 4) and (2) submerging and moulding the samples in gypsum (see Figure 5).

Specimen moulding in NaCl powder: (a) specimen drowning and (b) finished mould.

Specimen moulding in gypsum: (a) specimens were submerged and (b) mould formation before annealing.
A total of 40 specimens were prepared for moulding, namely: for immersion in NaCl powder (20 pieces) and submersion in gypsum (20 pieces).
In the first procedure, the specimens were immersed horizontally along the Y-axis (YZ plane, Figure 4(a)), while in the second procedure, the specimens were immersed vertically along the Z-axis (YZ plane, Figure 5(a)) relative to the printed XY surface.
For salt grinding, a Ball Mill Ceramic Jar with a volume of 7 dm3 was used, with two different diameters of alumina balls (20.5 ± 0.5) mm and (28 ± 1) mm. The total mass of the balls was 2.3 kg. The mill manufacturer is Veb Metallverarbeitung from DDR. The initial mass of NaCl in the mill was about 250 g. The sieve sifting was 63 µm (Test Sieve, diameter 200 mm × 50 mm high, ISP 3310-1, manufacturer Retsch – Germany). Separation of the smaller fraction was performed on an Analytical Sieve Shaker AS 200 digit for about 30 min. The UF 55 Memmert – Germany laboratory dryer was used at 60 ± 0.1°C to constant weight after cooling in a desiccator (usually drying in an oven for about 16 h).
The mould with immersed NaCl powder specimens was heated in an oven to the material melting point (for PLA: 200°C at 30 min intervals). Instrumentation dryer ST-01/02, Zagreb, Croatia (+50°C–+200°C) was used. Since it is an older generation oven with a mercury thermometer, the digital multichannel thermometer TESTO 735-2 with Pt-100 probe was used as a control temperature device.
Ultrasonic bath ULTRASONIC CLEANER – ACLEANER, China (model 20, frequency 40 kHz) was used in gypsum mould manufacturing to obtain complete adhesion of gypsum over the entire specimen’s surface and expelling air from the emulsion, see Figure 6(a). The curing of the gypsum mould took place at room temperature and lasted for 24 h. It was performed to prevent the mould from cracking during drying in the oven. After curing the mould at room temperature, the Instrumentation ST-01/02 dryer was used to dry the mould further (see Figure 6(b)). The drying time of the sample mould was 6 h at 100°C.
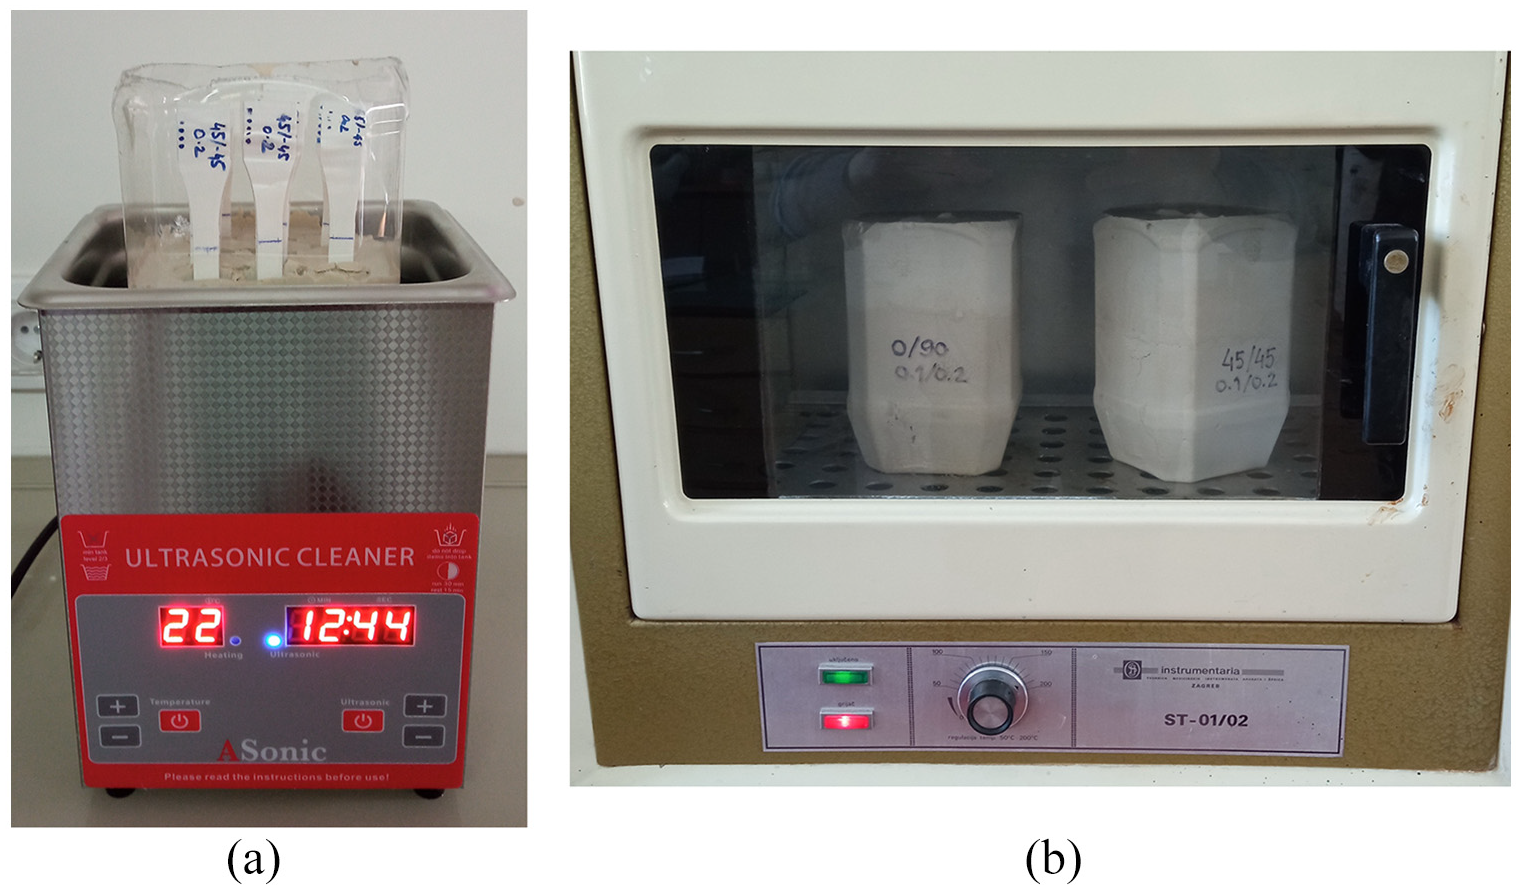
Devices in making gypsum moulds technology: (a) ultrasonic bath and (b) oven.
Annealing treatment of heating the tubes immersed in gypsum was performed at a temperature of 190°C, for 3 h to achieve a temperature inside the mould of about 100°C (which corresponds to Tg– glass transition temperature).12,28 The temperature measurement and control of both moulds during the annealing were performed using a FLIR E5 thermal imaging camera (−20°C–+400°C), see Figure 7. The thermal coefficient εr = 0.44 29 for air was set on the camera (emissivity table for infrared thermometer readings) because the mould temperature was measured after removal from the dryer, that is the moulds were cooled to ambient temperature.

Temperature observation using a thermal imaging camera.
Specimen cooling and preparation for testing
After annealing and cooling to room temperature, the specimens were removed from the moulds, cleaned and prepared for testing the material’s mechanical properties, see Figure 8. Changes in the polymer material structure were observed depending on the thermal treatment. The air gap between the layers is narrowed, and the samples’ roughness on the surface is reduced. That is, the layers and threads stuck together better in the material. Also, changes were observed on the surfaces of the specimens after annealing. Specimens taken from the mould with NaCl powder had traces of NaCl particles on their surface, while samples taken from the gypsum mould left a clear trace of texture on the plaster.

Specimens after removal from the mould: (a) NaCl powder and (b) gypsum.
Figure 9 shows the specimen appearance after gypsum treatment. After moulding and annealing, it was observed that the specimen’s surface texture decreased. Specimens after treatment get a flat and smooth surface compared to untreated ones. The material texture is reflected on the plaster mould, and the specimen surface remains smooth due to thermal treatment. In Figure 8, the mapped texture lines (a) and the shell lines (b) are visible.

Plaster mould appearance after sampling.
Tensile testing of the samples
After the annealing processes, tensile tests were performed on all treated and reference samples on the universal testing machine Shimadzu AGS-X with a maximum load capacity of 100 kN. The appearance of the samples after tensile testing with labelled printing orientation and layer thickness is shown in Figure 10.

Test samples after tensile testing: (a) untreated, (b) annealed in NaCl mould and (c) annealed in gypsum mould.
For the tensile test in total, 60 specimens with 100% filament infill were tested. Five specimens for every series of specimens were used (two different print orientations −45/45 and 0/90) with two print layers thicknesses (0.1 and 0.2 mm) and untreated, annealed in NaCl powder and Calcium Sulphate – Gypsum).
Before testing, calibration of the testing system was performed. The test procedure was performed in compliance with the ASTM D638 standard where the specimens were tightened by non-shift wedge grips and force applied with a testing speed of 5 mm/min. During tests, real-time data of the load force, displacement and time were recorded by the Trapezium Lite X software after which the Young’s modulus of elasticity, maximum tensile stress and maximum displacement were calculated from the obtained data. The stress and strain were calculated for every time step after which the maximum values were obtained and averaged. Stress and true strain calculations were performed considering the specimen dimensions and equations given in ASTM D638. It was considered that this approach is better than using the measured values since it provides for better comparison between specimens (without taking into consideration the shrinkage or other geometric deviations).
The results from extension-force diagrams (Figures 12 and 13) showed that the properties of samples under load could be classified as a brittle and ductile fracture. The fracture of brittle samples occurred at the elastic limit, while ductile specimens showed the ability to undergo a low degree of plastic deformation before fracture. No treated PLA samples with higher maximum failure load and elongation at the break had a ductile fracture. The clear brittle fracture is observed in samples at the elastic limit and in a lower failure load (PLA samples after heat treatment in NaCl medium). The raster angle is the other critical parameter in the FDM processes and has a significant impact on the tensile features of PLA materials, after the annealing procedure. The stress-strain curves of the specimens with orientation −45/45 indicate that the annealing process in different media decreased the elongation of PLA, which is caused by the enhancement of the functionality of the material and results in them being less flexible (see Figure 12). It should be noted that a lower Young’s modulus is shown in the no treated PLA with 0/90 orientation.
The following four tables (Tables 3–6) show the average values and standard deviations for the maximum force, maximum tensile stress, maximum displacement of the specimens and the Young’s modulus of elasticity.
Average value of the main parameters in combination 1 (raster angle 45/−45, layer height 0.1 mm).

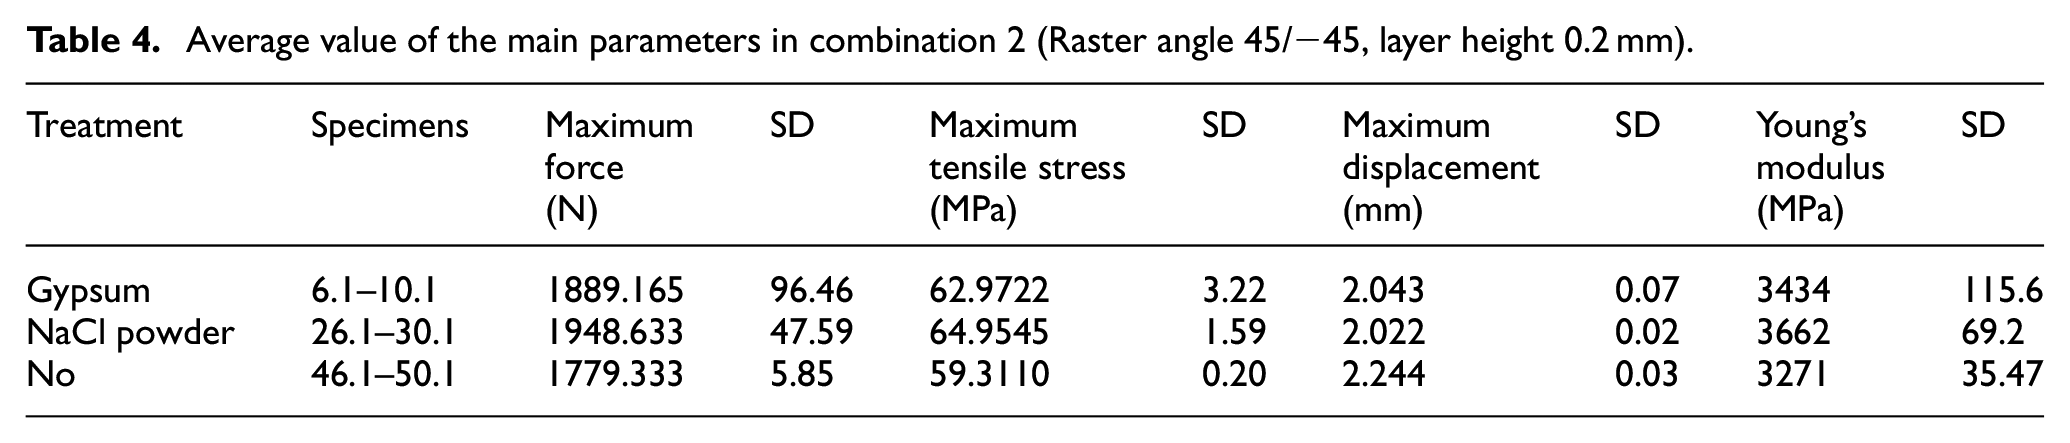
Average value of the main parameters in combination 2 (Raster angle 45/−45, layer height 0.2 mm).
Average value of the main parameters in combination 3 (raster angle 0/90, layer height 0.1 mm).

Average value of the main parameters in combination 4 (raster angle 0/90, layer height 0.2 mm).

Values for the untreated specimens obtained in this paper correspond well with those obtained in Hasan et al. 11 for the same layer thickness and printing orientation and as was shown there heat treatment of the samples increases the strength of the specimens. Here, this trend can be observed in Figures 11–13 as well as in Tables 3–6. It can also be seen that annealing in Gypsum moulds increases the strength of the specimens on average by 12.7% while annealing in NaCl moulds increases the strength on average by 9.7% compared to the reference specimens. It is interesting to note that while annealing in Gypsum showed the largest increase in maximum stress, annealing in NaCl moulds gave the largest increase in modulus of elasticity. Heat treatment also appears to decrease the maximum elongation of test specimens before braking with the average maximum displacement being around 6%–7% smaller than that of the untreated specimens. Hence, though heat treatment in moulds provides an increase in strength, it reduces plasticity and makes the material more brittle.

Average values of the maximum tensile stress for different printing orientations and layer heights of annealed and reference samples: (a) raster angle 45/−45 and (b) raster angle 0/90.
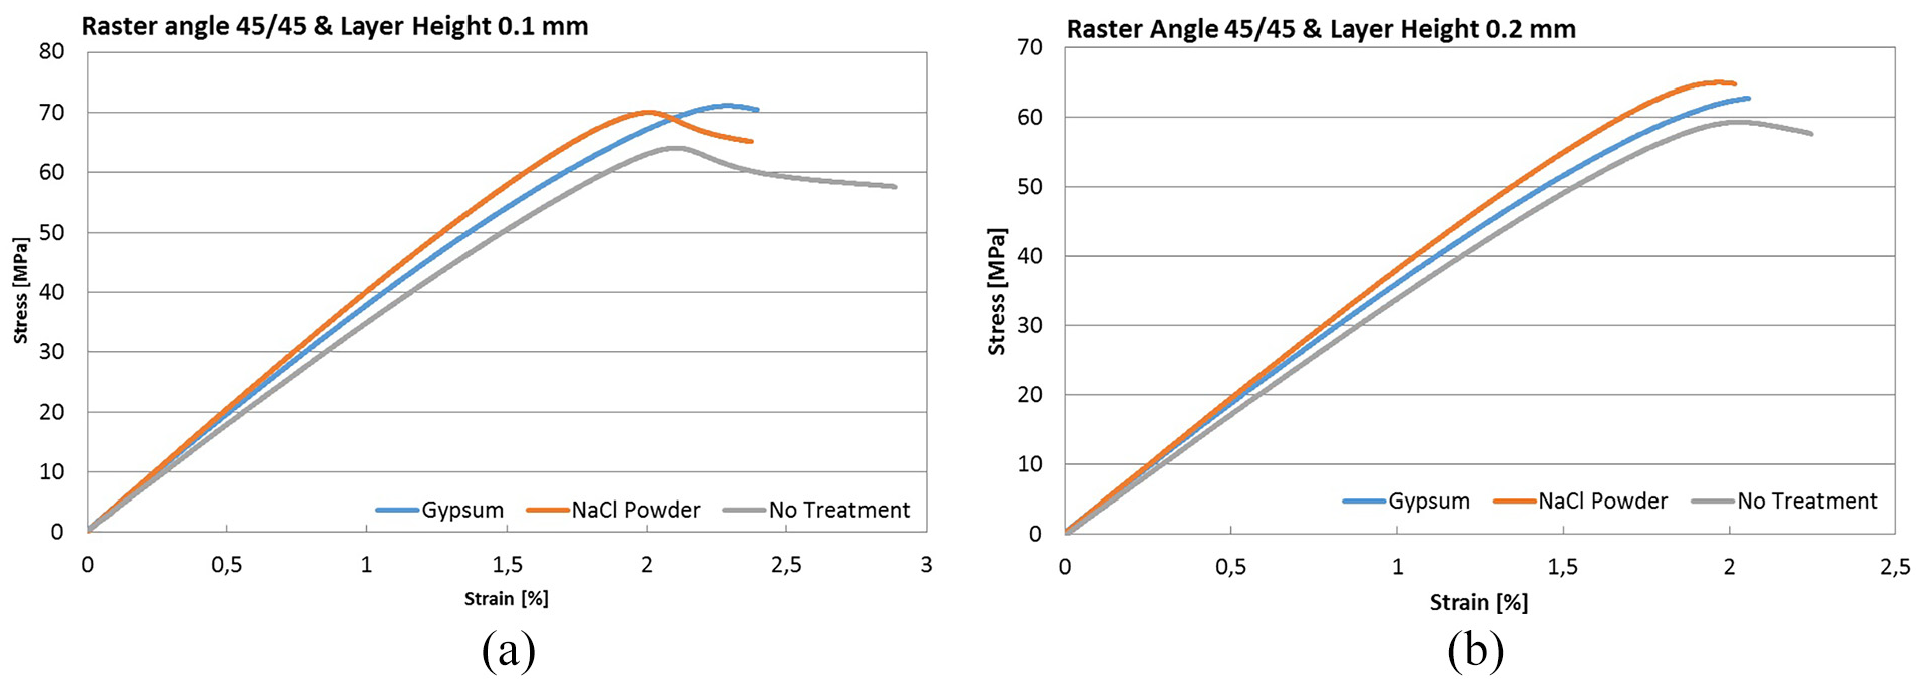
Average stress-strain curves of specimens with orientation 45/−45: (a) layer thickness 0.1 mm and (b) layer thickness 0.2 mm.

Average stress-strain curves of specimens with orientation 0/90: (a) layer thickness 0.1 mm and (b) layer thickness 0.2 mm.
Morphological and structural characteristics of the PLA
Scanning electron microscopy (SEM) analysis
For validation of obtained stress-strain characteristics as discussed in the previous text section, it is necessary to examine the SEM topographies on the cross-section fracture samples after the tensile test. The presence of particles of media, voids, raster strength, layer distance and layer bonding strength of 3D PLA samples before and after the moulding process could influence the mechanical behaviour. The change in the surface structure after heat and moulding treatment in different media or irradiation affects the mechanical properties of a material, such as microhardness or elastic modulus of polymers, which also depend on 3D-printing parameters (temperature, printing speed, infill orientation, etc.) and methods of additional treatment. For this reason, a detailed structural-morphological analysis has been done. Surface morphology was characterised using scanning Electron Microscopy – SEM (model SEM JEOL JSM-6610LV, Japan). Morphological and structural characteristics of the PLA stamp samples before and after moulding and heat treatment were investigated according to a structural change of materials.
The fracture surface was scanned with different magnifications to study the fracture properties and correlated with influence treatments after the tensile test. The surface of the printed specimens was coated with thin (20 nm Au) conductive layers to improve capturing image.
Polylactic acid (PLA), due to its heterochain microstructure, belongs to the type of biopolymers with a predisposition to destruction and rupture after the tensile test (see Figure 14(a)). Due to plastic deformation of the material after tension testing, the longitudinal form of fracture deformation in the polymer matrix was created. A region marked with a red triangle in Figure 15(a) shows the fracture shear lips. Although this is more often seen during the tensile testing of ductile material, brittle material sometimes indicates a similar behaviour due to plastic deformation before the final fracture. 30 For example, crystallographic parameters such as degree of crystallinity or coherence of PLA were investigated in Kurzina et al. 31 with surface and mechanical modification of PLA by ion implementation. These cracks grow further with the applied stress and appear as a network or cone of irregular-shaped fractures. The convenience of annealing in combination with immersion indicates an improvement in adhesion between bond filaments, not a notable dispersal in the direction of the stamp of 0/90 orientation.
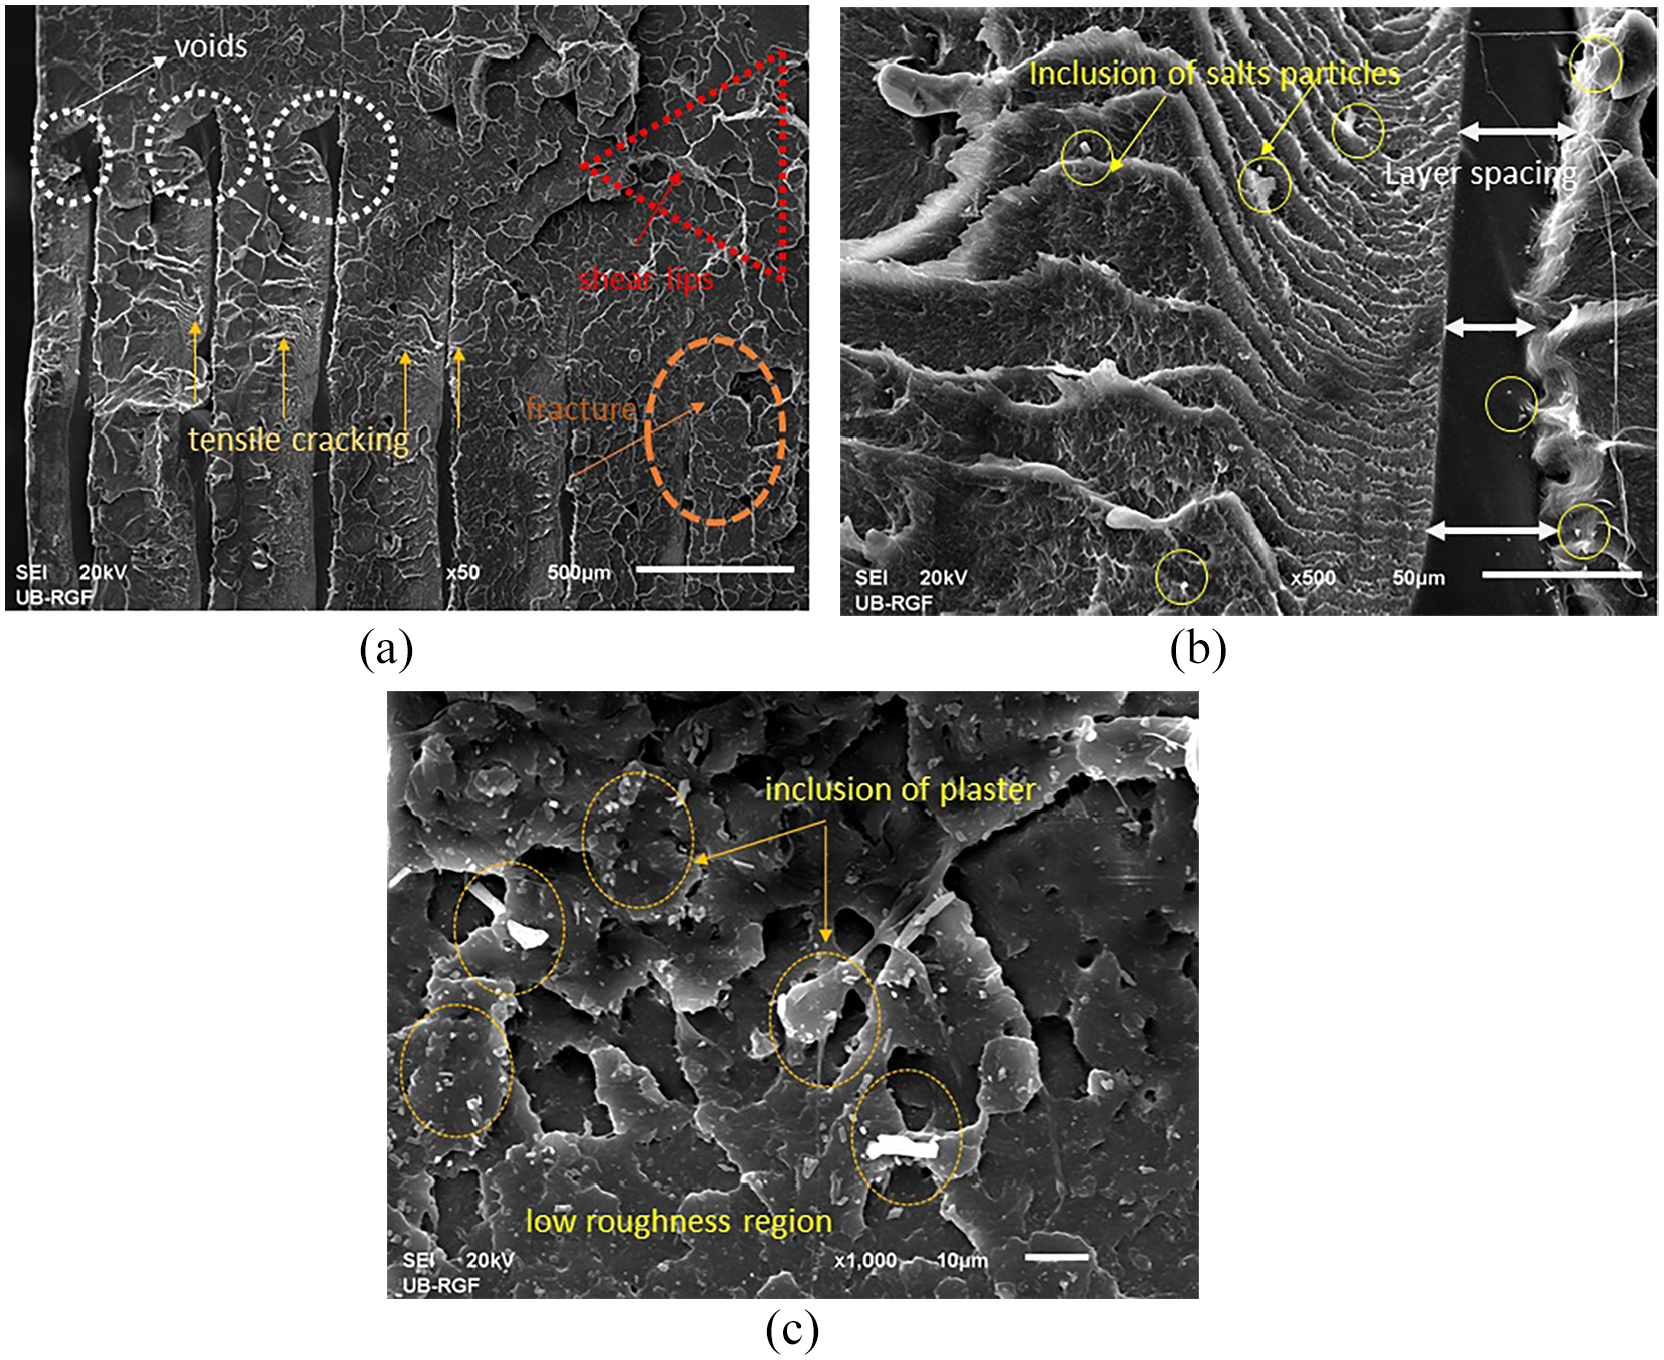
SEM microstructure of tensile fracture surface of a PLA sample printed in the vertical orientation (0/90) and 0.2 layer thickness, after heating: (a) referent PLA, (b) in NaCl and (c) in plaster. Magnification was ×50 (a), ×500 (b) and ×1000 (c).

SEM details of microvoids generated on PLA samples printed in the vertical orientation (0/90) and 0.2 layer thickness, after heating and moulding: (a) referent PLA samples, (b) in NaCl and (c) in plaster. Magnification was ×200 (a), (b) and ×500 (c).
The formation of a flat fracture surface indicates the absence of deformation in the material during loading, where horizontal or lateral lines represent micro-cracks. The increasing amount of horizontal lines (ratchet lines) leads to the form of a vertical micro-crack and promotes failure. Beach marking like circular ring patterns and deformation patterns could indicate more resistance in the material against the failure. These circular rings could also represent the fracture nucleation site (Figure 14(b)).
The larger magnification (×500 and ×1000) was used to analyse details in the structural change of PLA material after treatment in gypsum or sodium chloride medium (see Figure 14(b) and (c)). By immersing PLA samples in different mediums on the surface of the polymer matrix, the deposition of inclusion was observed. The small particles of salts were observed in Figure 14(b), and staph structures of the CaSO4 crystallite have been observed as inclusions in the polymer matrix in Figure 14(c). Co-deposition of tiny particles of inorganic salts and implantation in the polymer matrix of PLA after heat treatment will also affect the mechanical properties of polymers in the form of matrix reinforcement, which will be shown through the mechanical characterisation of the material.
A similar study of microstructure modification by immersing PLA in plaster and salt powder was conducted in Amza et al. 12 and detected voids with a spherical shape and dimension in some range (10–70 µm) obtained in our material, too, after moulding in salt powder. The voids are bigger in the untreated samples (see Figure 15(a) and (c)). When the heat treatment temperature inside the material passes the glass transition temperature (Tg), the molecular motion grows sufficient for the coalescence of voids and the diffusion of filament interfaces. While the width of filaments remains constant, a change in the distance between the filament lines is also noted.
Microhardness test
The microhardness test is usually used to measure the hardness of different materials at small applied loads like 1 kgf (9.80665 N) with static indentations. In this investigation, the microhardness was measured at 0.05 kgf (0.4903325 N) with a dwell time of 40 s. The indenter type is the Vickers diamond pyramid, model Leitz Kleinert Prufer DURIMET I (Leitz, Oberkochen, Germany). The Vickers hardness number (HV), is calculated according to the equation which is shown below: 32

where P is applied load in kgf, d is an arithmetic mean of diagonals in mm and HV is the Vickers hardness number. To convert to a Vickers hardness number, the applied load, needs to be converted from kgf to newtons and the area of indentation needs to be converted from mm2 to m2 to give results in pascals because the new trend requires expression in SI units.
The results obtained from the microhardness test showed the differences between the different parameters of orientation and infill density of PLA, also called mesostructures, of the specimens. The high-level layer thickness of PLA (0.2) resulted in low voids (see Figure 14(a)) and high hardness values. Changing the orientation of the print to −45/45 also affects the increase in microhardness. The change in microhardness of the PLA materials is most significant during thermal treatment compared with the results of untreated specimens. Microhardness testing was first performed on unpolished specimens on the surface itself using three higher loads (100, 300 and 500 gf). The optical microscopy image showing Vickers hardness indentation in the PLA polymer matrix with 0/90 orientation and layer thickness of 0.2, with applied different load and constant dwell time at 40 s, is given in Figure 16. Figure 16(a) is a view of a Vickers imprint on the top surface of the same non-mechanically prepared specimen at 100 gf applied load, Figure 16(b) at 300 gf and Figure 16(c) at 500 gf applied load. Based on Figure 16, the deformation zone’s volume around the indents is enormous, especially for applied indentation load at 500 gf (see Figure 16(c)). Reading the diagonal size from such surfaces is not reliable. For that reason, the surface was mechanically polished, and the microhardness was measured at a load of 50 gf. The deformation zone is much smaller, and the diagonal size reading is more accurate in this case.

Vickers hardness indentation made by microhardness tester in the PLA polymer matrix on the top surface obtained at 0/90 orientation printing and layer thickness of 0.2, without treatment, at applied different indentation loads: (a) 100 gf, (b) 300 gf and (c) 500 gf.
The microhardness test results for low loads (50 gf) are given in Table 7 for all prepared specimens and polished before indentation.
The obtained results from microhardness (H) measurements in the unit of MPa and standard deviation (SD).

According to the result from Table 7, the effects of printing orientation, layer thickness and type of treatment in different mediums on the hardness of 3D printed specimens have been studied. Findings from the analyses showed that:
- The specimen with orientation −45/45 had the maximum hardness for all layer thicknesses (0.1 and 0.2 mm) in the range of 125 to 185 MPa for layer thickness of 0.2 mm and in the range of 120 to 180 MPa for layer thickness 0.1 mm, depending on how the specimens are treated after printing;
- The minimum hardness values were obtained from the specimen orientation 90/0 and layer thickness of 0.1 mm, with values being between 108 and 114 MPa;
- The maximum hardness values were obtained from the specimen orientation −45/45 and layer thickness of 0.2 mm, with values being between 125 and 185 MPa;
- The layer thickness and orientation and the method of post-treatment affected the hardness values of the 3D printed specimens;
- The standard deviation of microhardness measurements is in the range of 0.5–4.1.
Each structural peak (rigid part of the material) and anisotropy in the texture of the surface act as a mini resistor when the indenter penetrates the volume of the PLA material, by analogy with electrical resistance. Surface texture is very important for the sliding surface effect. The uniform and smoother surface give a larger contact during the sliding. A large number of internal lines between the layers or the absence of air gap (space between layers) in the surface sample retain an absorb energy of penetration of the indenter through the PLA. The result is a smaller size of diagonals imprint, ie a higher value of microhardness. The disappearance of the texture with a reduction in surface roughness (Figure 15(c)) leads to a decrease in hardness (more elasticity materials). On the other hand, the presence of other harder materials (medium particles) in the basic PLA matrix leads to an increase in hardness. In this case, the particles of the medium have a strengthening role, according to the analogy of composite reinforced materials.
The tensile load is uniformly distributed across bonded layers or when the number of layers increases. The smaller thickness of the layer has better inter-layer bonding because layers are closely stacked together, consequently resulting in a higher elongation and tensile strength, by analogy with a laminate composite structure.8,33 This indicated a good correlation between the tensile strength value and the hardness features.
Conclusion
The influence on the mechanical and morphological properties by additional material processing of 3D printed specimens was investigated in this paper. Two heat treatment methods were considered: annealing in NaCl powder and Calcium Sulphate – Gypsum. For obtaining the mechanical and morphological properties three techniques were used: tensile testing on a universal testing machine, microhardness testing with Vickers diamond pyramid indenter and observation of morphological and structural characteristics by a scanning electron microscope.
In total 60 specimens with two different print orientations (−45/45 and 0/90) and two-layer thicknesses (0.1 and 0.2 mm) were produced. One-third (20 pieces) of the specimens was treated in a NaCl salt mould, the second third (20 pieces) was treated in a Gypsum mould and the last third of specimens remained untreated in order to establish reference values.
It was shown that heat treatment of the specimens provides an increase in strength and microhardness with treatment in Gypsum providing the best results (28.1% increase in average hardness and 12.7% increase in maximum tensile stress). The best increase in tensile strength was obtained in the Gypsum treated specimens with print orientation 0/90 and layer thickness 0.1 mm (21% increase in maximum stress) while best increase in microhardness was obtained in the Gypsum treated specimens with print orientation −45/45 and layer thickness 0.1 mm (50% increase). Also, it was shown that there is a decrease in plasticity obtained with both annealing methods making the specimens more brittle.
It was observed that annealing in combination with immersion indicates an improvement in adhesion between bond filaments and a reduction in the size of voids in the microstructure of the material. Inclusion of small particles of NaCl salts and staph structures of CaSO4 crystallite was also observed in the polymer matrix of the material.
Footnotes
Acknowledgements
We acknowledge and thank Dr. Jugoslav Krstić from University of Belgrade – Institute of Chemistry, Technology and Metallurgy, Department of Catalysis and Chemical Engineering, for carrying out the salt milling and experiments consulting.
Declaration of conflicting interests
The author(s) declared no potential conflicts of interest with respect to the research, authorship, and/or publication of this article.
Funding
The author(s) disclosed receipt of the following financial support for the research, authorship, and/or publication of this article: This research was supported by the Ministry of Education, Science and Technological Development of the Republic of Serbia, Grants No. 451-03-68/2022-14/200026 and 451-03-68/2022-14/200105.