
Abstract
In the present study, an interaction relationship has been developed by following a design matrix consisting of few combinations of tool rotational speed, traverse speed, and tool pin configurations to understand the evolution of structural and mechanical properties of friction stir welded (FSW) Al-Mg alloy. The welded Al-Mg alloy was characterized in terms of microstructure to analysis different zones of weld using optical and scanning electron microscope. The mechanical properties such as bulk & micro hardness, and tensile strength were evaluated using Brinell, Vickers hardness tester, and tensometer respectively. The weld textures and grain size of the three different zones obtained using electron beam scattered diffraction (EBSD). Further, confirmation test was conducted to ensure the reliability. Results reveal that process parameters and tool pin profile influence the properties of the friction stir welded joints. The straight square pin configuration was the optimal structure for friction stir welding of Al-Mg alloy at a rotational speed of 1000 rpm and a welding speed of 40 mm/min, produced defect free weld with highest tensile strength of 136.25 MPa, bulk-hardness of 80.41 BHN, micro-hardness of 82 VHN in comparison with rest of the combinations considered in the investigation under same conditions. A fine recrystallized equiaxed grain with a partial fiber texture was evolved in the nugget zone. The measured experimental values agreed with the predicted data well.
Introduction
Friction stir welding (FSW) is eco-friendly manufacturing process (green manufacturing technology), it ensures no emission of harmful gasses or radiations to the environment, developed and patented by The Welding Institute (TWI) of UK in 1991. 1 Thomas et al. 2 described the FSW basic principle as a tool pin stirs the abutting faces of the objects. At the initial stage tool rotating at constant speed is plunged into the joint line of two plates and a vertical downward axial force is applied on the joint line until the shoulder of the tool touches the upper surface of the plates. The tool is allowed to dwell for few seconds at the same place to generate friction. Due to friction heat generated at the tool-plate interface leads to plasticization of the plates which ensures the plastic deformation in it and smooth traverse of tool. FSW process parameters are crucially influence the properties during process.3–7
There are number of reported literatures on Aluminum alloys joined by FSW, showing that the quality of weld is largely affected by process parameters and tool profile. According to the published literature on the work, there is a narrow range of FSW process parameters that gives good quality welds.8,9 Crossing this span, some defects/irregularities were observed. In general, higher tool rotation and lower transverse speed resulted with better quality welds. 10 Sahu et al. 11 studied the influence of process parameters and tool pin geometry on the structure and mechanical properties of FSW aluminum alloy 5083 (marine grade) and found the optimal welding parameters and tool geometry to be the most effective. In the nugget zone of the FSW joint, dynamic recrystallization was influenced by these parameters. It was found by El-Sayed et al., 12 Heirani et al., 13 Kalemba Rec et al., 14 and Chandrashekar et al. 15 that FSW parameters had a significant impact on the material characterization and mechanical properties of similar welded joints. Due to the traverse and rotational motions, the material flows from the tool’s advancing side to its reverse side, resulting in the intermixing of both plates across the joint line. 2 Padhy et al. 16 reviewed the friction stir welding and processing with reference to their principle, structure, and applications. The amount of friction heat generated and the plastic deformation are governed by the traverse speed and tool rotation in this case. The joint formed is by virtue of atomic diffusion based upon the pressure and temperature generated due to motions of the tool. Further, a hole at the end of the joint is seen which is due to retraction of tool from the plates at the end of welding process. The surface of all the plates displayed flash formation indicating generation of high welding temperatures.
Aleem Pasha et al., 5 Mohanty et al., 17 and Chandrashekar et al. 18 investigated the effect of tool parameters on the properties of FSW aluminum alloys. The geometry of the tool has a significant impact on the properties of the FSW joint microstructure and tensile strength. It serves two primary functions as a tool during welding. Beginning, it causes localized heating due to friction between the tool pin and the work piece during the initial stage of the tool plunge. The material is “stirred” and “moved” in the second function. Saravana Kumar et al. 19 examined the outcome of different tool pin profiles on weld properties and discovered optimum process parameters that result in better properties for marine grade aluminum alloys. The basic mechanisms involved in the FSW process, according to Ma et al., 20 are exceedingly coupled physical phenomena, namely heat generation due to material flow and friction between tool/work and vice versa. The process parameters, tool geometry, and nature of the base material to be welded in the process all have a significant impact on material flow. The plunge depth of the tool shoulder is primarily responsible for promoting material flow and generating heat zones at the weld joint. 21
The deformation of the material all through stirring causes a few other added heating, but the majority of the heating is caused by friction between the shoulder and the work. The relative size of the pin and shoulder is a significant factor in terms of heating. The tool shoulder can also be used to limit the heated volume of the material. Raj Kumar et al. 22 explored the microstructure and mechanical properties of friction stir welding as influenced by tool design and welding parameters. The tool design governs the uniformity of the microstructure and properties, as well as the process loads. Mehta and Badheka 23 discussed the tool pin design and its influence on defects formation during FSW. Insignificant tool design in friction stir welding process leads to defective joints, which fails in intended applications. Feofanov et al. 24 explained the two distinguished stages of failure in welds. The initial stage is with respect to the appearance of the primary crack at the root of the seam along the weld line; the next stage is fracture in the direction of the maximum tensile stress. In other cases, failure is due to defects close to the front of the seam, where rupture is first observed; the next stage is failure along the boundary of the weld core.
Godhani et al. 25 inspected the influence of tool profile and temperature on the morphology, micro-structural, and tensile properties of welded specimens. They noticed that the temperatures were nearly the same on both the advancing and retreating sides of the joint, with little difference in joint properties, and that the maximum temperature was recorded at the plunged area at the exit of the tool from the joint. Cole et al. 26 used temperature measurements at the dynamic tool – work interface during welding to explain the effects of alloy placement and weld tool offset. Lower weld temperatures result in increased joint strength as the amount stirred into the nugget increases. Defects in the welded samples make the joint structurally unstable and unsuitable for frequent use. A lot of research has been done in the past to look at the relationship between defect development and mechanical characteristics. High traverse rates, along with slow tool rotation and insufficient tool plunge depth, result in a large number of flaws. Tunneling is a frequent defect has a substantial impact on the mechanical characteristics of the joints. It is generally not apparent on the surface since it is generated inside/below the surface. It happens when the welding process parameters are chosen incorrectly, resulting in inadequate plasticization of the materials and an imbalance in material movement around the tool pin. Also, because of the minimal heat input. These flaws can be reduced or avoided by applying heat evenly on both sides. Microvoid flaws in the band pattern structure are caused by lower welding speeds, and the size of the defects decreases as the welding speed increases up to the certain range. Due to the decrease in the maximum strain and absence of necking, these microvoid defects have a noticeable influence on the tensile deformation and fracture behavior of the joints. When significant heat is created between the tool and the job, flash occurs. Excessive heat softens the aluminum, and this softened aluminum flows away from the welded zone and toward the tool’s sidewalls. It may be eliminated by machining, but this weakens the result. The heat produced during welding may be optimized to reduce flash. The cavities generated in the joint are known as blow holes. The substance in HAZ does not mix/bind well, resulting in cavities/holes. It might also be due to the presence of contaminants on the tool’s pin or base metal. Preheating the base metal will soften the material throughout the sample, which will avoid the formation of blow holes. As a result of considerable literature research, FSWed aluminum alloy joints have been extensively characterized in terms of interaction between parameters, but the Al-Mg FSW joint has not been studied in terms of characterization. Aiming to fill in the gaps in the literature, the present study investigates and analyzes in depth the structural evolution and mechanical behaviors of FSWed Al-Mg alloy plates produced under varied welding conditions as per design of experiments.
Design of experiments
Higher tool rotation rates result in higher temperatures due to increased friction heating, resulting in more intense material stirring and mixing. Inadequate stirring and incorrect material mixing occur from lower tool rotation rates. With the optimum parameters, sound joints can be obtained. Past investigations conclude that the processing parameters in friction stir welding are the important components that determine microstructure, characteristics, temperature profile/heat input, flaws, and residual stresses. Increases in tensile strength were seen when rotation speed increased up to an optimal value. As rotational speed increased, strength dropped. This optimal value occurs, because the heat generated by the coefficient of friction gradually decreases as rotation speed increases. Tool rotational speeds vary from 450 to 1950 rpm,27–32 with traverse speeds of 12–90 mm/min.23,27,29–33 According to the majority of prior research, tool geometry is one of the most important factors that determine the quality of a joint, which plays a critical role in material flow. Previously, researchers attempted to use various tool shoulder and pin geometries for FSW of Aluminum alloys, such as cylindrical with or without threads,23,31 conical with or without threads,27,34,35 straight triangular, 27 straight square,23,34,36 tapered square, 27 straight hexagon,23,34 and straight hexagon,23,34 among others. 37 Based on the previous investigations, the ranges of process parameters such as rotational speed, transverse speed, and pin profiles were considered in the study, as tabulated in the Table 1 and they were optimized. Table 2 represents the Design matrix for trial run.
DOE (Design of experiments) levels applied.

SC: straight cylindrical; SS: straight square; TC: tapered cylindrical.
Design matrix for trial run.

Central composite design (CCD)
Using a nonlinear multi-variable model, CCD is commonly used to optimize process variables. Most commonly, it’s used in the development of regression model equations and operational conditions grounded on experimentation and variables involved in the process. Studies of the effects of interactions between different parameters that control the process is beneficial. A FSW subjected to various parameters was subjected to the CCD technique (Response Surface Methodology: RSM). RSM is an excellent DOE technique for estimating and optimizing device variables with the fewest possible experiments. It’s used to model nonlinear relationships between input and output variables.
In order to examine the impact of interactions between different variables of the process, an empirical model was constructed focusing on a quadratic model of second order for assessing critical components as given by equation (1).
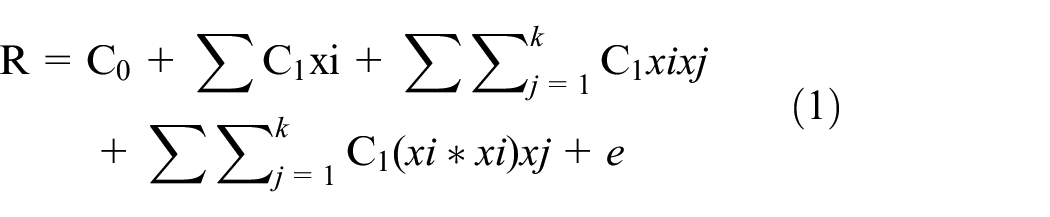
Where:
C0 is the intercept;
R is the response variable; Ai, Aij, and Aii are coefficients of linear effect, double interactions; the autonomous variables or factors are and.
xi, xj, are the autonomous variables or factors
Ai, Aij, and Aii are coefficients of linear effect, double interactions
e is the error
Here, in the present study, the Central Composite Design (CCD) for three variables such as rotational speed, welding speed, and tool pin profile was used. It is split into two blocks, one block with factorial points and another block with the axial points. Both of them have three central points. In total two blocks, six center points.
Materials and methods7
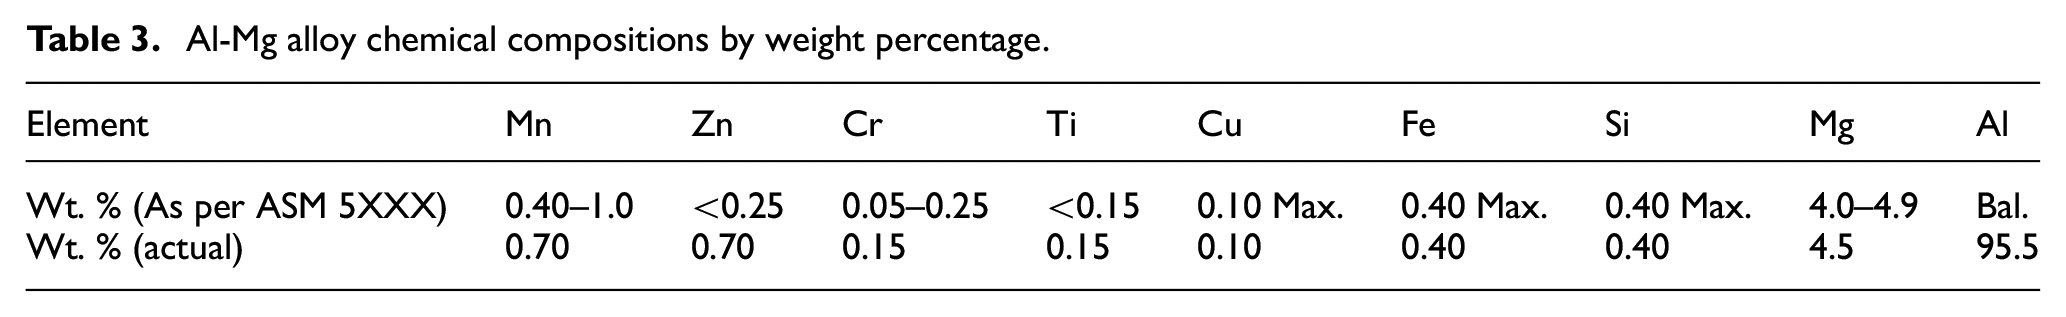
Alloy Al-Mg is adopted as a base material because of its good formability and weldability due to which it is being used in many aerospace, marine, and automotive applications. In this study, 150 (length), 100 (width), and 6 mm (thick) Al-Mg alloy plates were joined, and their chemical composition is shown in Table 3. The square butt joint configuration was used to create the connections. During the present experiments, we used a friction stir welding equipment (R V Machine Tools) with a proper fixture. Figure 1 shows the setup of a friction stir welding machine (FSW machine) (a). The varied tool pin profiles employed in the investigation can be seen on Figure 1(b). The FSW machine specs are listed in Table 4. Welding tool with 25 mm shoulder diameter and 5.8 mm pin length was used to prepare the butt joints. H-13, a high-carbon, high-chromium steel, has been employed in the study as a tool in the study. According to Table 1, rotating speeds of 800, 1000, and 1200 rpm and welding speeds of 20, 40, and 60 mm/min were used.
Al-Mg alloy chemical compositions by weight percentage.
FSW machine specifications.


(a) FSW Machine supplied by R V Machine Tools, Coimbatore, India, (b) Tool pin profiles used in the present study, and (c) Flow chart of the FSW process followed in the study.
A design matrix based upon the three input variables namely tool geometry, rotational speed, and traverse speed as shown in Table 2 is prepared. Trials on each FSW parameter set as mentioned in the Table 2 is carried out and properties of the same are studied. In the first step, 20 different samples for each FSW parameter as per design matrix are prepared by friction stir welding process using Al-Mg alloy plates. Here the number of passes is limited to single pass for each set of FSW parameter. A complete step-by-step procedure followed during study is shown in Figure 1(c). The analysis of variance of surface roughness, hardness, and tensile strength obtained using RSM is mentioned in Table 5, Table 6, and Table 7 respectively.
Analysis of variance for surface roughness.
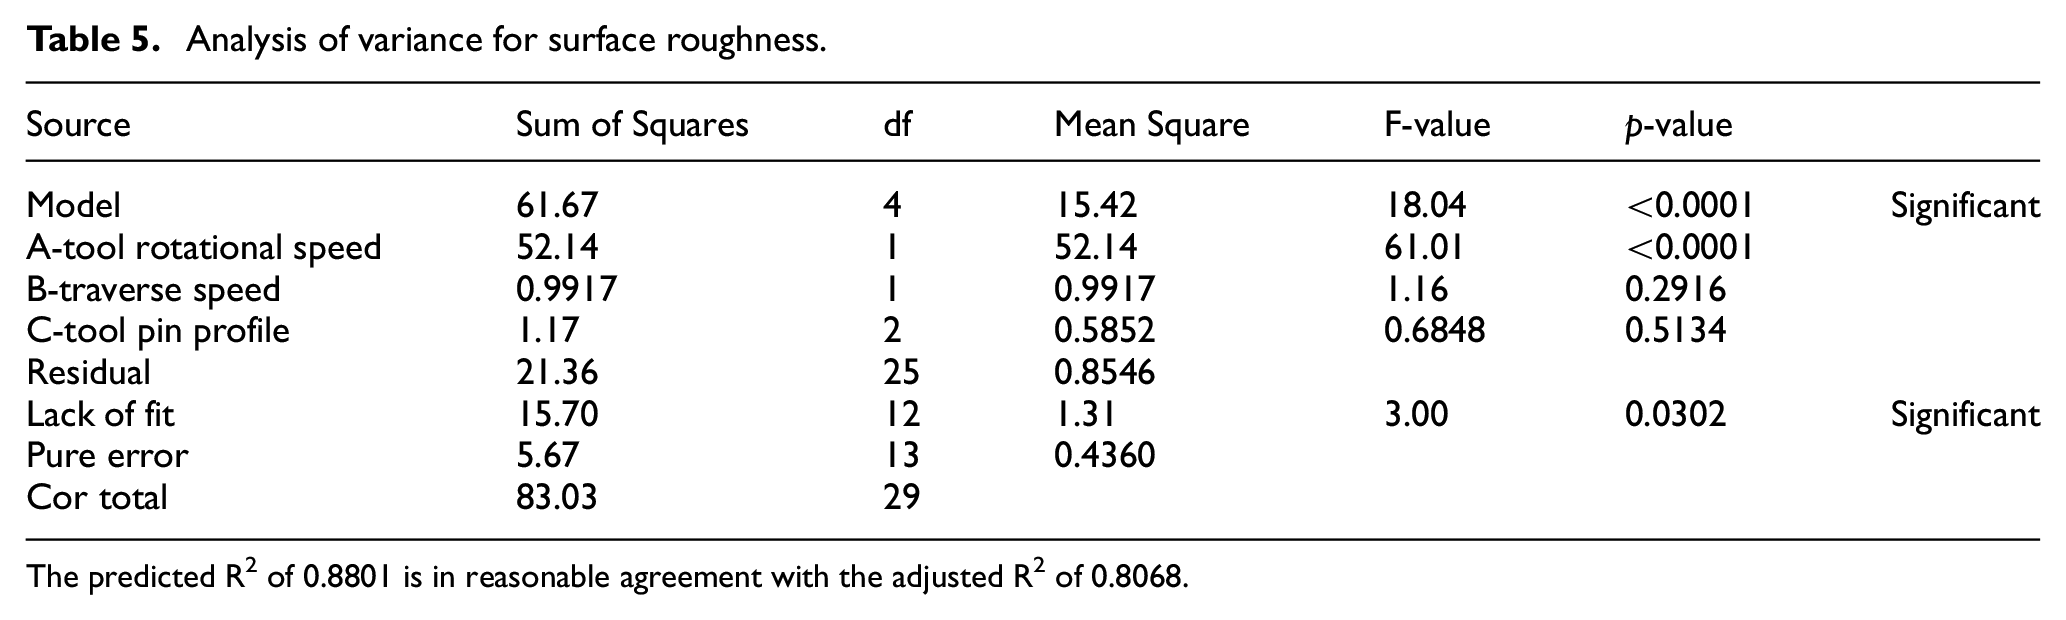
The predicted R2 of 0.8801 is in reasonable agreement with the adjusted R2 of 0.8068.
Analysis of variance for hardness.

The predicted R2 of 0.8601 is in reasonable agreement with the adjusted R2 of 0.7751.
Analysis of variance for tensile strength.
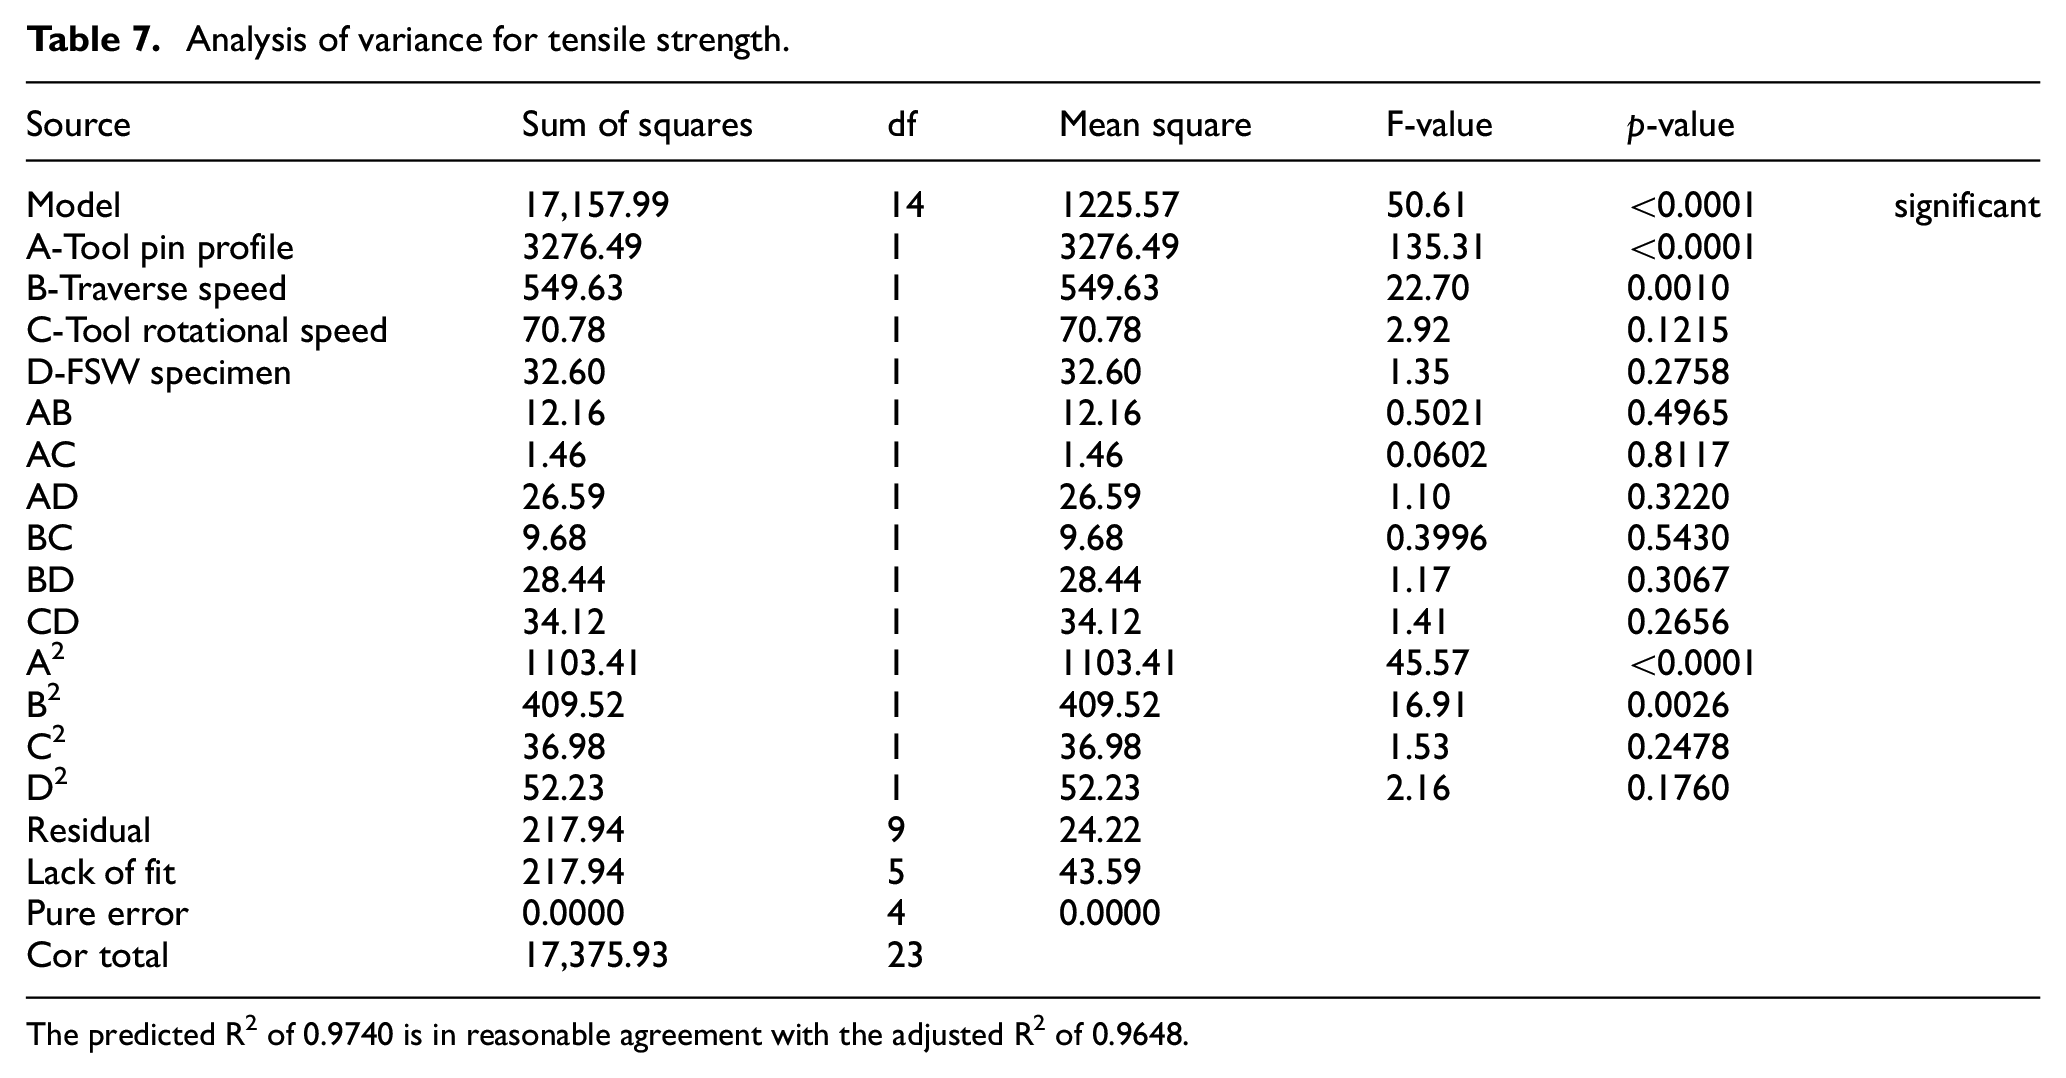
The predicted R2 of 0.9740 is in reasonable agreement with the adjusted R2 of 0.9648.
A Mitutoyo Suftest-SJ210 indicator (Figure 2(a)) was used to measure the surface roughness of the welded joints according to standard. ASTM E08 called for the cutting of three tensile specimens, one in each joint, into dog bone shapes. A Tensometer (Make: Kudale Instruments Pvt. Ltd., Pune, India) at a strain rate of 10−3 s−1 was used to test the tensile properties of the material at room temperature, shown in Figure 2(b).

(a) Surface roughness tester (Courtesy: R&D Center, KSSEM, Bengaluru, India), (b) Tensometer used to measure tensile properties (Make: Kudale Instruments Pvt. Ltd., Pune, India), (c) Brinell hardness tester (Courtesy: R&D Center, BIT, Bengaluru, India), and (d) Model: HWMMT-X7, Vicker’s microhardness tester supplied by Highwood DMH7 – TTC unlimited INC – Japan, Made.
Following equipment’s was used to further carry out the experiment:
To measure bulk hardness, Brinell Hardness Testing machine was used across different zones (Figure 2(c)) (such as SZ, HAZ, TMAZ, and BMZ) on FSW jobs at an interval of 10 mm in transverse direction by using, as per ASTM-E-10-93 standards, with 500 kg as applied load for dwell time of 30 s.
TO measure the micro hardness of samples at (3 mm below the surface) mid-thickness were taken using Vicker’s micro hardness tester (Make: Highwood DMH7 – TTC unlimited INC – Japan, Model: HWMMT-X7), shown in Figure 2(d), with 50 gf as applied load for dwell time of 10 s; made as per the standard ASTM E384-08.
Fractograph were analyzed using Scanning Electron Microscope (Model: Vega 3 Tescan).
They were then characterized using a field emission SEM (scanning electron microscope, FESEM) furnished with an EBSD detector. The specimens were cut into welding portion TMAZ and base metal zone, sanded with water, and electro-polished with 10% HClO4 and 90% C2H5OH solution operated at 30 V for 40 s.
Results and discussion
Impact of FSW on surface roughness
The surface roughness of the Al-Mg plates plays an important role in deciding the quality of the weld surface. So it is necessary to understand the effect of single pass friction stir welding on the surface roughness of Al-Mg plates welded using different FSW parameters and the weld quality. In FSW, tool plunges into work to a certain thickness in order to cause intense frictional heat, results in overflow of plasticized materials. This causes the weld thinning at the joint, produces weld flash deteriorates the surface finish and integrity, ends up with strength loss and decreased load bearing capacity. Investigations are in progress in order to reduce weld thinning and achieve high quality joints. 38 One such remedy for weld thinning is proper selection of tool profile. Materials around the pin flowed downwards, and those away from the pin flowed upwards. The outer shoulder could prevent plasticized materials from flowing out and refill them into the joint. 39 The surface roughness of all 20 Al-Mg welded plates is shown in Figure 3. Here the average surface roughness values of all welded plates correspond only to welded zone. The formation of onion rings during welding process is seen at the interface between Al-Mg plates and the straight cylindrical tool. The plate number 10 processed at rotational and traverse speed of 800 rpm and 20 mm/min displayed highest surface roughness value of 10.705 Ra with tapered cylindrical pin configuration while plate number 5 processed at rotational and traverse speed of 1200 rpm and 20 mm/min end showed lowest surface roughness value of 4.9 Ra for straight cylindrical tool pin configuration. Rest of the welded plate’s surface roughness was in the range of 5–8 Ra. These surface roughness values implies that the tool rotating at high speed along with high traverse speed but however the geometry of the pin do have huge influence on the surface roughness. The main reason in obtaining low surface roughness value can be attributed to generation of high friction heat due to high rotational speed which ensures the formation of soft plasticized layer beneath the tool shoulder. 40

Surface roughness of FSWed Al-Mg alloy specimens for varying parameters as per design matrix.
Figure 4(a) shows the surface roughness of Al-Mg alloy welded plates for straight pin configuration with varying tool rotational speed. It can be seen that with the increase in tool rotational speed from 800 to 1200 rpm, the surface roughness tends to decrease from 7.8 to 5.0 Ra. This is mainly due to high friction heat generation which results in generation of soft layer which in turn causes the lowering of surface roughness. Further, Figure 4(b) shows the surface roughness values for straight pin configuration among the other rotational speed and traverse speed. It can be seen that for high rotational speed of 1200 rpm but low traverse speed of 40 mm/min, the straight square pin configuration has resulted in low surface roughness value of 5.5 Ra. Here the variation in surface roughness value of straight square pin configuration is found to be very less when compared to that of other pin configuration for all process parameters. 41 In Figure 4(c) the 3d surface plot of surface plot affected by tool profile and transverse speed as discussed above is shown obtained using RSM model through equation (2). The predicted values versus experimentally obtained readings show excellent fitness as shown in Figure 4(d).
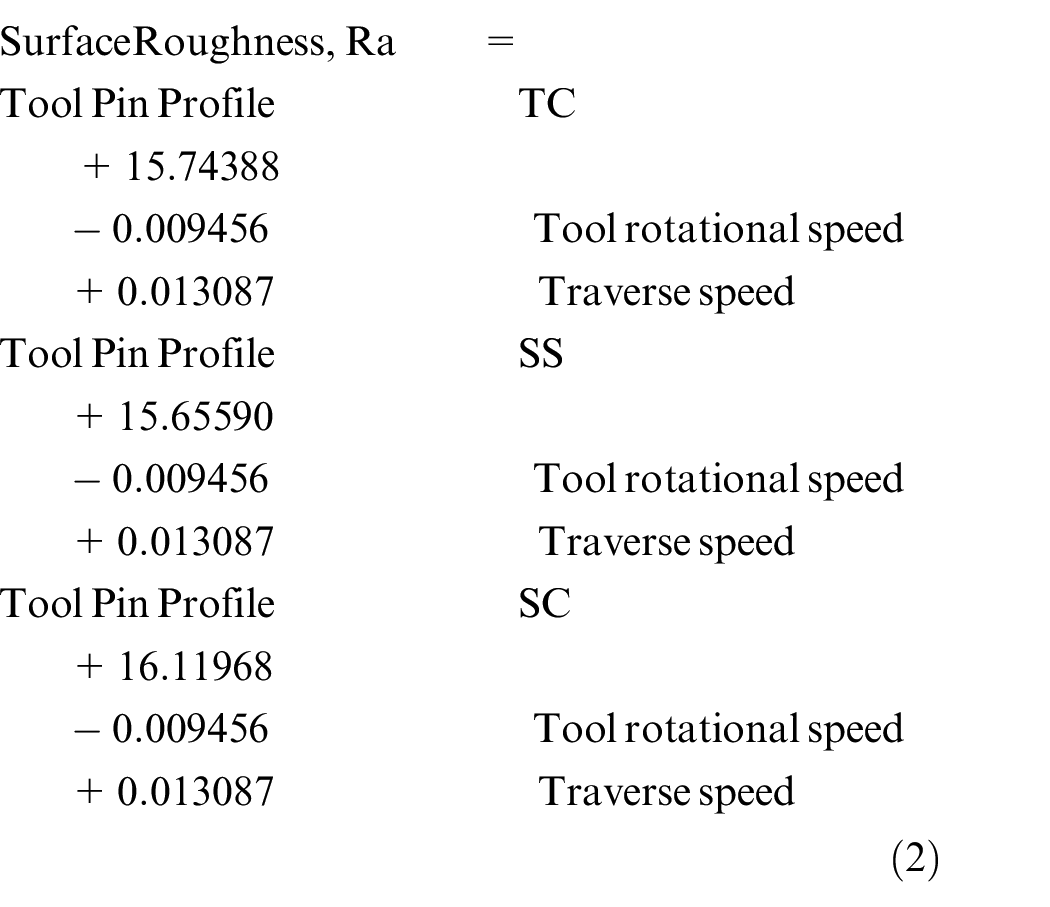

Plot of surface roughness of FSWed Al-Mg alloy for (a) varying tool rotational speed, (b) combining welding parameters with straight square tool profile, (c) 3d surface plots, and (d) actual versus predicted graph from RSM.
Effect on macrostructure
Surface quality of weld joint of Al-Mg alloy is observed by examining the cross section. Figure 5 shows the transverse macrographs of Al-Mg welded joint processed using tapered cylindrical pin configuration at rotational speed and traverse speed of 800 rpm; 60 mm/min (Figure 5(a)) and 1200 rpm; 20 mm/min (Figure 5(b)) respectively. The macrostructural characterization of the Al-Mg welded plate shows three distinct zones based upon the grain sizes. These different zones are nugget zone or stir zone (NZ/SZ), thermo-mechanically affected zone (TMAZ) and heat affected zone (HAZ). Here, the NZ is present in central weld zone surrounded by TMAZ. NZ is the region which features fine grains due to intense plastic deformation undergone by the Al-Mg alloy due to its interaction with the tool pin. The original “as-cast” microstructure of the Al-Mg plate is broken by intense plastic deformation due to rotational and traverse action of tool pin during friction stir welding process. The severe plastic deformation along with frictional heat generated results in dynamic recrystallization due to which fine equiaxed grains are formed in this region. However, the macrostructure shows the porosity at the bottom of the Al-Mg welded joint in both the cases as shown in Figure 5. The formation of the porosity can be attributed to the increased fluidity and turbulent flow of the Al-Mg metal. The cooling of stirred metal before filling the region just exactly behind the rotating tool will result in formation of voids. Such voids are not undesirable from the weld integrity point of view nor will it contribute for good mechanical or tribological properties at the weld joint.

Macrostructure of FSWed Al-Mg alloy welded at (a) 800 rpm; 60 mm/min and (b) 1200 rpm; 20 mm/min using tapered cylindrical pin configuration.
Effect on mechanical properties
Bulk hardness
Figure 6(a) shows the Brinell hardness profile across the traverse direction for all the 20 friction stir welded Al-Mg plates. Here it can observe that the plate 8 and 20 which have highest hardness were welded using straight square pin configuration while 3 and 5 were welded using tapered and straight cylindrical pin configuration, respectively. It is interesting to note that all the plates displaying high hardness are mainly from the pin with straight square pin configuration. Here the geometry of the pin of the tool is playing an important role in deciding the bulk hardness rather than tool rotational speed or traverse speed. In Figure 6(b) the response of hardness for direction and Al-Mg plates obtained using RSM. The same non-linear effect on hardness is visible as a surface response obtained using the quadratic equation (3). The RSM predictions are in-line with the observed values as depicted in Figure 6(c). Figure 7(a) shows the Brinell hardness for plate number 8 which was welded using a straight square pin configuration at constant traverse speed of mm/min but at varying tool rotational speed. The hardness was found to have maximum value at the nugget zone for all the rotational speeds. A maximum hardness of 68, 75, and 80 BHN was observed for 800, 1200, and 1000 rpm respectively. Severe plastic deformation created by straight square pin when compared to that of straight cylindrical and tapered cylindrical pin configuration result in increase in dislocation density. The micro structural changes caused by dynamic recrystallization as well as increased dislocation density in this zone is main reason for this high hardness. 42 In Figure 7(b) the hardness response as explained here is shown in the form of 3d plot using RSM model mentioned in equation (4). The peak values are clearly visible in the nugget zone and least at the farther ends. The RSM model obtained for the surface plot is matched against experimental readings and it is observed that there is a close prediction as provided in Figure 7(c).


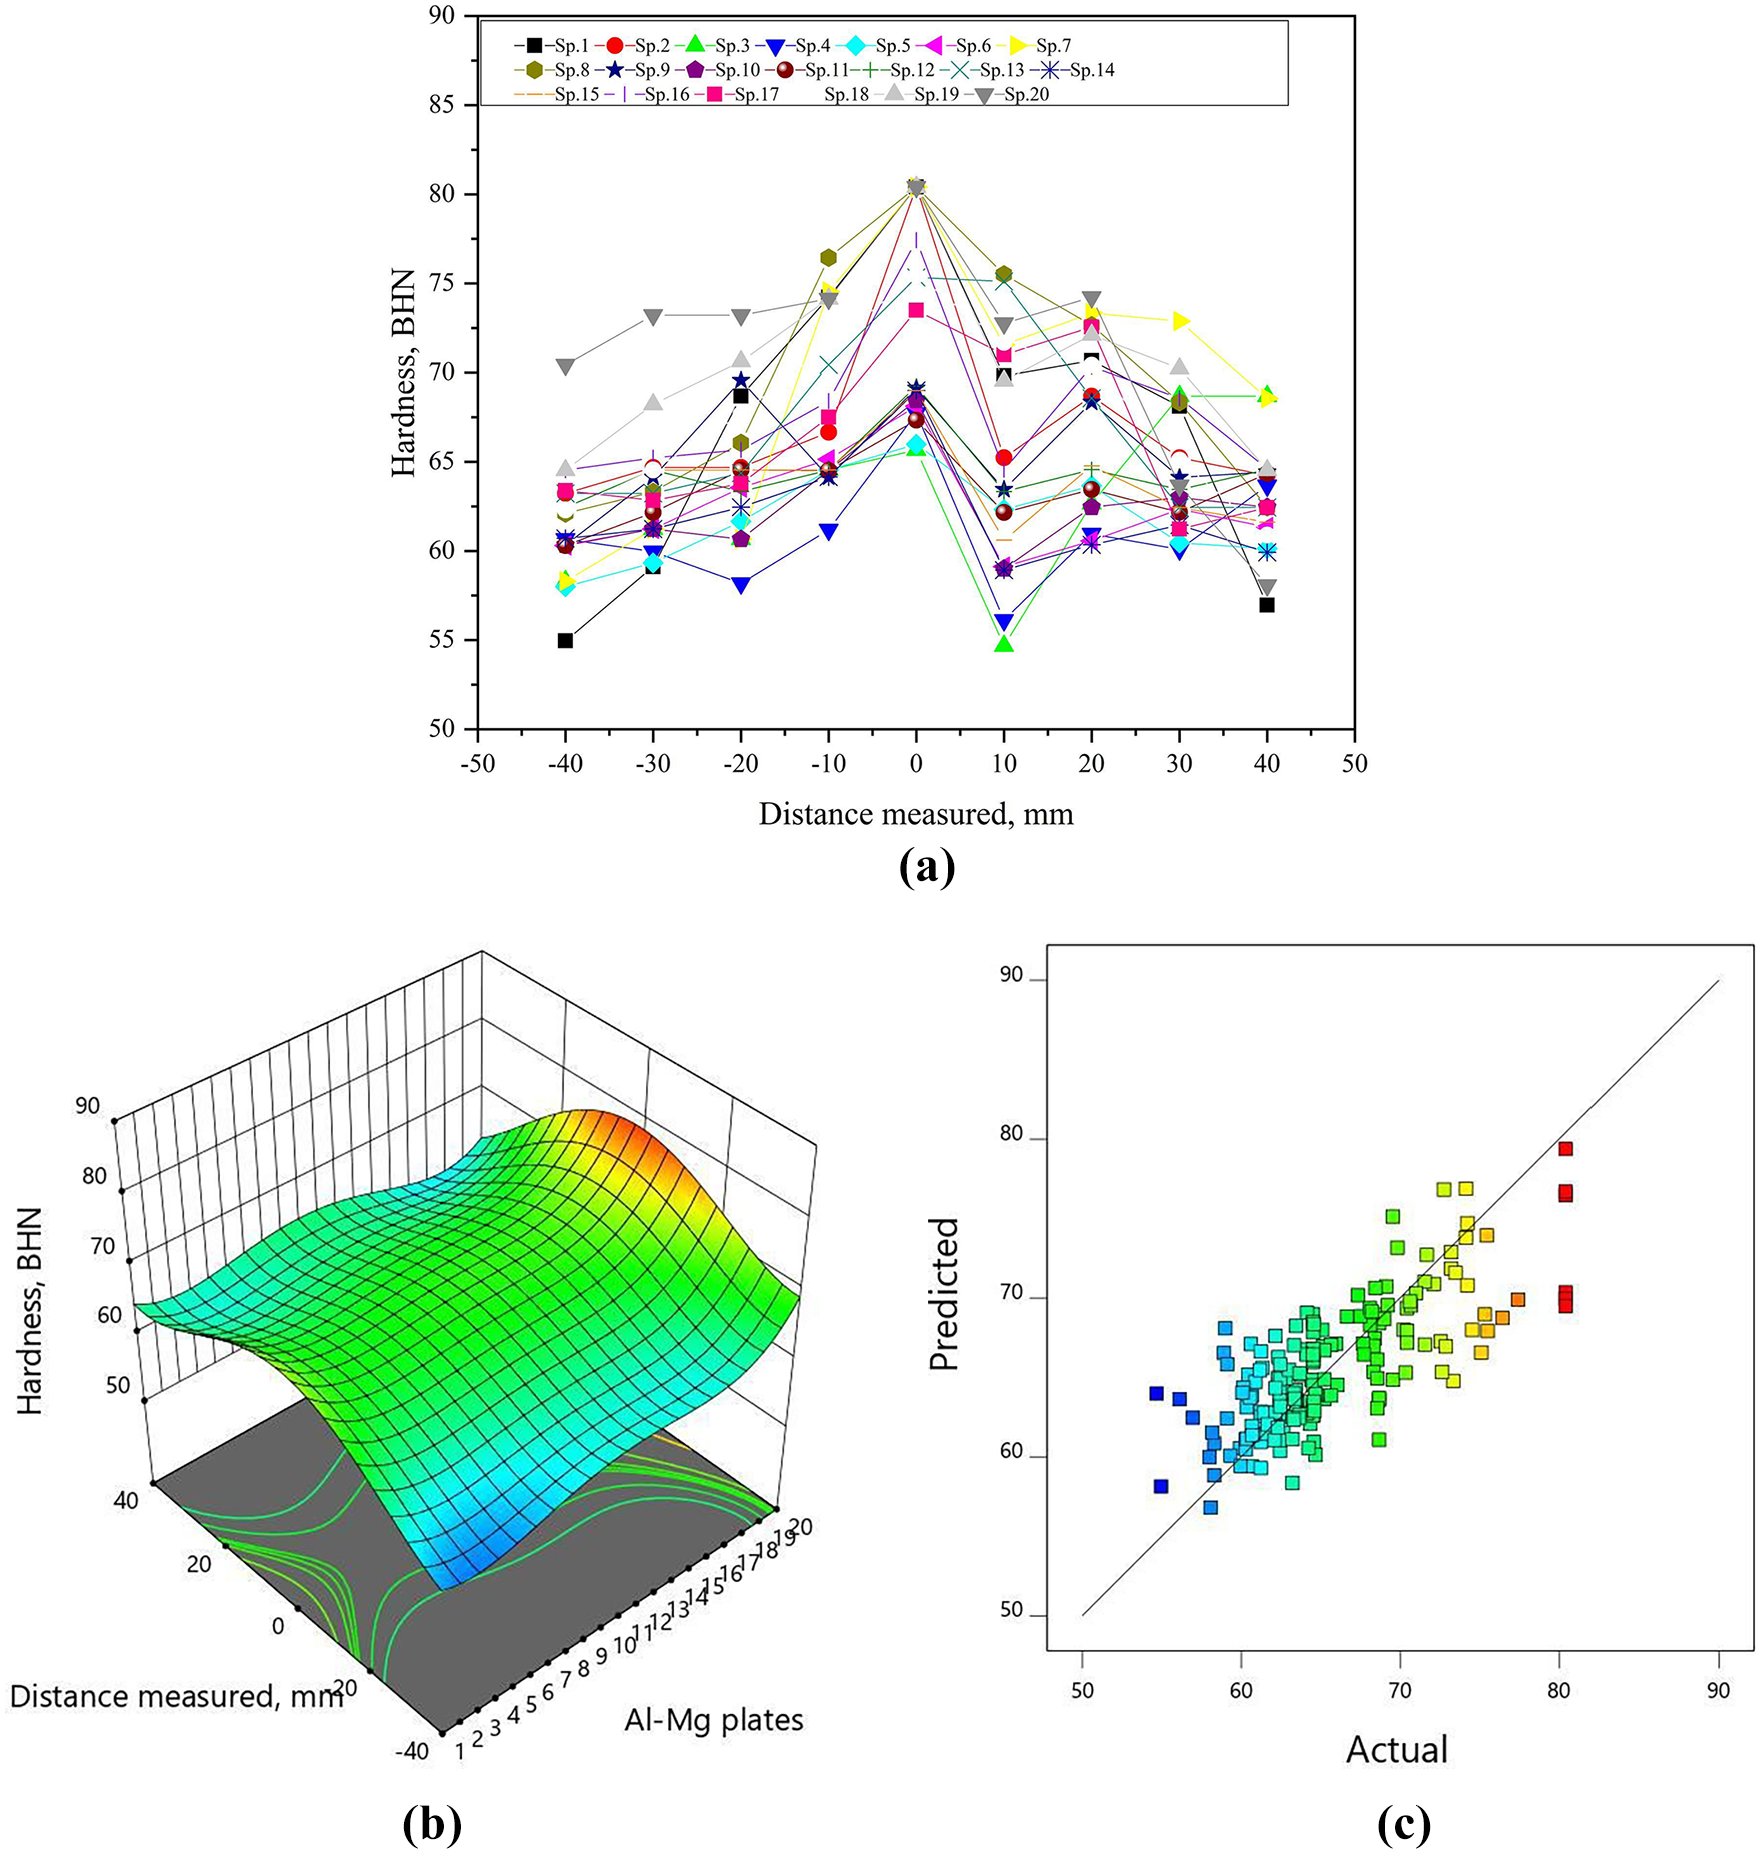
Hardness profile with transverse distance for FSWed specimens of Al-Mg alloy (a) graph from experiments, (b) 3d surface plots from RSM, and (c) actual versus predicted graph.

Hardness of FSWed Al-Mg alloy along the transverse direction for varying rotational speed (a) graph from experiments, (b) 2d contour plots from RSM, (c) 3d surface plots from RSM, and (d) actual versus predicted graph.
Micro hardness
Figure 8 shows the micro hardness profile for the FSWed Al-Mg alloy plates along the traverse direction. It can be observed that highest micro hardness of 82 HV was observed for welded plate number 20 while the low micro hardness value of 70 HV was observed for plate number 17. It is interesting to note the high micro hardness in case of plate number 20 is in line with that of bulk hardness value. Figure 9(a) to (c) shows the micro hardness of Al-Mg alloy welded plate number 20 for different speed ratio and different pin configuration. The highest hardness was observed in case of Speed ratio, rev/mm and for straight square pin configuration. So it can observe that the straight square pin configuration is able to produce severe plastic deformation that is enable material to gain fine grain size. According to Hall-Petch equation, lower the grain strain higher is the yield strength. Here, the yield strength of a material is directly correlated with the hardness. So, the decrease in grain size will help in increase in hardness of the material. In present case due to fine grain in nugget zone which is why are able to achieve high micro hardness in this region. On the other hand as the indentation is made away from the nugget zone the micro hardness is found to decrease. The decrease in hardness of TMAZ when compared to that of NZ can be attributed to coarsening and large sized grains formation. The large sized grains are formed in this region because the excess heat from the NZ is dissipated in this region which can lead to growth of grains.43,44

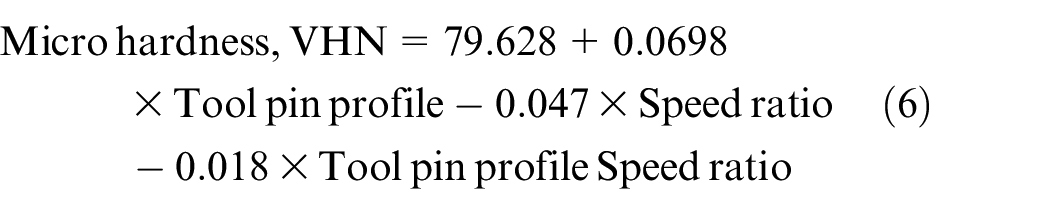
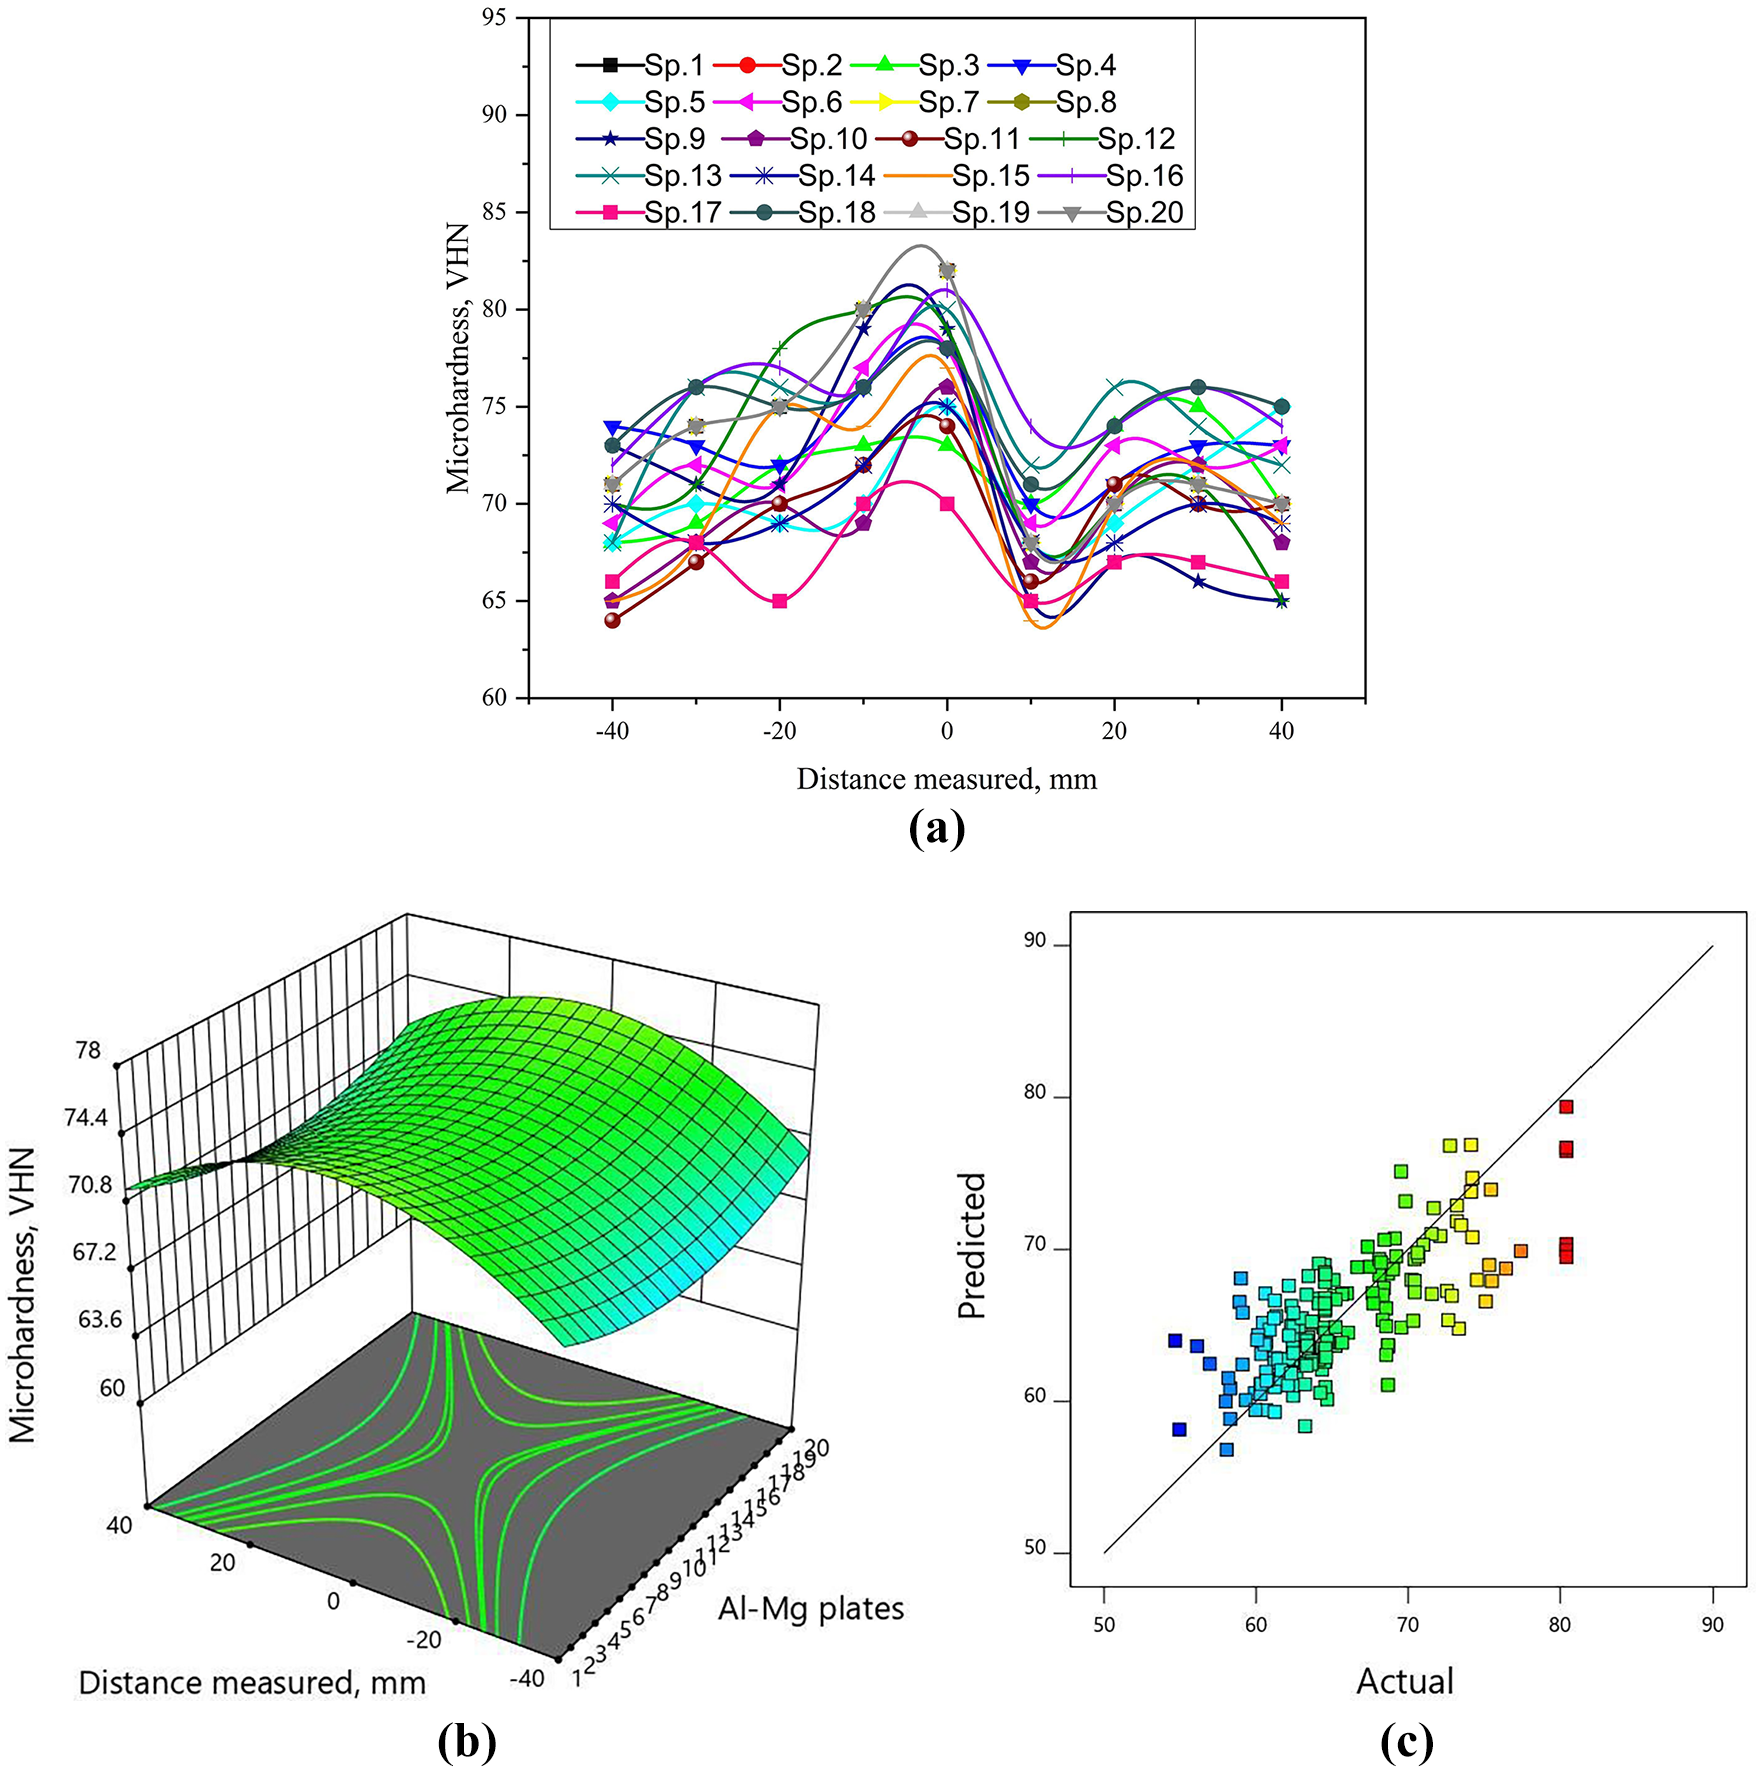
Micro hardness profile measured on friction stir welded specimens of Al-Mg alloy along the transverse direction (a) graph from experiments, (b) 3d surface plots from RSM, and (c) actual versus predicted graph.

Micro hardness corresponding to speed ratio on FSWed specimens of Al-Mg alloy; (a) straight cylindrical profile, (b) tapered cylindrical profile, and (c) straight square profile (d) 3D surface plot from RSM, and (e) experimental versus predicted values.
Tensile properties
The strength of the weld is evaluated from all the 20 Al-Mg welded plates subjected to the tensile testing and is shown in Figure 10(a). The highest tensile strength of 137 MPa was observed for plate number 1, 2, 7, 8, 19, and 20, while the lowest tensile strength of 56 MPa was observed for plate number 10 and 14. The close observation reveals that all the welded plates having high strength values were for plates welded at traverse speed of 40 mm/min and using straight square pin configuration. However, at rotational speed of 1000 rpm yielded in high tensile strength for almost all samples when compared to that of other two rotational speeds. At low rotational speeds very low heat input results in lack of stirring action while in case of very high tool rotational speed affects regular speed due to high heat input. From Figure 10(a), it is quite evident that low and very high tool rotational speed result in defect like porosity on the weld zone. That may be the reason for low tensile strength in lower and upper tool rotational speed of 800 and 1200 rpm respectively. So, at appropriate speed one can expect right heat input which leads to fine grain structure, good weld quality, and defect free weld zone. In the present study, for 1000 rpm tool rotation speed, highest tensile strength is observed. So, along with good quality weld it is observed that the straight square pin results in severe plastic deformation which in turn causes the increase in dislocation density in the weld zone (Figure 10(a)). Such weld joints with optimized process parameters are able to give good metallurgical bonding and result in high tensile strength values. The plates welded with 1000 rpm and 40 mm/min (plate number 1, 2, 7, 8, 19, 20) has highest tensile strength of 137 MPa and its weld efficiency is about 88% of the base metal while for plate number 10 the tensile strength is 56 MPa and its weld efficiency is 37%. The tensile strength and weld efficiency of different FSW specimens are shown in the form of surface plot in Figure 10(b) and (c) respectively. The equation (7) and (8) represent the RSM models used for the prediction of both the properties over the lower and upper constraints of the variables (Figure 10(d)–(e)).
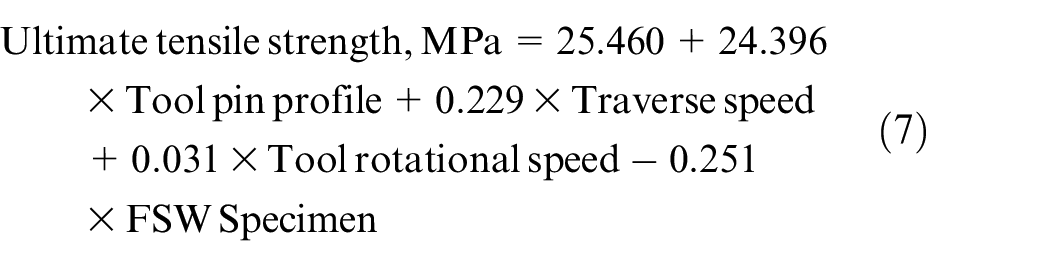


Ultimate tensile strength, Mpa and tensile strength efficiency of FSWed Al-Mg alloy with different parameters as per design matrix (a) Graph from experiments, (b) 3d surface plots from RSM for ultimate tensile strength, Mpa, (c) 3d surface plots from RSM tensile strength efficiency, (d) actual versus predicted graph for ultimate tensile strength, Mpa, and (e) actual versus predicted graph from RSM tensile strength efficiency.
Figures 11 to 13 show the SEM of tensile fractured surfaces of all 20 Al-Mg welded plates. In Figure 11, shows that all the micrographs belong to constant tool rotational speed of 800 rpm but varying traverse speed from 20 to 60 mm/min and different tool pin configuration. It can be seen that welded plate number 13 and 14 showed brittle type fracture but it is observed that the fractured surface had dendritic structures. This indicates that the inter-dendritic cracking is the main fracturing mechanism in case of welded plates fabricated at 20 mm/min using straight cylindrical tool. However, the welded plate number 7 showed brittle fracture but a closer view indicated small ductile dimples. So, one can say macroscopically the failure is brittle but microscopically it is quite ductile.

SEM image of the weld fracture surface in FSW Al-Mg alloy at 800 rpm tool rotational speed.

SEM image of the weld fracture surface in FSW Al-Mg alloy at 1000 rpm tool rotational speed.

SEM image of the weld fracture surface in FSW Al-Mg alloy at 1200 rpm tool rotational speed.
Figure 12 shows the SEM images for Al-Mg welded plates fabricated at constant 1000 rpm but varying traverse speed and tool pin configuration. It is seen that the welded plate number 2, 8, and 19 which displayed highest tensile strength fabricated at 40 mm/min traverse speed using straight square configuration had a ductile failure. From SEM micrographs, it is quite evident that the welded plates welded at 1000 rpm, 40 mm/min and straight square pin configuration displayed ductile failure. The fractured surface showed fine scale populated dimples which clearly indicate ductile type of fracture. On the other hand, the weld plate number 18 fabricated at 20 mm/min using straight square pin configuration displayed a brittle fracture. This is mainly because insufficient metallurgical bonding between the grains at the weld zone leading to brittle fracture.
Fractured surfaces of welded plates fabricated at fixed tool rotational speed of 1200 rpm and varying traverse speed and different pin configuration is shown in Figure 13. It can be observed that the welded plates 16 and 5 fabricated at constant 1200 rpm but varying traverse speed of 20 and 60 mm/min using straight cylindrical pin configuration displayed brittle fracture. Unlike welded plate number 20 which not only displayed highest strength of 137 MPa but also showed ductile failure with fractured surface displaying fine dimples. In almost all cases the fracture mechanism for the welded plates with highest tensile strength showed ductile fracture with the fractured surface comprising of fine equiaxed dimples.45,46
Impact of parameters on properties of Al-Mg alloy
In this section, the optimum process parameters like tool rotation speed of 1000 rpm, traverse speed of 40 mm/min and straight square pin configuration were considered. In each trial, two parameters were fixed and vary the other to check their effect of various properties on welded Al-Mg alloy.
Impact of tool rotational speed
Here, an effort has been made to know the effect of varying tool rotational speed from 800 to 1200 rpm on mechanical properties while the other two parameters were fixed to 40 mm/min and tool pin configuration is straight square pin. It is well known that the increase in tool rotational speed will increase heat input, so it is necessary to obtain moderate amount of heat input to obtain good stirring action, plastic deformation as well proper material flow during the welding process.
Figure 14(a) shows the Surface roughness, µm obtained for Al-Mg welded plate for different tool rotational speed of 800–1200 rpm and fixed traverse speed of 40 mm/min using straight square pin configuration. The rotation speed of 800 rpm has resulted in high surface roughness value of 7.1 Ra while 1000 rpm has resulted in low surface roughness value of 4.9 Ra. Further, Figure 14(b) shows the effect of varying tool rotational speed on Brinell hardness. It is observed that the weld plate fabricated at 1000 rpm has resulted in high Brinell hardness of 80 BHN while the other two tool rotational speed 800 and 1200 rpm has resulted in Brinell hardness of 70 and 72 BHN respectively.

Effect of varying rotational speed, rpm on (a) surface roughness, (b) Brinell hardness, and (c) ultimate tensile strength.
Figure 14(c) shows the ultimate tensile strength for Al-Mg plate for different rotational speed. It can be seen that the weld plate fabricated at 1000 rpm has resulted in highest tensile strength of 132 MPa while the other two speeds have resulted in 90 and 122 MPa respectively. From these results, it can tell that at low tool rotational speed the heat generated is quite low and is inadequate due to strain, the material resulting in poor hardness and strength values. Similarly, higher tool rotational speed result in the significant change in grain size and dissolution of precipitates due to which the mechanical properties are poor when compared to that processed at 1000 rpm.47,48
Impact of traverse speed
The effect of varying tool traverse speed from 20 to 60 mm/min on mechanical properties is studied by fixing the other two parameters tool rotational speed to 1000 rpm and tool pin configuration as straight square pin. In general, with the increase in traverse speed reduces the heat input by reducing the time period of tool and work piece interaction.
Figure 15(a) shows the surface roughness obtained for Al-Mg welded plate for different traverse speed of 20–60 mm/min for a fixed tool rotational speed of 1000 rpm and straight square pin configuration. The traverse speed of 60 mm/min has resulted in high surface roughness value of 7.1 Ra while 40 mm/min has resulted in low surface roughness value of 4.9 Ra. Further, Figure 15(b) shows the effect of varying traverse speed on Brinell hardness of Al-Mg welded plate. Also, observed that the weld plate fabricated at 40 mm/min has resulted in high Brinell hardness of 80 BHN while the other two traverse speed of 20 and 60 mm/min has resulted in Brinell hardness of 72 and 70 BHN respectively. Figure 15(c) shows the ultimate tensile strength obtained at different traverse speed. It can be seen that the weld plate fabricated at 40 mm/min has resulted in high tensile strength of 132 MPa while the other two traverse speed of 20 and 60 mm/min has resulted in 100 and 128 MPa respectively. Here, from these results, it is clear that at moderate traverse speed able to achieve good mechanical properties because it maintains optimum material stirring and flow which will usually results in defect free weld zone. 49

Effect of varying traverse speed on (a) surface roughness, (b) Brinell hardness, (c) ultimate tensile strength, (d) 3d surface plots from RSM for surface roughness, (e) 3d surface plots from RSM for hardness (BHN) BHN, (f) 3d surface plots from RSM for ultimate tensile strength (MPa), (g) Actual versus predicted value from RSM for surface roughness, (h) actual versus predicted value from RSM for hardness, and (i) actual versus predicted value from RSM for ultimate tensile strength (MPa).
The response of surface roughness, tensile strength, and hardness affected by the transverse speed and rotational speed as discussed above is shown in Figure 15(d) to (f). The mathematical relations of RSM mentioned in equations (9) to (11) are of linear type representing the variable relation with the response behavior. Tensile strength and roughness are much more sensitive to the change in rotational speed than the transverse speed. The RSM model used for prediction of these characters with limited readings is found to perfectly match with them as shown in Figure 15(g) to (i).


Effect of tool pin configuration
The effect of varying tool pin configuration namely square straight, square cylindrical, and tapered cylindrical on mechanical properties is studied by while the other two parameters like tool rotational speed to 1000 rpm and tool pin configuration is straight square pin are kept constant.
Figure 16(a) shows the surface roughness obtained for Al-Mg welded plate for different tool pin configuration for a fixed tool rotational speed of 1000 rpm and traverse speed of 40 mm/min. The straight square pin has resulted in low surface roughness value of 4.9 Ra while straight cylindrical and tapered cylindrical has resulted in high surface roughness value of 6 and 4.9 Ra. Further, Figure 16(b) shows the effect of varying tool pin configuration on Brinell hardness. It is observed that the weld plate fabricated using straight square pin has resulted in high Brinell hardness of 80 BHN while the other two square cylindrical and tapered cylindrical has resulted in Brinell hardness of 69 and 75 BHN respectively.

Effect of varying tool pin configuration on (a) surface roughness, (b) Brinell hardness, and (c) ultimate tensile strength, (d) 3d surface plots from RSM for surface roughness, (e) 3d surface plots from RSM for hardness (BHN), (f) 3d surface plots from RSM for ultimate tensile strength (MPa), (g) actual versus predicted value from RSM for surface roughness, (h) actual versus predicted value from RSM for hardness (BHN), and (i) actual versus predicted value from RSM for ultimate tensile strength (MPa).
Figure 16(c) shows the Ultimate tensile strength for Al-Mg plate for different tool pin configuration. It can be seen that the weld plate fabricated using straight square pin configuration has resulted in highest tensile strength of 132 MPa while the other two square cylindrical and tapered cylindrical has resulted in 118 and 100 MPa respectively. From these results, it was noticed that the straight square pin is successful in inducing severe plastic deformation which resulted in significant improvement in strength when compared to other pin profiles. In Figure 16(d) to (f) the surface roughness, tensile strength, and hardness of Al-Mg plate obtained using previous RSM models is used to get the response surface as usual. The toll pin profile is equivalently as effective as rotational speed in changing these characters. The available limited points are though not sufficient, but the CCD takes a specific interval which is fed to understand the relation.
The fractography of weld plate of Al-Mg alloy as shown in Figure 17, is fabricated using straight square pin and tapered cylindrical pin. The SEM micrograph Figure 17(b) reveals the kissing bond like feature in the fracture location. This type of feature is mainly due to insufficient heat generation for proper stirring and flow of materials during welding process. The cylindrical layers of the metal extruded by the tapered cylindrical pin has stuck to each other and formed a kissing bond instead of a weld nugget. This may be the reason for poor tensile strength for tapered cylindrical pin when compared to that of straight square pin.
SEM micrograph of weld plate processed using (a) straight square pin and (b) tapered cylindrical pin.
A confirmation test was conducted on optimum FSW parameters obtained to recheck the mechanical and tribological properties of Al-Mg alloy. Here the optimum parameters obtained are tool rotational speed of 1000 rpm, traverse speed of 40 mm/min and straight square pin configuration.
Macro- and microstructure
Figures 17 and 18 shows the macrostructure and microstructure of Al-Mg weld alloy joint fabricated using optimal FSW parameters. The nugget or stir zone and heat affected zone are clearly seen in macro- and micrograph where both the zone displayed different grain structure (Figure 19(a)). Here, the stir zone as shown in Figure 19(b) is composed of equiaxed fine grains mainly due to dynamic recrystallization process. On the other hand, the base metal zone as shown in Figure 19(c)–(d) is composed of dendritic microstructure and size of grains being significantly larger than that of stir zone. To get a clear picture, the samples were subjected to grain size analysis using electron back scattered (EBSD) technique. Figure 20 shows the SEM microstructure and grain size of the three different zones obtained using EBSD. The average grain size of base metal zone, TMAZ, and NZ are 35.06, 25.25, and 6.14 µm respectively. So, it is quite clear that dynamic recrystallization is taken place in nugget zone leading to formation of fine grains.

Cross-section of FSW joint welded at 1000 rpm, 40 mm/min, and straight square tool.
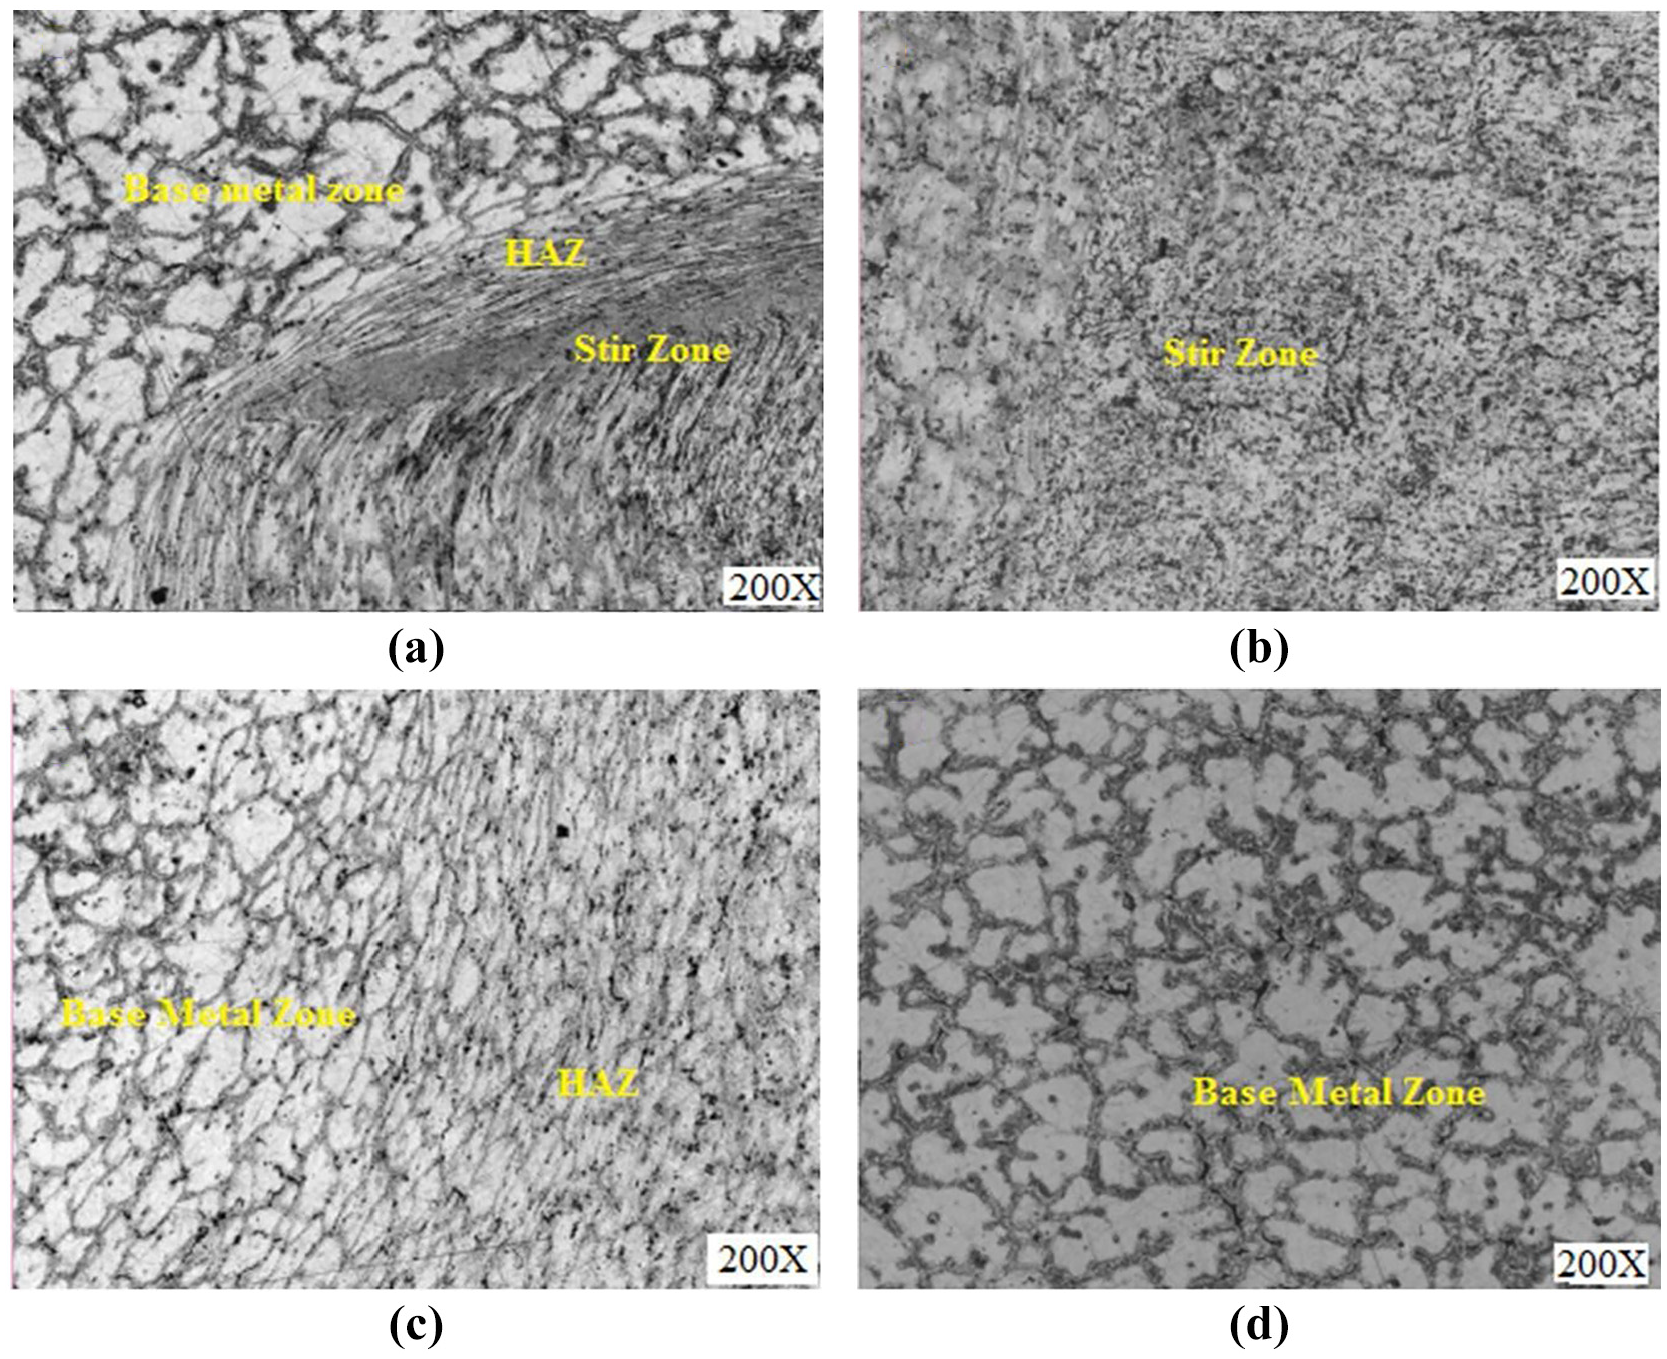
Optical micrographs of the welded zones (a) showing all distinct zones, (b) stir zone, (c) BM and HAZ, and (d) base metal zone.

EBSD images and grain size of Al-Mg alloy processed at optimum FSW parameters.
Mechanical properties
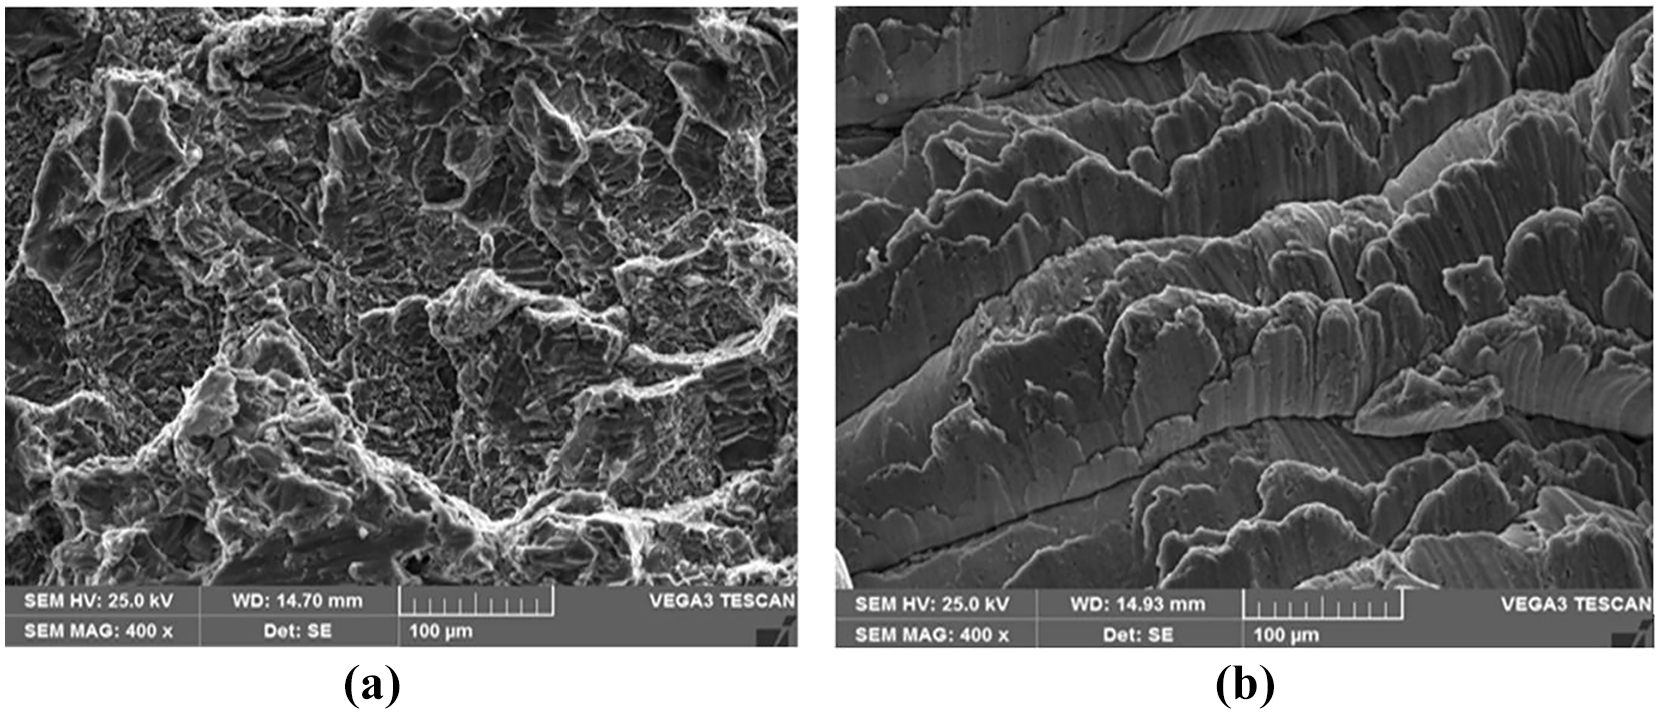
Table 8 shows the mechanical properties like hardness, yield, and tensile strength for Al-Mg alloy welded using optimal FSW parameters. It can be observed that, the yield and tensile strength in the longitudinal direction are almost 1.5 and 1.85 times that obtained in transverse direction. This is mainly due to fine grain size and high dislocation density observed in the weld sample taken in longitudinal direction. Further, the fractographs of fractured Al-Mg plates is shown in Figure 21. It is quite evident from the SEM images that the nugget zone which is composed of fine grains showed a ductile fracture with lot of dimples on the fractured surface. The fine grains formed due to dynamic recrystallization during interplay of severe plastic deformation and friction heat generated in this region. These fine grains are equiaxed in nature and have large fraction of high-angle grain boundary. So, in this phenomenon in which fine grains are formed are directly correlated with the strength of the material which is generally given by the Hall-Petch equation. This equation informs that with the decrease in grain size leads to increase in yield strength of the materials. So, decrease in grain size in the FSW region especially in nugget zone helps in increasing the yield as well as tensile strength of Al-Mg welded plate.50,51
Mechanical properties obtained at optimum FSW parameters.


SEM micrographs of fracture surface of Al-Mg alloy welded with optimized process parameters (a) nugget zone, (b) fine grains, and (c) high-angle grain boundary.
ANN modeling
Since most industrial activities are complicated, non-linear, and have a large number of parameters, there is no close mathematical model that can accurately describe their behavior. Artificial neural networks (ANN) as they are cost-effective, simple to understand and have the capacity to learn from samples, have found numerous applications in process modeling for management and surveillance, as intelligent sensors, to predict parameters that cannot be evaluated on-line, in dynamic system characterization, and, finally, in process optimization.
ANNs are mathematical models that simulate the operation of a biological network made up of neurons and are employed to tackle complicated problems in a variety of applications. The system is divided into three layers input, hidden, and output. The input layer is made up of all of the independent variables. The data out from input layer is then analyzed via the hidden layers before being processed in the terminal (output) layer. Neural networks are made up of simple synchronous processing units biologically motivated nerve systems. The neuron is the fundamental unit of the ANN. Neurons is linked together by linkages called synapses, and each synapse has a weight factor associated with it. The neural network model in this work was trained using the Levenberg-Marquardt Algorithm.
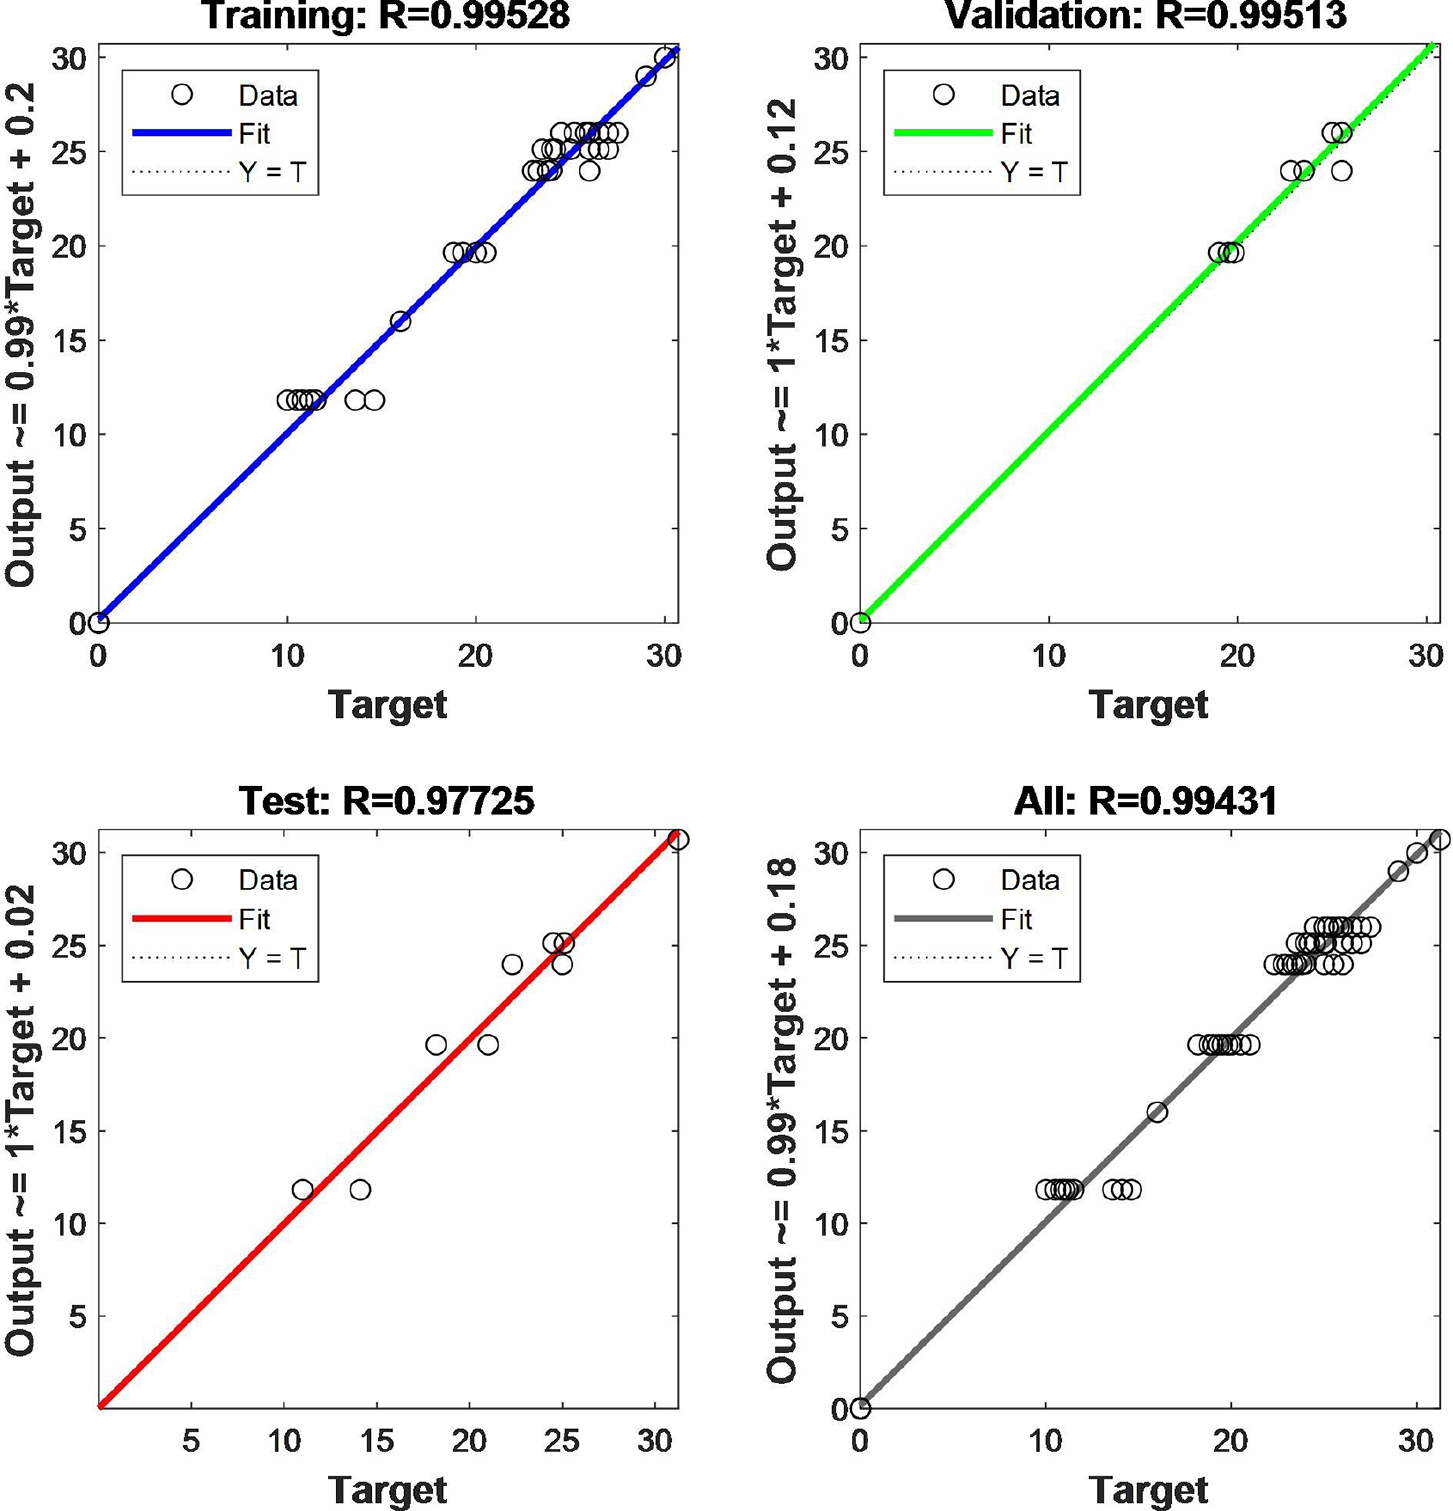
The friction stir welding process parameters were predicted using ANN in this study. Figure 22 depicts the ANN architecture. It consists of an input layer for independent variable, hidden layers, and an output layer for outputs. An ANN model was created to train the enormous datasets utilizing the traingdx (feed forward back propagation) training technique, the learngdm adaption learning function, and hyperbolic tansig as the transfer function. MSE was utilized as a success metric. The training of the created ANN model was terminated after “five hundred” iterations, “zero” error 1×e-6 gradient value, and “100” validation error number. During the training of the ANN in this article, both input and output values were included into the process. The MSE is computed by comparing the test results to the modeled network’s performance metrics. The weight values between the network nodes were modified as a result of this error statement. The network is trained when the weight values converge. Figure 23 depicts the trained network model’s preparation, validation, analysis, and general regression analyses.

General ANN architecture.
Neural network training regression analysis (Optimal performance at 30 neurons for Brinell hardness number).
For training, preparation, and validation data, the correlation coefficients of ANN models are shown in Figures 23 and 24. To reduce the MSE performance function between ANN outputs and the target data, the artificial neural network (ANN) was trained iteratively. It has been shown that ANN modeling with fewer neurons in the hidden layer is more efficient than other methods. Densely packed hidden layer architectures were used to estimate the ANN modeling results for surface roughness, Brinell hardness and ultimate tensile strength using 30 neurons, 35 neurons, and 40 neurons in the hidden layer architectures, respectively (see Figure 24). Comparing the test data with the expected data from the ANN is a crucial step. As can be seen, ANN’s evaluation of the outcome is far superior to other methods.

Neural network training regression analysis (Optimal performance at 30 neurons for weld efficiency).
Conclusion
This investigation has demonstrated that the overall weld quality of Friction stir welded Al-Mg alloy is majorly dependent on the flow behavior of the softened material in the NZ, this behavior is predominantly influenced by welding parameters tool rotation, welding speeds, and pin profile. On the basis of a design matrix, the structural and mechanical properties of all fabricated joints were evaluated considering these parameters and they were optimized in the study. Later, the effect of each process parameter on the properties of the materials has been studied. Within the purview of the study conducted, the following conclusions can be drawn;
The results clarified that the pin profile affects the material flow, which in turn weld quality. The strongest joint was produced using the tool with straight square pin configuration, regardless of process parameters.
Optimized geometry of straight square pin at a welding speed of 40 mm/min and a rotational speed of 1000 rpm was obtained. Sound joints without defects were attained based on the optimum geometrical structure. This optimal combination resulted with enhanced tensile strength (136.25 MPa), bulk hardness (80.41BHN), and microhardness (82 VHN) compared to the rest.
Response surface methodology supported the fact that the tool pin configuration and process parameters are important and has potential to reduce defects and improve joint quality.
ANN modeling provided a better prediction of the non-linear form of critical data. The various correlation estimated by ANN is found to be reasonably consistent with the experimental findings.
Footnotes
Acknowledgements
The authors extend their appreciation to the Deanship of Scientific Research at King Khalid University (KKU) for funding this research through the Research Group Program Under the Grant Number: (R.G.P.1/382/42). The author B. Saleh is grateful to the Taif University Researchers Supporting Project number (TURSP-2020/49), Taif University, Taif, Saudi Arabia for the financial support.
Handling Editor: Chenhui Liang
Declaration of conflicting interests
The author(s) declared no potential conflicts of interest with respect to the research, authorship, and/or publication of this article.
Data Availability
Based on request data will be provided by the corresponding author