
Abstract
Healthy operation of the tail rope is crucial to the stable and safe operation of a friction hoisting system. Failure of the tail rope will threaten the property and personnel. In this study, a fault diagnosis algorithm based on deep learning is proposed for the tail rope. Specifically, we add a spatial attention mechanism in the feature extraction stage to assign different weights to different regions in images. This way “guides” the model to focus on more important regions. A class-balance cross-entropy loss is introduced to alleviate the imbalanced data distribution in the actual conditions for enhancing the robustness of the algorithm and its transferability in practical applications. Experimental studies are conducted to validate the algorithm. The accuracy of the algorithm on the conducted dataset is 99.4819%. The accuracy of the provided algorithm is increased by 10% and 7% compared with those of the hand-crafted features, namely, scale-invariant feature transform with support vector machine and random forest, respectively. Results show that the proposed algorithm can meet the requirements of high accuracy and generalization in practical engineering applications.
Introduction
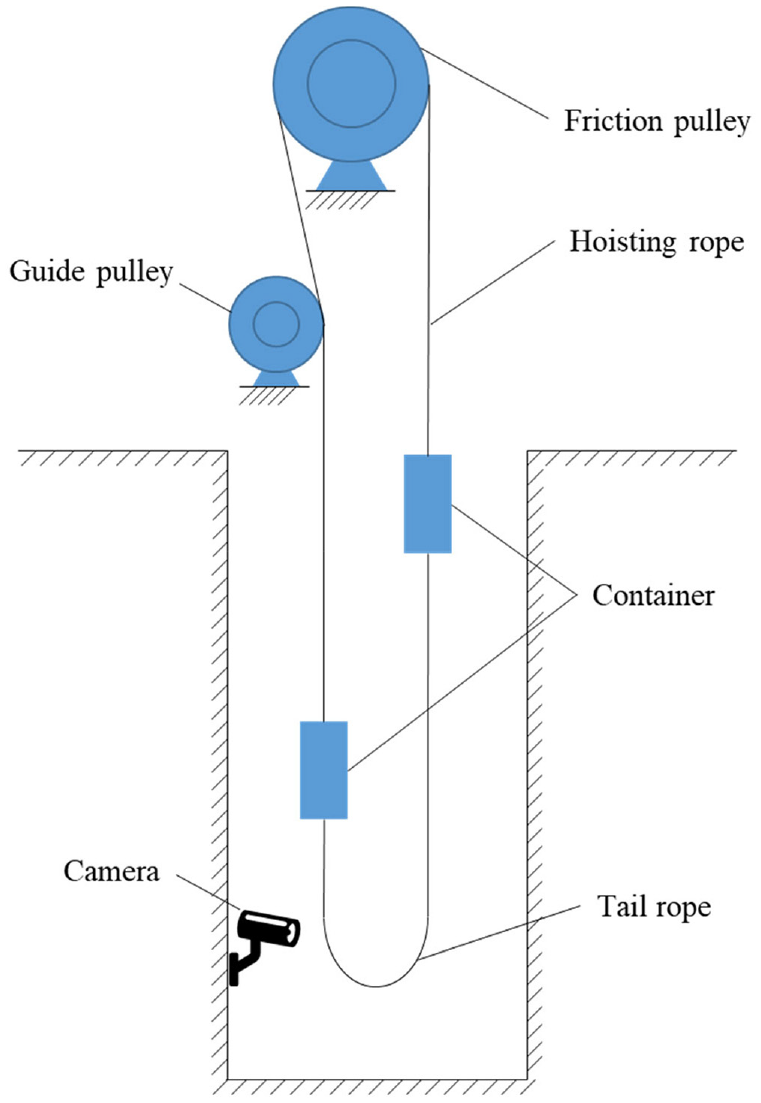
The mine hoisting system is an important conveying equipment in mine production, and it is responsible for transporting personnel, coal, gangue, related equipment, and materials between the surface and the underground. It may be separated into two types according to the operating principle and structure: the winding hoisting system and the friction hoisting system. The friction hoisting system is widely used because of its advantages of small space occupation, light quality, and high lifting efficiency. It is generally composed of a friction pulley, hoisting ropes, hoisting containers, tail ropes, and other parts, as shown in Figure 1. Safety of the mine hoisting system is critical to the overall mine production system. The tail rope, which is an essential key component in the mine hoisting system, balances the tension difference between the lifting and lowering side wire ropes during the operation by changing its own weight. According to statistics from 2013 to 2017, 1945 fatal accidents of various types occurred in Chinese coal mines, which resulted in 3771 deaths; 340 were due to wire rope accidents, which accounted for 17.48% of all deaths. 1 Many countries and departments have developed corresponding national standards or industry regulations for the use of wire ropes to reduce and avoid damage to equipment and people caused by wire ropes in use. The influence of operational state of the wire rope on the equipment and its hazard cannot be overlooked because it will directly affect safety and stability of the whole hoisting system. As can be seen, the tail rope is also a major source of failure in the mine hoisting system. If the tail rope fails, it may cause a chain reaction, or even an accident in severe cases, causes irreparable losses to personnel and equipment. Therefore, achieving the fault diagnosis of the tail rope is essential to maintain the stable operation of the mine hoisting system.

Diagram of multi-rope friction hoist and hoisting system.
The conventional fault detection method of the tail rope is manual detection method. This method primarily relies on extensive experience of the staff in detecting and troubleshooting faults of the tail rope by observation, hand contact, knocking, and other means. Manual detection method is a static off-line detection and has high workload and low efficiency. These conditions result in long idle running time of the equipment, which reduces production efficiency. The working environment is also dangerous. Some other detection methods are available, such as magnetic detection method,2,3 X-ray method, 4 acoustic emission method, 5 and eddy current detection method, 6 etc. Although these methods can reduce the workload of personnel to a certain extent, their accuracy is limited by the sensor time lag. Maintaining the continuous and reliable operation of these sensors under complex working conditions is also a problem due to the large number of sensors required. In short, the equipment required by these detection methods is complicated in structure, expensive in cost, and demanding on working conditions and has not been applied in the online fault detection of tail ropes.
Machine vision has been widely applied in the field of industrial production. It employs vision devices to capture target information and converts it into input signals for downstream control systems. And deep learning has emerged as the current state-of-the-art technique for many fields in the past decade. Thus, traditional industrial production monitoring techniques based on vision have been offered opportunities. Machine vision is used in quality inspections in industrial production lines, such as identification of printing matter on outer package, 7 wood surface defects, 8 glass defects, 9 and casting surface defects. 10 In the steel production line, visual automatic counting of steel bars is used to replace the existing mechanical counting. 11 During the machining process, it replaces the electron microscope to detect the tool wear area and reduces the cost of inspection. 12 In addition, image processing technology can be used to diagnose damage. Various texture analysis techniques have been proposed to analyze the surface texture of components.13,14 Li et al. 15 converted the vibration signals of the reciprocating compressor into time-frequency images, and the gray-level co-occurrence matrix and histogram of oriented gradient features were extracted from the images for fault diagnosis. Long et al. 16 established the mapping relationship between the motor faults and the intuitive features of the image through symmetrized dot pattern and scale-invariant feature transform (SIFT). Jha and Swami 17 enhanced the image textures by wave atom transform. Simulation results justified that the performance of classification model was greatly improved. Kim et al. 18 proposed a deep convolutional neural network-based damage locating method to classify the steel frame into damaged and undamaged by identifying the damage location on the surface of the steel frame. Machine vision is widely used in the field of coal mines, such as mineral type recognition, roadway deformation monitoring, unmanned mine electric locomotives, foreign body recognition in coal, 19 belt damage detection, 20 belt deviation detection, and idler failure detection, because of its easy installation, simple maintenance, and intuitiveness. Tessier et al. 21 proposed a general method for the classification of mineral mixture components by using principal component analysis and wavelet texture analysis to extract color and texture features and support vector machine (SVM) 22 to achieve the classification. Yang et al. 23 proposed a gray-level average method for fast segmentation of conveyor belt and background. The deviation angle and offset were designed as the deviation feature by mapping the binary image of the mining conveyor belt to a one-dimensional fault feature function to realize the visual online detection of the conveyor belt deviation fault. Klippel et al. 24 collected images of the conveyor belt in real time and used edge AI with the MobileNet deep learning model to detect longitudinal rip on belt. Zhang et al. 25 processed the images of coal, coal gangue, and rocks with two-dimensional discrete wavelet transform and decomposed them based on the steerable pyramid decomposition. The maximum likelihood estimation method was used to determine the coal and rock types. Wang and Lin 26 from Central South University used the “3-neighborhood” search method to obtain the coordinate value of the track line. Then, they extended a certain distance to the outside of the track according to the distance information to extract the effective detection area while gridding the image, converting the coordinates of the obstacle to the actual distance, and using YOLOv3 27 to detect the effective detection area for realizing the obstacle real-time detection and localization. Related deep learning-based works can automatically extract features compared with the previous methods. Thus, they lead to efficient and accurate classification and real-time monitoring while avoiding long-term work in harsh environments. Therefore, we aim to employ the robust representation of deep convolutional neural networks for handling the issue of the tail rope monitoring. For this purpose, we propose a method based on image recognition technology that can achieve remarkable and real-time performance with strong robustness on recognizing the fault diagnosis of the tail rope.
Two difficulties need to be resolved to accurately classify the tail rope fault based on vision method. First, the real-world situation is limited, which causes difficulty in capturing adequate samples at anomalous state compared with the normal ones. In other words, this work is an imbalanced classification task. Second, the image acquisition conditions are limited due to the extremely small difference of some fault images and the particularity of the underground environment. Therefore, the similarity between the classes of the faults under actual working conditions is very high, and the general classification model cannot extract the highly discriminative features and thus performs poorly.
The main contributions of this work are as follows. 1. We build an experimental platform to collect the failure state images by simulating the possible failure of the tail rope under real working conditions, and a failure state dataset containing 3087 images is constructed. 2. We design a fault diagnosis model of the tail rope based on deep learning. An online data augmentation strategy is designed to alleviate the limited numbers of data. A classification loss function based on category weighting is used to solve the problem of sample imbalance in different categories. In order to capture discriminative features, an attention module is designed to “pay attention” to those areas that are really different from other fault state images. 3. We evaluate the proposed method on the constructed dataset. The results show that the algorithm can obtain an accuracy of 99.4819%, which outperforms that of traditional feature-based classification approaches with a large margin. Further ablation experiments and visualization results validate the effectiveness of the modules designed in this work. A traditional sensor-based state monitoring method or a state recognition method based on traditional visual feature extraction technology is difficult to practically apply due to the low accuracy of the algorithm and poor robustness. Nevertheless, visual monitoring based on deep learning can avoid these problems to a certain extent. It can reduce the workload of personnel, save downtime, and improve the efficiency of fault diagnosis, which play a significant role in the tail rope monitoring.
The rest of the paper is organized as follows. Chapter 2 introduces the proposed tail rope diagnosis algorithm based on spatial attention mechanism and class-balance loss. Chapter 3 introduces the experimental results and analysis of the proposed algorithm, and the algorithm is compared with other diagnostic models. Chapter 4 provides the research conclusions.
Fault diagnosis algorithm for tail ropes based on spatial attention mechanismand class-balance loss
Algorithm introduction
This study aims to accomplish fault diagnosis of the tail rope through a classification model based on a convolutional neural network. The proposed model mainly includes two parts: the backbone network and the classifier. The former is used to extract features from the images, and the latter intends to conduct classification based on the features.
Backbone network
The development of deep learning can be regarded as the continuous progress of the backbone network to a certain extent. In the past decade, many classic and effective feature extraction networks have emerged, such as AlexNet, 28 VGG-Net, 29 InceptionNet, 30 ResNet, 31 and ResNeXt. 32 The fault diagnosis of the tail rope involved in this study mainly has the following three characteristics:
The goal of this study is to train the classification model through simulated images for achieving accurate recognition of faults of the tail rope while considering the speed.
This study designs a platform to simulate the states of the tail rope in the real working scene as realistic as possible because of the difficulty in obtaining the fault data of the tail rope under actual working conditions.
Images of the tail rope in different states may have high intra-class similarity. Thus, we hope that the model can extract discriminative features that are different from other categories.
Therefore, the backbone network should have the following three characteristics:
The number of parameters of the network should not be too large to avoid overfitting and ensure the inference speed.
The model should be easy to train to avoid the increase in optimization difficulty caused by the vanishment of the gradient or the gradient dispersion problem caused by the increase in the model depth.
The model should be extensible and convenient to add target operations.
Baseline feature extractor
Considering the task requirements, data volume and optimization difficulty, we select ResNet as the baseline feature extractor. As a basic component of ResNet, a typical Residual Block structure is shown in Figure 2, which mainly includes input layer, skip connection, and output layer.

Schematic of the residual block.
The mathematical expression of the Residual Block is shown in equation (1):

where

Structure diagram of ResNet-18.
Spatial attention module
As aforementioned, our goal is to identify the statuses of the tail rope. However, only slight differences may exist between the different states of the tail rope in actual working conditions, as shown in Figure 4. At the same time, the classification task is to recognize content at the image level. Thus, the network has limited ability to capture and process detailed information, which is precisely an important aspect that affects the accuracy of the task.

High intra-class similarity of different states of tail ropes. The left side shows the image of the too small spacing, and the right side shows the image of the target in the twisted rope state.
On this basis, we incorporate a spatial attention mechanism into the feature extraction stage, that is, different weights are assigned to different regions of the image to “guide” the model to focus on the regions with more discriminative and significant features. The attention mechanism has a wide range of applications in computer vision and natural language processing.33–39 With reference to previous work and combined with task requirements to avoid introducing a large number of parameters for the model, we design the spatial attention module (SAM) shown in Figure 5.
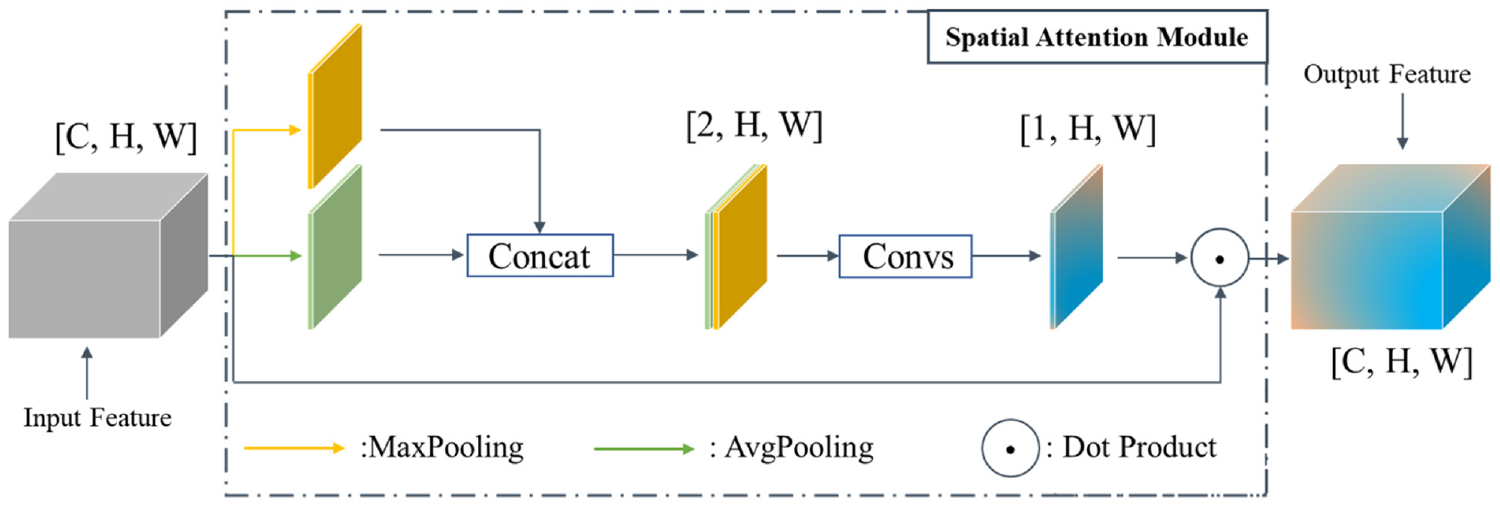
Spatial attention module.
The expression of the process is given as follows:

Where

Equation (3) maps the input value to a value between [0, 1], that is, attention weight. The value closer to 1 means the network pays more attention to the area, and vice versa. Notably, the designed spatial attention mechanism contains only
Classification model
Classifier
The classifier classifies the features extracted by the backbone network and obtains the image level prediction. Here, we use fully connected layers to build the classifier. The whole classification model is shown in Figure 6. Considering the trade-off between the overall accuracy and computational overhead, we barely insert the SAM module in the middle stage of the feature extractor. Considering the large number of parameters introduced by stacked fully-connected layers, we do not directly stretch the feature map extracted from the backbone network into a vector. Instead, we use Global Average Pooling to reduce its dimensionality and then connect the subsequent the classification layer.

Classification model used in this study. SAM denotes the spatial attention module designed in this paper; GAP denotes the global average pooling operation.
Loss function
The loss function or objective function is the key to optimize the network. For the multi-category image classification task we are dealing with, the commonly used cross-entropy loss can be selected to complete the network learning process. However, considering that the distribution of different states of tail ropes varies in real situations, the probability of occurrence of some states is much smaller than that of other categories, that is, a problem of class-imbalance exists. In order to improve the robustness of the model in practical applications, we revise the basic cross-entropy loss by adding weighted factor and obtain the class-balance cross-entropy loss shown in equation (4). Specifically, the entire loss function is weighted based on the distribution. The categories with adequate samples are prone to be classified accurately and thus have smaller weights in the optimization while the categories with fewer data should have larger weights. This setting can avoid the tendency of the network to predict trivial solutions of multi-sample categories to a certain extent, and it can improve the generalization ability of the model.

where

where
Data processing
The sample capacity is limited given that the data used in this study are collected from the simulation platform. However, the image recognition algorithm based on deep learning is data driven. Accordingly, we adopt the relevant data augmentation method to obtain more sufficient samples for model training.
Data collection
Completeness and diversity of data in the database are the prerequisite for training the image recognition model based on deep learning. The typical phenomena when the tail rope fails need to be summarized and the harmful and typical fault types should be extracted to conduct simulation experiments for ensuring closeness of data in the database to the fault status under actual operating conditions.
The distance between the two sides of the tail rope is reasonable with no excessive bending in the rope during the normal operation of the hoist. However, the instability of the electronic control system or the brake system will cause the tail rope to swing violently when the hoist is started and stopped. At this time, the left and right sides of the tail rope are very close with obvious bending in the rope. The longer side may be trapped by the shorter side due to the inconsistent swing amplitude of the two sides of the tail rope during operation. Then, the tail rope is twisted at this time. The tail rope easily scratches with other equipment because of the high-speed operation of the hoist. Long-term abrasion will also cause broken strands of the rope. The tail rope will suddenly break under the action of the motion inertia when the hoist is stopped in an emergency with the accumulation of damage.
In the actual operation of the hoisting system, the tail rope has been underground with complex environment for a long time. Thus, obtaining a large amount of real-time data for network training is difficult. This study intends to build a simple experimental platform for simulating fault states of the tail rope and use a camera for taking pictures to obtain sufficient experimental data. The operating environment of the tail rope is dark, and its swing range is large. Thus, the distance between the camera and the tail rope should be adjusted appropriately during the shooting process to obtain pictures closer to the actual operation of the tail rope. This way can increase the diversity of sample size and improve the accuracy of algorithm learning. The camera position, which is placed in the vicinity of the tail rope, is shown in Figure 7. The number of normal samples in actual engineering applications will be much larger than the number of fault samples, that is, the number of samples with normal spacing will be much larger than the number of other types of samples. The probability of different types of fault states is also different. This data imbalance will cause the model to fall into a trivial solution, which greatly challenges the accurate classification of the model. After combining the abovementioned analysis and the faults that may occur in the operation of the tail rope, the database built in this study contains the following five statuses of the tail ropes: normal, too small spacing, broken strands, twisted rope, and broken rope. Broken strands are divided into broken strands on the left side of the rope, on the right side of the rope, and on both sides of the rope. Twisted rope includes tail rope with single winding point and multiple winding points. Broken rope is divided into the broken rope on one side and the broken rope on both sides. We have taken images according to these states that will occur under actual working conditions, and the sample images of each category are shown in Figure 8.
Schematic of image acquisition of multi-rope friction hoist tail rope.
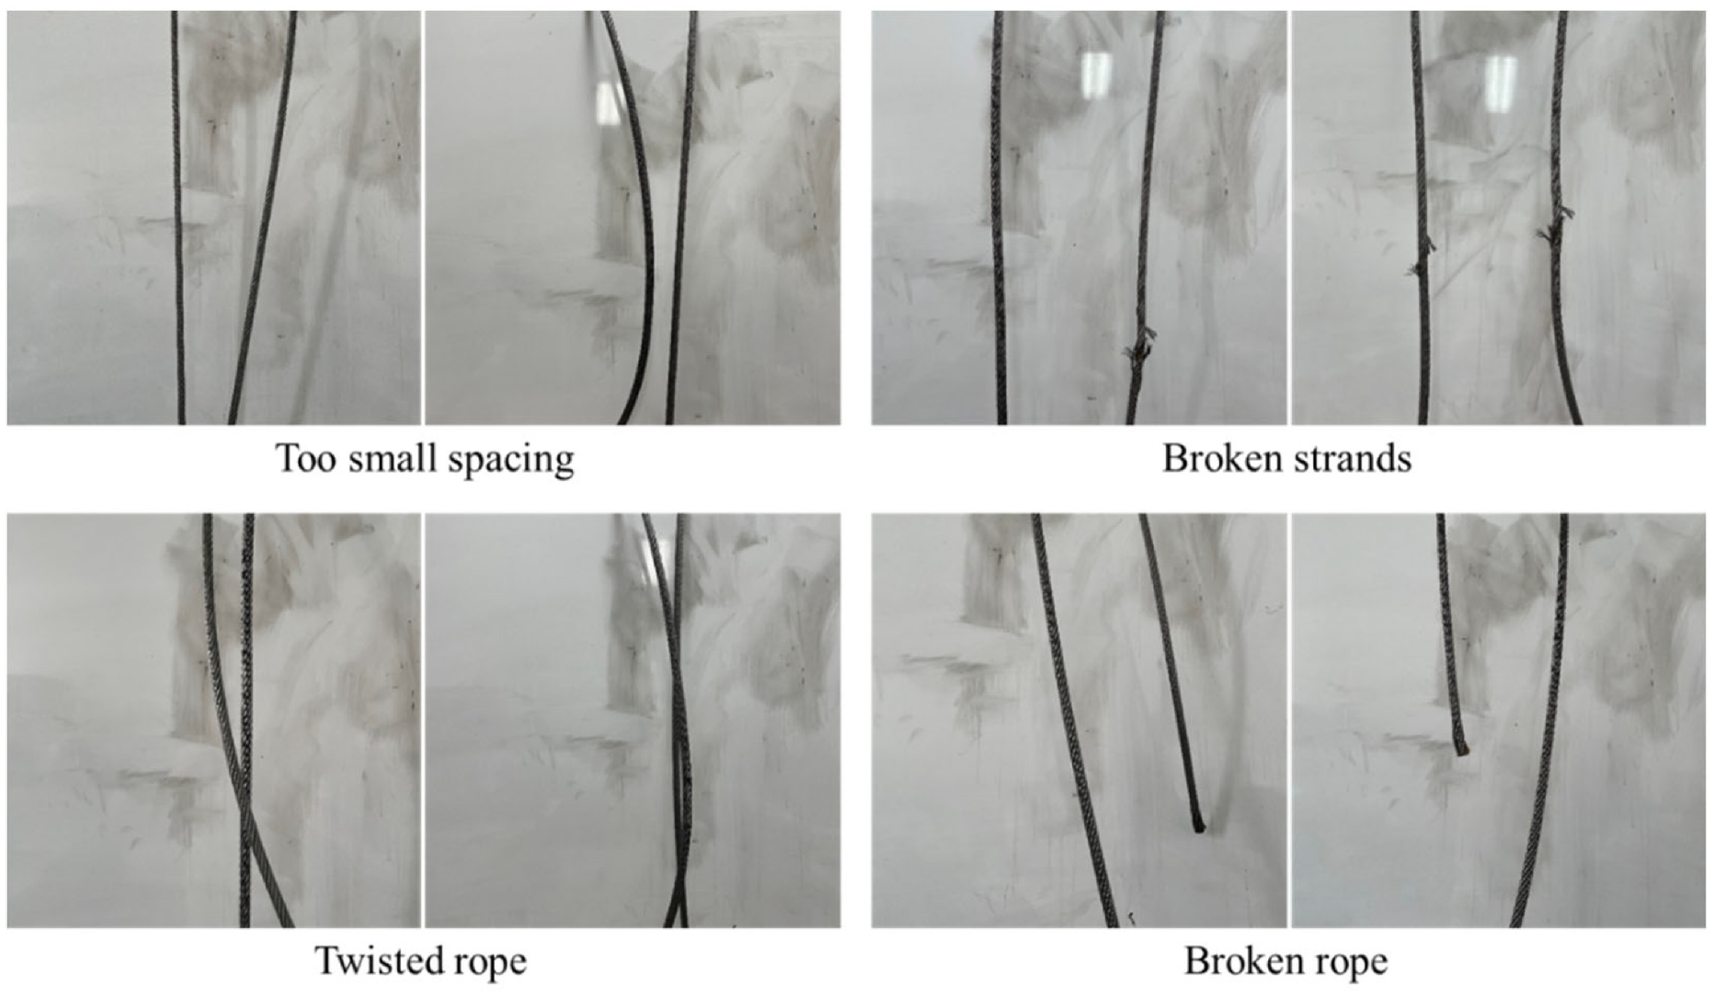
Diagram of tail rope failure.
Dataset partitioning
The task of fault diagnosis of the tail rope in this study includes two parts: model training and inference (i.e. predicting the category of input image). The former uses labeled samples for classifier training, and the latter uses test data to complete the test for evaluating the performance of the model. In this study, the 3087 images collected are split into training and test sets according to the ratio of 7:3 to complete the two tasks, respectively.
Dataset widening
As mentioned earlier, the data we obtain on the simulation platform are limited. Thus, we expand the data to some extent with the help of data augmentation techniques. The following four augmentation methods are mainly used in this study.
Random cropping: a subregion of 256 × 256 is randomly cropped for output after changing the original image size to 288 × 288.
Random flipping in horizontal direction: whether the current input image needs to be flipped to flat according to the preset probability p is determined.
Add noise: random noise is added to the input image.
Color dithering: the brightness, contrast, saturation, and hue of the image are changed randomly.
Figure 9 shows the augmented image obtained by the four image augmentation methods.

Original image and results of four image expansion methods. From left to right, the original image, the image after the subsequent crop, the image after the horizontal flip, the image with Gaussian noise added, and the image with contrast and brightness changed.
During the experiment, data augmentation processing is performed online. Specifically, we only save the original image locally and use random numbers to control the augmentation method of the current input image during network training. This way improves the robustness of the model and saves space.
Overall processing flow
On the basis of the content introduced in the two sections above, we present here the processing flow of the entire framework from data input to prediction result output, as shown in Figure 10.
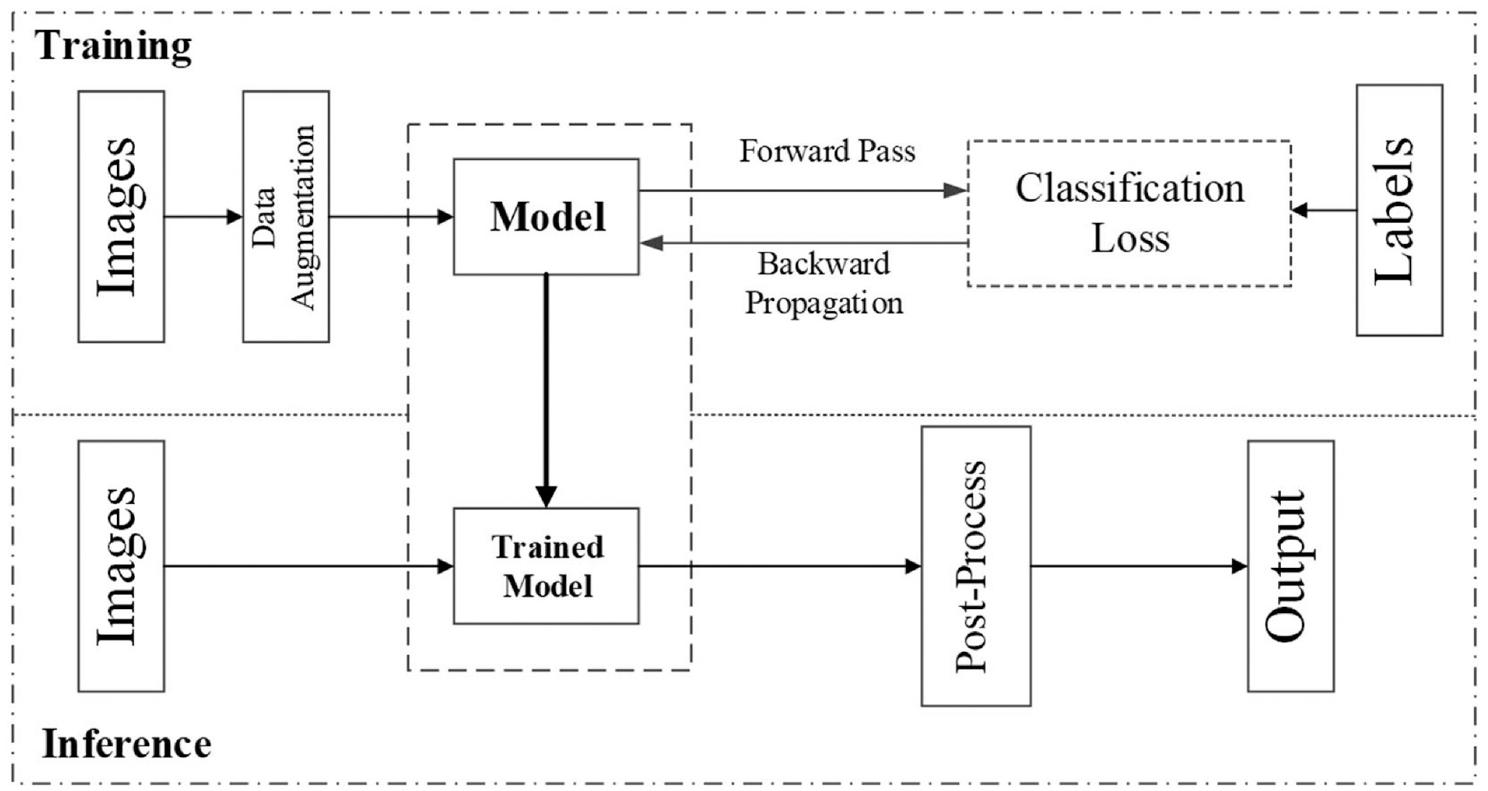
Data processing flow. The top part demonstrates the training steps of our method. Images with corresponding labels are fed into the model. Then, the loss could be obtained by calculating the difference between predicted labels and ground truth ones. Thereafter, the gradient produced from the training loss will be backpropagated to update the network parameters. The bottom part represents the inference stage of our algorithm. Test images are fed into to the loaded training model to produce prediction.
Experimental results and analysis
Experimental environment and experimental setup
Experimental environment
We build a simulation platform, including a camera, tail ropes, a background plat, and a LED light supplement lamp. Ultimately, the fault images are acquired under low illumination, which resembles the authentic operating condition. The shooting camera is fixed during the collection.
The experimental environment in this study is as follows: System: Ubuntu 16.04. Hardware environment: graphics card: one NVIDIA GeForce RTX 2070 graphics card; CPU: AMD Ryzen5 2600X; memory: 16 GB. Software environment: CUDA10.2, CuDNN7.6.5, Pytorch1.5.
Experimental setup
The basic backbone network loads the weights of the classification model pre-trained on the ImageNet 40 dataset to accelerate the fitting speed and efficiency of the model, and the parameters of the attention module and the classifier are initialized with the He initialization. 41 The batch size during network training is set to 32. The initial learning rate is set to 0.001, and the learning rate decays to 0.1 times at the 600th and 800th iterations. At the same time, warmup learning rate mechanism 42 is used to avoid the instability of the model in the initial training stage. The loss of the model on the training set is shown in Figure 11. The loss is already small at the beginning of the training owing to the pre-training weights of the classification network obtained by training on a large dataset. The network converges quickly where the loss is reduced to a fairly small value at around 600 iterations.

Variation in training set loss.
Model evaluation and experimental results
Model performance evaluation metrics
Considering that we are performing a fault diagnosis task of tail rope, the accuracy metric is used as the main measure in this study, as shown in equation (6):

In addition, in order to reflect the comparison between the model’s prediction and the real label, we also use the confusion matrix to show the correlation of classification results.
Experimental results
This section mainly illustrates and analyzes the results of the proposed classification model of fault diagnosis of tail rope on the tail rope state dataset constructed. We also refer to traditional visual processing methods to extract SIFT 43 features from the dataset images for training SVM and random forest (RF) 44 classifiers. A direct comparison shows the effectiveness of the model based on deep learning proposed in this study. Furthermore, the related visualization results also demonstrate the effectiveness of the spatial attention mechanism used in this study.
Classification results
The classification performance of the proposed approach on the constructed test set is shown in Table 1. Our model is based on the deep learning. We further add the experimental results of two traditional algorithms, namely, SVM and RF, to highlight the effectiveness of the method. Compared with the traditional feature extraction and classifier recognition algorithms, the accuracy of the proposed tail rope fault diagnosis algorithm based on the convolutional neural network is about 7 to 10 percentage points higher (89.2919% vs 99.4819%). RF, which is a kind of boosting algorithm, completes the task of sample classification by constructing multiple decision tree classifiers. Its accuracy on the dataset constructed in this study considerably exceeds that of a single SVM classifier. However, traditional visual processing relies on human prior feature operator selection and classifier optimization, which lead to poor generalization performance. The powerful feature extraction capabilities of CNN alleviate this problem to a great extent. Its excellent fitting capabilities and powerful high-dimensional feature representation ensure the performance of the classifier.
Comparison of the classification performance of each model.

SIFT denotes the feature operator used to train the classifier; SVM and RF denote the classifier; DA denotes the data augmentation process; Ours denotes the complete model proposed in this study.
We count the classification results of the model on the test set and plot the confusion matrix to show the classification of the three models more intuitively. The result is shown in Figure 12. The main diagonal element of each confusion matrix represents the number of samples that are correctly classified in the current category. The CNN-based tail rope fault diagnosis algorithm proposed in this study has only three samples that identify errors. When the tail rope is twisted, the network mistakenly judges that the distance is too small. This result may be due to that depth information of the tail rope state images taken from a single angle of view cannot be obtained, which leads to incorrect classification of the model.

Confusion matrices of the classification results of the three algorithms. (a–c) Represent the confusion matrices of the classification results of SVM, RF, and the proposed model in this study, respectively. Break-S means broken strands; Break-R means broken rope.
And to fully validate our approach, we use K-fold technique45,46 to conduct the training and testing. Specifically, we conduct extra five times of experiments while keeping the current split setting, that is, 7:3 for training and testing. The overall results for six times of experiments are shown in Table 2. Even if we select different samples in our dataset to conduct training, our model can obtain an impressive performance on the test set. This performance further demonstrates the robustness and effectiveness of our method.
Overall performance of our method with K-fold data split settings.

Ablation studies
The proposed algorithm can be summarized into four parts, namely, the basic classification model, SAM, data augmentation processing, and class-balance loss used to optimize the imbalanced classification problem. We conduct ablation experiments to verify the improvement in the classification performance of these modules, and the results are shown in Table 3. In our implementations, the baseline model means a basic feature extractor and a classifier, which is optimized with general cross-entropy loss. It is noting that this baseline could be used to classify the fault images of tail ropes, and we add different modules to the baseline model to conduct corresponding ablation studies.
Performance improvement brought by each module in the designed algorithm in this study.

BaselineCNN means that only ResNet-18 is used as the basic classifier of the backbone network; SAM means attention module; DA means data augmentation processing; Ours means a complete model with imbalanced classification loss function added.
As shown in Table 3, the basic classifier built with ResNet-18 can also achieve quite good classification performance. Its performance surpasses that of the classification model based on traditional visual feature extraction. Adding spatial attention enables the network to extract the most discriminative features for each type of targets. This way improves the feature representation ability in the hidden space. The data augmentation strategy increases the number of samples. This way further enhances the invariance of the network and the generalization of the model, which result in the greatest accuracy improvement. The weighted cross-entropy loss avoids the model from falling into a trivial solution, which also contributes to the increase in the overall performance.
Visualization of SAM
As mentioned in the previous section, we design a SAM that guides the model to mine valuable areas, namely, the most characteristic part of each state is highlighted. This way recognizes the tail ropes that may have only subtle differences. The ablation experiments in Table 2 have proven that the SAM designed in this study can improve the classification performance to a certain extent. In order to better verify the original intention of the module, we randomly select the images of each state in the test set and use GradCAM 37 visualization to highlight the area that the model is concerned about in making the decision (i.e. the classification result). The results are shown in Figure 13.
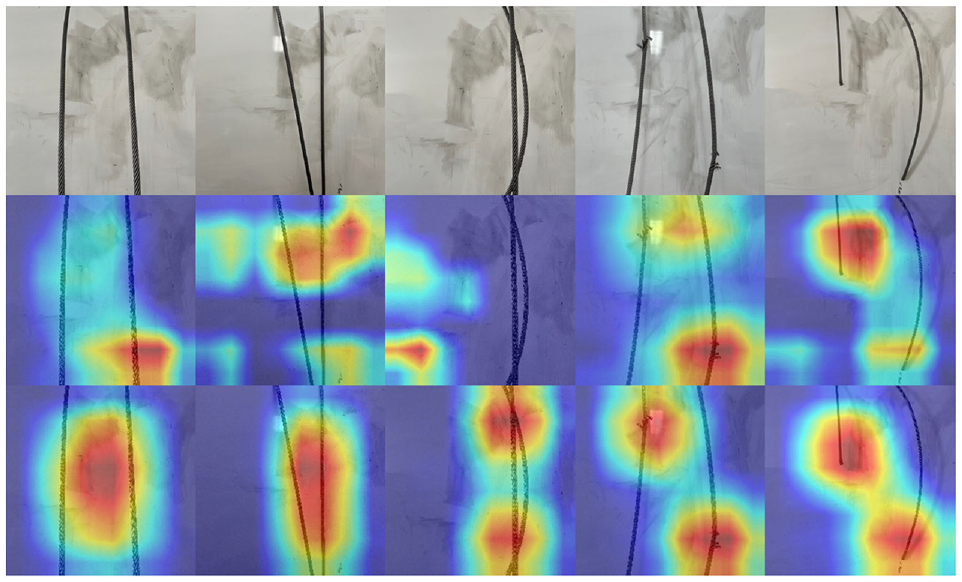
SAM visualization results. The first row indicates the original images; the second row indicates the Grad-CAM visualization of the baseline model; the third row indicates the Grad-CAM visualization results of the model after SAM is added. The bright (with red) areas indicate the regions that contribute more to the model decision, and the dark (with blue) areas indicate those that contribute less.
As observed, the baseline model without the SAM can barely focus on the most essential regions of each state. Meanwhile, the proposed model can accurately find the key regions corresponding to each category and then generate accurate decisions.
Conclusion
The fault diagnosis method for the tail rope of a friction hoisting system is investigated in this study. The method is based on the machine visual and has non-contact, non-destructive characteristics. The findings of this study are summarized as follows:
The fault diagnosis model of the tail rope can use the powerful fitting ability of the deep network to complete the feature extraction process, accurately identify types of faults, and achieve the real-time monitoring of the operating statuses of the tail rope.
To address the scarcity of training samples and discriminative features due to similarity of some fault images, as well as the imbalance of samples in different categories, we separately design online data augmentation strategies, SAMs, and a class-balance loss weighted by the distribution of data. The experiments on the constructed dataset show that the proposed algorithm can achieve better classification results than the method based on traditional visual feature extraction, with an accuracy rate of 99.4819%. The visualization further demonstrates the effectiveness of the designed modules.
Considering the special underground environment of coal mine, there are a large number of dust particles suspended in the air during the lifting process, which unavoidably interferes the monitoring images further, resulting in the degradation of image quality and affecting the subsequent analysis. Due to the correlation of structures, the tail rope may not only have one kind of fault, but several faults occur simultaneously. Possible directions for future research include the following: the robustness of the algorithm to images with low visual structure and cross compounding of multiple failure modes.
Footnotes
Acknowledgements
The authors are grateful for the funding support. The founding sponsors had no role in the design of the study; in the collection, analyses, or interpretation of data; in the writing of the manuscript; and in the decision to publish the results.
Handling Editor: Chenhui Liang
Author contributions
Xinge Zhang performed the data analyses and drafted the manuscript. Guoying Meng conceived of the study, and provided the article processing charge. Aiming Wang helped to draft the manuscript and revised it critically for important intellectual content. Wei Cui participated in data acquisition and data analyses. Xiaohan Cheng helped perform the data analysis with constructive discussions and contributed to the revisions. Jie Yang contributed to implementation of the computer code and revisions. All authors read and approved the final manuscript.
Declaration of conflicting interests
The author(s) declared no potential conflicts of interest with respect to the research, authorship, and/or publication of this article.
Funding
The author(s) disclosed receipt of the following financial support for the research, authorship, and/or publication of this article: This research was funded by the Fundamental Research Funds for the Central Universities, grant number 00/800015A832, and the National Key Research and Development Program of China (Grant No. 2016YFC0600907).
Ethical approval/patient consent
This article is in the field of engineering and does not involve ethics, and the written informed consent has been obtained from all authors for the publication of this article.