
Abstract
One of the major challenges encountered during friction stir processing (FSP) is the establishment of a process parameter window in order to achieve processed surfaces with an acceptable quality as it is an exhaustive task that involves enormous resources, time, and efforts. Sometimes this task is so difficult that the trial may run into futility. This work belongs to a theme of FSP that is not much reported in the literature. This is a maiden work to lay a roadmap for the FSP parameter range in a quick and effective manner. The present study results from first-hand experiments performed to produce surface composites on AA6063 alloy using a mixture of SiC + Fe + Mn + Sn as reinforcement in such a manner that a novice professional can pan out ways to identify and classify irregularities/defects, associate them with the causes and obtain feasible parameter window. In this work, a methodology for identification and selection of optimum tool speed (rpm), processing speed, and plunge depth has been demonstrated. The parameter window was established by analyzing main surface irregularities associated with the parameters and taking corrective modification to eventually arrive at the feasible range. The established range was validated through an experiment performed with the parameters lying within the established window. The validation was supported with microstructural characterization, micro-hardness measurement, thermal analysis, corrosion analysis, and the comprehensive analysis presented in this work has been done with the help of the image processing technique. Results show that grain refinement and homogeneous distribution of reinforcement present in the stir zone developed during FSP at the appropriate process parameters. Furthermore, grain refinement enhances the hardness by 28.29% and the corrosion resistance by 13.6%. The highest temperature that is, 423.25°C is achieved on the advancing side of the processed zone.
Keywords
Introduction
Friction Stir Processing (FSP) is a recent and versatile solid-state technique that was initially developed for microstructural modifications and mechanical properties enhancement through grain refinement and dynamic recrystallization. Of late, it has evolved as a generic material processing technology. It utilizes a rotating cylindrical tool with a shoulder and a pin, which plummets into the base metal (BM) surface and subsequently traverses in a predefined direction. The frictional heat input between the tool and BM and associated plasticization softens the material. 1 The term softening temperature is often associated with the temperature of the material at which it undergoes processing and it is close to its recrystallization temperature. The material flow during FSP generates a spatial movement and results in intimate mixing through stirring action. Severe plastic deformation is achieved at softening temperature during stirring which produces ultra-fine grains and enhances the strength and toughness due to dynamic recrystallization (DRX).2,3
Thus, FSP is highly useful in producing composites by embedding and dispersing reinforcement particles into the substrate. While the process is so generic and promising, it possesses the challenges of its own kind such as the very beginning of the processing may be extremely difficult if not impossible. 4 The success of the acceptable processed zone closely depends on several factors including tool design and fixed and variable process parameters. The process parameters such as tool geometry, plate dimension also exert significant influence on the microstructure evolution and the processed regions of acceptable quality. 5
Entire material property evolution during FSP closely depends on the adequacy of material flow which also affects the state of defects in the processed zone. The presence of FSP related defects makes the entire processing futile as a defect per se weakens the rest of the processed zone howsoever strong it may be. An ineffective material flow during the FSP is the origin of the defect formation such as wormhole, tunnel defect, voids.6,7 Thus, identification, classification, and characterization become very important for the alleviation of defects. Image processing can be effectively utilized in the defect analysis of materials processed via different routes. Through this technique, the image quality is controlled to extract the exact details of specific defects. This technique plays a critical role in the welding industry for seam tracking and in welding research for process monitoring. 8 Several image processing techniques such as image pyramid and image reconstruction have been used for the defect analysis in Friction Stir Welding (FSW). 9
A structured way for identification and classification of irregularities and elimination of associated causes can produce acceptable processed regions. Such irregularities are the serious obstruction encountered during trials and pilot studies. To gage the importance of the trial experiment, several interactions with the researchers and scholars were carried out. The interactions prompted that there is little to guide for an experiment during the trial phase. It was noticed that if the analysis of irregularities is not accurately carried out, then the trial experiment may become very lengthy and time- and resource-consuming. It is well established that the experimental investigation requires a step-by-step approach from identifying parameters to analyzing results. 10 In a typical research, a procedure depicted in Figure 1 is commonly followed.

Flow chart of experimental investigation of FSP/FSW procedure.
For Steps 1–3, one has to mostly rely on handbook knowledge and expert opinion as the literature does not provide due support for a range identification. Furthermore, maximum efforts in terms of material, man, and machine hours are invested in the trial experiments and pilot studies (Step 3). This task is exhaustive and costly in the absence of a robust simulation platform with a dedicated module for this process. Once the range is established through pilot/trial experiments, the optimization is performed through the design of experiments which is systematic and simple. For validation, experimentation is performed within the parameter range. Therefore, when the range is identified correctly, experimentation is not much of a challenge.
Whereas, ample literature is available on the surface defects, the irregularities which remain a major issue are not reported frequently. The available literature is focused more on defects like surface grooves, flash, tunnel defect, kissing bond, hooking, and joint line remnant which mainly occur during FSW,6,11–15 whereas the focus on defects which are typical to the FSP and especially those which are encountered during trials is scant. During the initial phase, the selection of fixed parameters (such as slot size, pin offset, pin length and diameter, shape and profile of pin, shoulder diameter, tilt angle etc.) are very important and crucial for making a defect-free acceptable processed zone.
Kim et al. 11 studied the surface defects namely flash and groove occurred during FSW in which flash was ejected due to metal softening at high heat input and groove like defect was caused by insufficient heat input owing to higher welding speed and lower rotational speed. Bayazid et al. 16 reported that tool pin height and plunge depth are closely related to the plate thickness as an impromptu selection of these process parameters can cause defect. A very high rotational speed delivers excessive heat input which results in a very high softening adjacent to the shoulder and the excessively softened material is expelled in large amounts by forming flash. The excessively softened material finds it easy to get squeezed out under high shoulder pressure rather than being forged behind and getting consolidated. 17 Insufficient plunge depth causes groove defect at the advancing side of the plate. Wormholes and tunnel defects generally appear in the advancing side (AS) and are mainly caused by poor heat input and inefficient material flow. 18 The kissing bond and joint line remnant defects occur due to low heat input caused by low rotating and high traversing speeds. 19 In almost all the reported works, the defects were analyzed through macro and microstructural analysis which requires extensive surface preparations and technical skills. 13
Defect analysis in the FSP/FSW could be performed by several non-destructive methods like immersion ultrasonic and phase array ultrasonic techniques, X-ray radiography thermography, eddy current testing, synchrotron radiation etc. 20 These techniques are typically suitable for the sub-surface defects. Therefore, surface irregularities especially, those formed during the initial phases of FSP, are inutile. Images processing technique becomes very useful and simple particularly for the surface defects. The image processing technique is non-destructive, and analysis can be done in “as is” condition. This investigation has attempted to establish a roadmap on how irregularities and defects of processed material could be perceived toward taking corrective measures to alleviate the irregularities and producing an acceptable experiment regime. For common researchers/professionals it is a very tedious, challenging task to get the first successful FSP pass; leave aside a feasible working range of parameters. The present study is a maiden work consisting of a comprehensive analysis that may be useful in identifying different irregularities and taking corrective measures to converge into a successful experiment. This work relies on the image processing technique which is a fast, simple, and effective way to detect defects without going through a long procedure like cutting, etching and optical micrographs, analysis, and quantification.
Materials and methods
Surface composites (SC) were fabricated to demonstrate how various parameters influence the initial phase irregularities. AA6063 alloy plate having a thickness of 5.0 mm was used as the base material. Plates were perfectly flat and their edges were straight and opposite sides were mutually parallel. FSP was done on a vertical milling machine (Bharat Fritz Werner (BFW), India) (Figure 2(a)) which was specially adapted to perform FSP and the tool head was tilted at an angle of 2°. Parameters such as tool rotational and traverse speed, tool geometry, plunge depth, and reinforcement were altered to produce acceptable quality experiments. A mixture of SiC, iron, Sn, and Mn powders in proportion of 60, 28, 5, and 7 (in wt%) respectively was chosen. Sn powder was added as a phase change material (PCM) to control the process temperature and also to act as a distribution facilitator. The low melting point Sn powder is expected to help in better flow of other reinforcement particles (which are loose and discrete) by binding them due to phase change. The phase change also absorbs latent heat and controls the temperature of the material being processed.21,22 The addition of Fe and SiC powders was made with a view to provide strengthening, resistance to wear and surface hardening. The addition of Mn was made with an objective to study corrosion resistance.23–25 These properties are expected to be inherited in the present case too. For preparing surface composite, a rectangular slot of dimensions 3 mm (wide) × 2 mm was machined in the middle of the plates in which the reinforcement powder was preplaced. Pin-less tool was used to pack the rectangular slot owing to prevent scattering of powder. Steps for surface composite fabrication are shown in Figure 2(b). The temperature was recorded by installing six K-type thermocouples. These thermocouples were installed nearest at the mid-length of the processed zone (three each at 2.5 mm center-to-center distance on advancing side and retreating side). The thermocouple data was acquired through a specially built data acquisition system and saved in a digital computer. The microstructure and micro-hardness specimens were prepared and polished as per the standard metallographic procedure. Subsequently, the polished specimens were etched with modified poulten reagent. Corrosion test was performed on wonatech potentiostat apparatus in which platinum electrode and saturated calomel electrode are used as the counter and reference electrodes respectively. The samples were exposed to an electrolyte (3.5 wt pct NaCl solution) for 2 h.

(a) Experimental set-up of FSP and (b) steps for SC fabrication.
The irregularities and surface defects of the samples were determined via image processing technique with ImageJ software. Here, the camera-based processing technique was used for detecting surface defects. The image processing steps (shown in Table 1) are as follows: (1) The images of processed area were taken from high resolution digital camera which enabled the acquisition of detailed images of the processed zone; (2) The colored images so obtained were converted to gray scale images with ImageJ software in order to reduce the image data; (3) Adjust the threshold level by intermodes option to create the binary image and reduce noise which was due to the dust and impurity of the processed sample; (4) defects are identified and its shape, size, and orientation were measured shown in Table 3 and analyzed by histogram and plot profile options which are shown in Figure 4.
Image processing steps and their respective images of the worst and best run.

Results and discussion
Establishment of range of process parameters
The image processing technique was used to investigate how the change in process parameter affects the FSP pass and to analyze the defects for arriving at successfully processed surface. Table 3 displays actual and processed images of the plates which were friction stir processed. Process parameter window for FSP is shown in Table 2 wherein cover run parameters and variations of FSP process parameter during processing are mentioned separately. V12(a) (V12 means variation 1 in the first half plate as well as variation 2 in the other half plate) was obtained by using parameters of variation given in Table 2 after the first trial run and V12(b) represented all the identified surface defects as white blobs. It can be clearly seen that the processed region contains several observable surface defects and irregularities such as scramble, flash, burr, and a long rectangular open crater with intermittent closures owing to high amount of PCM and improper process parameter. Figure 3 shows the flowchart for the selection of the range of process parameters, causes of defects, and its corrective measures which justifies Table 2. A second pass FSP is commonly applied as a strategy to repair previous pass defects and also to facilitate homogeneous reinforcement distribution. 26 Therefore, here, one would seek the support of literature and apply for a second FSP pass with an objective to close the crater. The details like type of defect and its irregularity in shape, orientation, and location provide a lot of information to guide one to change the process parameters.
Process parameters window for FSP.

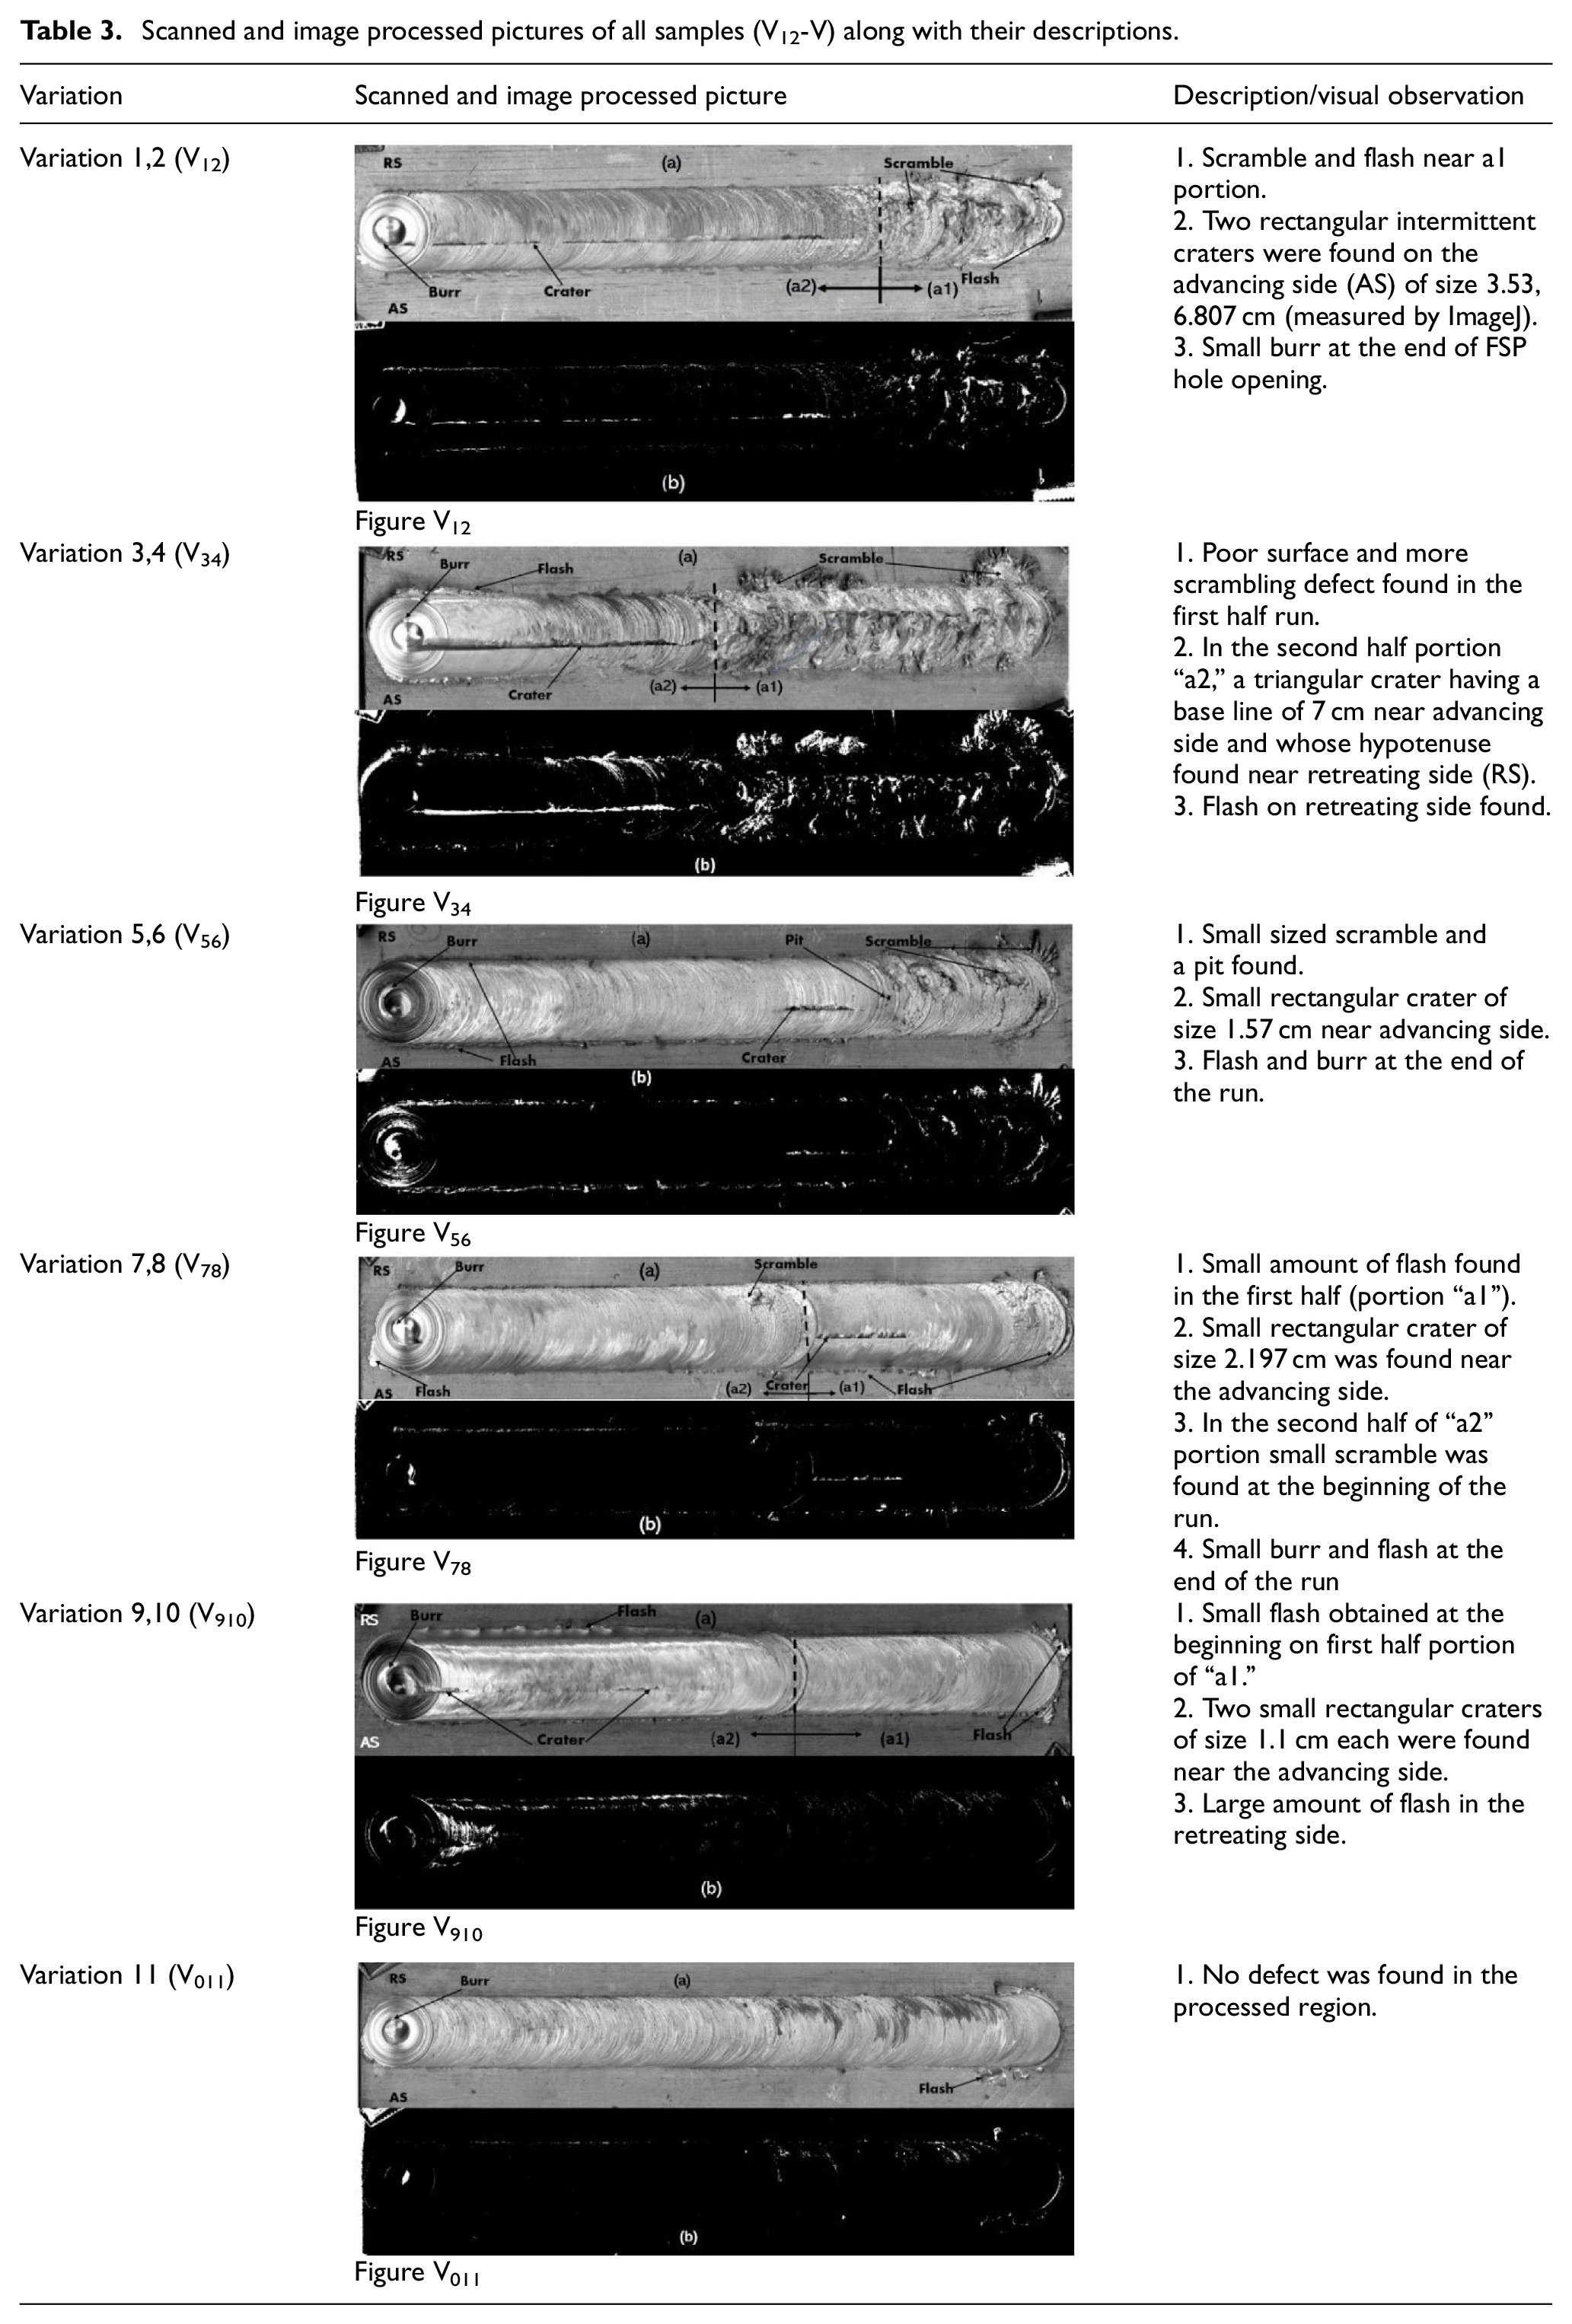
Scanned and image processed pictures of all samples (V12-V) along with their descriptions.

Flowchart for selection of FSP process parameter.
A close observation of V34 reveals that more scramble is pronounced than in Figure V12 but a triangular crater continues to be observed in the AS. In order to eliminate these defects, the concentration of Sn, which promotes agglomeration, and pin diameter need to be reduced. The reinforcement mixture comprises discrete particles which possess interstitial voids and a larger slot accommodates a greater reinforcement volume and possesses greater interstitial voids. Generally, narrow slot width coupled with adequate slot width (w) to pin diameter (d) ratio should be employed. In the present case, a 3 mm wide slot was processed with a 7.5 mm pin diameter. A large slot width was chosen as it produced a greater volume fraction after processing. During FSP, pin having large diameter empties greater space behind it, which should be replenished by sufficient material being forged due to stirring. For the same shoulder diameter, a pin with large diameter may not generate sufficient forging pressure, keep the emptied space unfilled and the crater would form. The presence of crater suggests that the pin diameter of 7.5 mm is too large for the slot width of 3 mm, resulting in crater formation which should be closed.27,28
In order to reduce the agglomeration, the concentration of PCM should be reduced; and parameters like traverse speed should also be reduced to increase the heat input. Reduction in traverse speed means tool engage time during processing per revolution is more. It is evident from V56 that the scramble was significantly reduced and as the tool progresses it disappeared (as in the region “a2” of the Figure). However, a rectangular surface crater appears owing to the insufficiency of material which was necessary for consolidation. The third run was performed by taking corrective measures observed from the previous run as mentioned in Figure 3. The image of the third run shows the irregularities like scramble, crater, and flash which are reduced as compared to the second run (refer to V56). But the presence of small defects is still not acceptable. A small amount of flash and a crater could be seen. Flash has been formed because some material was squeezed out of the processed region and insufficient material was left for consolidation and which causes a small crater. The defects were disappeared in the second half part of the run owing to the effect of flash which formed in the beginning disappeared as the FSP progressed. Also, the effect of preheating on the downstream side too resulted in the make-up for the insufficient heat.
In the fourth run, a small amount of flash was found in the beginning owning to high softening that occurred due to high heat. At a high degree of softening, material finds it easy to squeeze out of the shoulder rather than getting forged into the processed zone. The squeezing out of the material in the form of flash causes a material deficiency and makes consolidation difficult, which consequently results in a small rectangular crater as found in Figure V78 (a1). To provide better forging action, the plunge depth was increased from 4.6 to 4.75 mm which created a defect free run owing to high heat input and better forging action (refer to V78“a2”).6,13 Sample V78 reveals that a cleaner and acceptable run can be performed at parameters that administer high heat in the chosen conditions. It is important to expand the parameter range within which clean FSP regions can be created. With this objective variation V910 was performed.
The sample V910 shows the run which was performed at two different sets of parameters (refer to Table 2) in the two halves of the plates. It can be observed that no significant defects were produced during the processing. The entire run showed a defect free clean surface of the fabricated SC and thus provided a working range for getting a successful run. The appearance of the sample confirmed that the rotational speed can be varied between the range of 710 rpm (low heat input) to 1120 rpm (high heat input) at a fixed transverse speed that is, 100 mm/min. Now, instead of increasing rpm whilst keeping speed constant (as in sample V910), the transverse speed changes from 100 (low heat input) to 63 (high heat input) mm/min at a fixed rpm of 710 rpm. The sixth run as in sample V011 was performed at 710 rpm and 63 mm/min (refer to V011) which confirms that this SC run is also free of defects. Thus, a working range of 710–1120 rpm and 63–100 mm/min speed was established. Table 4 shows the established range of parameter window for FSP wherein fixed parameters and variable process parameters are mentioned for the final run. Taguchi’s DoE based L4 orthogonal array was selected from the established range to confirm and validate the window and for optimization.
Established range of parameter window for FSP.

Gray level distribution of V910 is showing a large variation of grayscale intensities along the processed zone in Figure 4. Abrupt crests and troughs in the range of 10–30 were the indications of the discontinuity and inconsistency of the processed zone that is, presence of defect. A small variation in the range of 1–5 was observed in V011 which signified that the processed zone was having defect free surface. The histogram of the gray level image shows the distribution of intensities in the range 0–255 and is used to reveal the information related to the irregularities in the processed zone. In V011, the histogram does not have any pixel below the gray level number of 70 which signifies the defect free processed zone. Whereas in V12, this value is below 20 which means the processed zone is having defects.29,30

(a and c) Gray level distribution and (b and d) histogram of gray images for V12 and V011 respectively.
Study of ripple formation
The surface of the processed zone, as obtained after FSP, also has a typical surface morphology which can be useful in many analyses. The surface appearance of the region processed by FSP (Figure 5) shows a regular circular ripple pattern which may be correlated to the action of the shoulder during the advancement of the tool. The formation mechanism of such surface patterns is relevant to the tool features (such as features in the shoulder etc.) and flow interaction (due to the presence of feature on the pin e.g. presence of flute, nature of threads etc.) underneath the shoulder. These regular pitch ripples are produced by the final ejection of the layers of depositing mass at the trailing circumferential edge of the shoulder, during the traverse of the tool. As the rotational direction of the shoulder changes from RS to AS, at this moment the materials in the AS are mixed and appear like a ripple line because of the increase in the flow force at the AS. The actual size of the ripples can be defined as the ratio of the traverse speed of the workpiece to the rotation speed of the tool. Table 5 shows the theoretical and actual measured distance (by ImageJ) between the ripples.31,32

(a and b) Ripple formation at different processing parameters and (c and d) image analysis of the ripple.
Distance between the ripple at different process parameter.

Confirmation of established range
Experiment no.1 from L4 orthogonal array is conducted for further confirmation of the established range. Thermal, microstructural, micro-hardness, and corrosion analyses have been done. The processed plate after FSP that is, new Friction stirred processed plate (NFP) is shown in Figure 6 where locations of thermocouple are clearly mentioned for temperature measurements. The results are discussed in the following sections.

Location of thermocouple for thermal analysis in NFP.
Thermal analysis
Figure 7(a) depicts the main effects plot for Signal to noise (S/N ratios) which were calculated for each experiment in L4 OA. Lower values of peak temperature was chosen as desired and therefore smaller–the-better characteristic were used to calculate the S/N ratio. Figure 7(b) shows time-temperature profile of achieved optimum parameter which depicted that the thermocouple output for the entire duration of the FSP run. It is noticeable that the highest temperature that is, 423.25°C occurred on AS because more heat of deformation is generated during beginning of processing from this side. Initially, the temperature has increased slowly because of preheating of the sample and after that curve rises more and steeper owing to the FSP tool acting as a moving heat source. The temperature reached to its peak value when the tool passed through the thermocouple location. The temperature plot beyond the thermocouple location drops gradually indicating a gradual cooling.
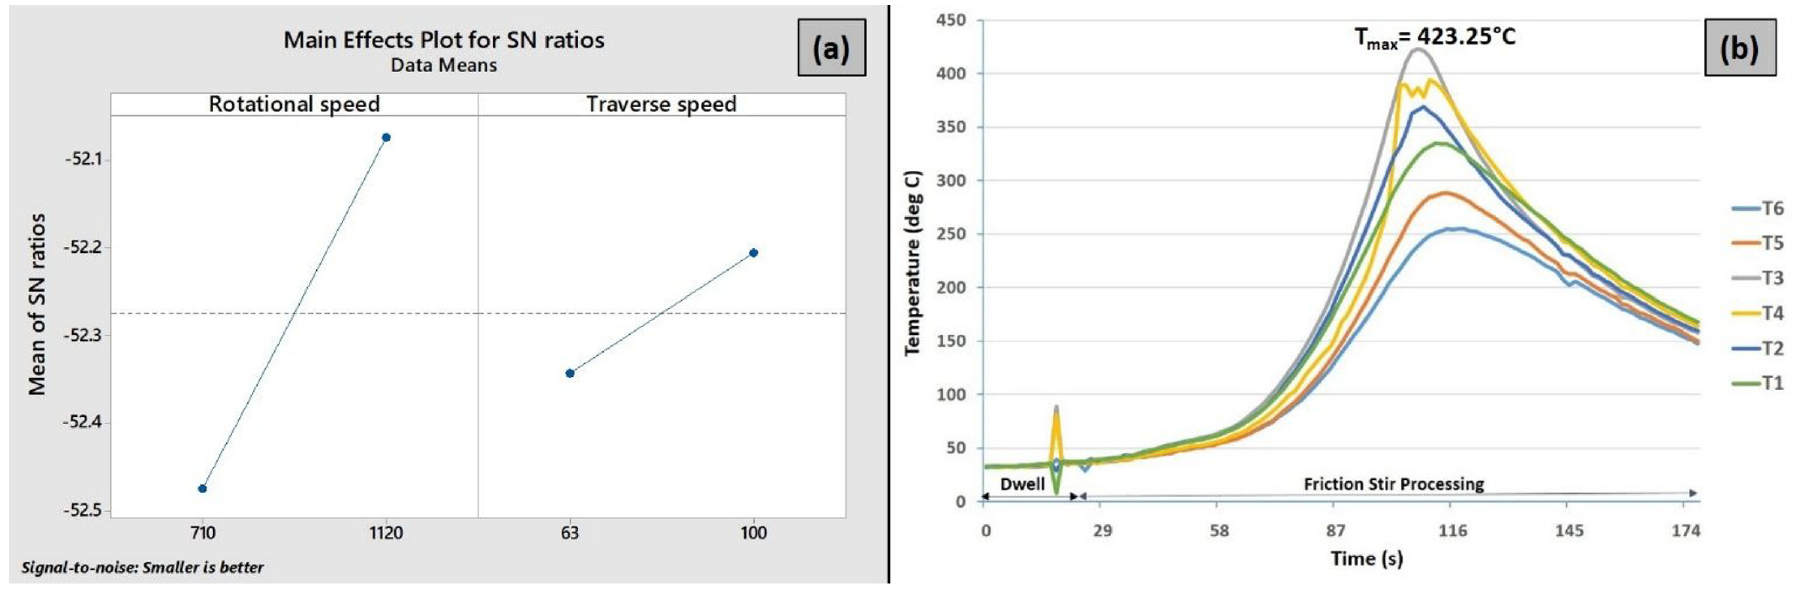
(a) Main effects plot for SN ratios and (b) temperature versus time plot of NFP.
Further to notice that the peak temperature outputs of the thermocouples which are located farther from the processing-line center drop sharper than those located nearer to the processing line.
Microstructural and micro-hardness measurements
Figure 8 depicts the macrograph of the processed region in NFP. Basin-shaped macrograph showed a broad opening at the upper portion owing to high frictional heat and deformation by contact between the shoulder and processed surface. The microstructure of base material and SZ of NFP are shown in Figure 10 where grains are clearly visible. Base material has coarse grains whereas fine, equiaxed, and uniformly distributed grains are present in SZ owing to dynamic recrystallization (Figure 10(c)).

Macrostructure of the processed zone.
SEM examination was performed on NFP to understand the distribution of reinforcement particles in the stir zone (SZ) shown in Figure 9. Distribution of reinforcement is more even and homogeneous due to proper mixing with the matrix. This is attributed due to processing at desired process parameters.

SEM image of the processed zone.
Moreover, micro-hardness test is performed on the base material (BM) as well as on NFP from AS to RS. Hardness value of base material (BM) as well as SZ of NFP are 65.03 and 90.69 Hv respectively. Higher hardness values are attributed due to grain refinement and Orowan strengthening during the friction stir processing.
Corrosion analysis
Similarly, corrosion study is carried out on the base material as well as on the NFP to study the electrochemical behavior of the samples. Figure 10 shows the microstructure of the base material and SZ of the NFP before and after corrosion. Corroded patches are more visible in base material in comparison to the SZ. This is due to the fact corrosion rate and grain boundaries are dependent on each other. With increase in the homogeneity of microstructure the grain boundary serves as the barrier owing to the shift in positive corrosion potential, reduced corrosion current density which resists the corrosion process.33,34 Figure 11 depicts the potentiodynamic polarization curve that is, Tafel plot for the base material and NFP.

Microstructure of: (a) base material before corrosion, (b) base material after corrosion, (c) SZ of NFP before corrosion, and (d) SZ of NFP after corrosion.

Potentiodynamic polarization curves of the BM and NFP.
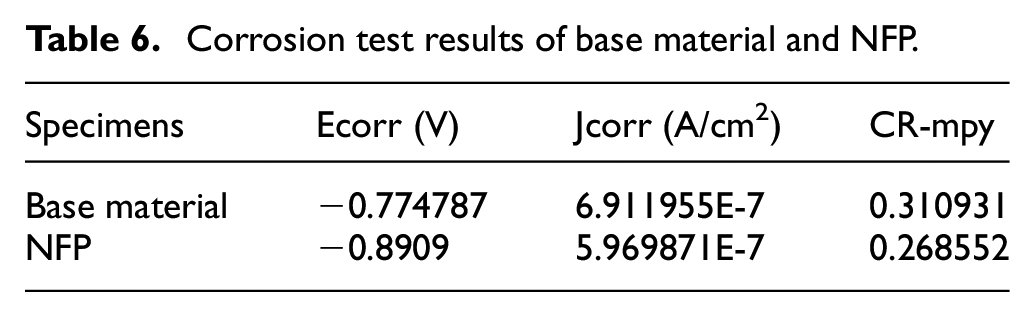
Higher corrosion potential (Ecorr) is higher and lower corrosion current density (Jcorr) are obtained in the base material as compared to the NFP shown in Figure 11. As higher values of Jcorr represents the higher corrosion rate therefore, the base material shows the lower corrosion resistance compared to the NFP. 35 SZ of the NFP shows higher corrosion resistance because of the reinforcement elements and fine grain size. Table 6 shows the values of corrosion potential (Ecorr), corrosion current density (Jcorr), and corrosion rate (CR-mpy).
Corrosion test results of base material and NFP.
Conclusions
In this research work, an attempt to establish a working range of surface composites that were fabricated on AA6063 alloy by FSP. The surface defects that occurred during FSP have been classified into scramble, crater, flash, and burr. The important results of the present study are mentioned below:
Scramble defect is formed due to the low heat input and agglomeration of Sn particles which are added to the reinforcement as phase-change-material. It was found that a higher concentration of Sn causes agglomeration which produces scramble. The Sn powder is added in the reinforcement to control the process temperature and also as a distribution facilitator.
It was found that a ratio of slot width (w) to pin diameter (d) equal to 0.49 could eliminate the crater defect effectively.
It was found that the parameters which result in either too high or too low heat may lead to defect formation. The processing parameter combination may lead to either insufficient or excessive heat input and may affect material movement and consolidation that deteriorate the surface morphology of the processed region.
Parameters leading to too high heat input lead to excessive softening and result in the expulsion of material out of the shoulder in the form of flash. Parameters causing less heat input cause lack of material consolidation which results in scramble.
Maximum temperature is achieved at AS because more heat of deformation is generated during the beginning of processing from this side.
Microscopic and SEM image were taken from the extreme processing conditions that is, NFP reveals the homogenous particle distribution which verifies that the established range can provide a feasible process parameter window in very few experimental runs.
Hardness of NFP is increased by 28.29% as compared to base material because of fine grains and homogenous distribution of the reinforcement particles.
NFP has higher corrosion resistance compared to the base material owing to the increase in the homogeneity of microstructure wherein grain boundary serves as the barrier that resists the corrosion process.
Footnotes
Handling Editor: Chenhui Liang
Declaration of conflicting interests
The author(s) declared no potential conflicts of interest with respect to the research, authorship, and/or publication of this article.
Funding
The author(s) disclosed receipt of the following financial support for the research, authorship, and/or publication of this article: The authors extend their appreciation to King Saud University for funding this work through Researchers Supporting Project number (RSP2022R499), King Saud University, Riyadh, Saudi Arabia.