
Abstract
The skip liner is a primary wearing component that is subjected to direct impacts and friction from coal in the mineshaft hoisting system. In this research, a skip tester was designed to investigate the impact wear characteristics of liner such as the wear quantity, impact load, and wear morphology under different impact velocities and coal types. The discrete element method (DEM) simulation was used to predict the wear distribution and load behavior for different coal particle sizes. The experimental results show that the wear failure of the liner is due to impact wear and abrasive wear. The impact velocity has significant effects on all three evaluation indices, and a larger impact velocity causes a greater wear degree. Three evaluation indices show that the coking coal causes a higher impact wear. In addition, the DEM simulation results show that the coal particle size has a significant influence on the impact load of the liner, the normal cumulative contact energy increases with the increase of the coal particle size, but the tangential cumulative contact energy decreases with the increase of the coal particle size. The use of a DEM simulation can predict the regions subjected to wear in the skip and the dynamic behavior of the coal particles, which provide a method for optimizing the parameters of coal particles and for improving the service life of the skip liner.
Introduction
The mineshaft hoisting system is the most significant part of a mine, and this system is mainly used to hoist minerals such as coal and gangue. 1 The hoisting process of the mine is achieved by a hoisting skip. The hoisting skip is composed of a liner to protect the skip. It can be divided into an inclined shaft and a vertical shaft according to the working conditions. The liner of the skip is a primary wearing part that is subjected to direct impacts and friction from coal, gangue, and other minerals, so the liner needs to have a higher strength and wear resistance. In particular, in a large-scale hoisting system, the skip liner needs to be frequently maintained or replaced, which severely affects the hoisting efficiency. To solve the problem of liner wear failure, researchers have mainly focused on the selection of anti-wear materials and the optimization design of the liner.2–4 However, the evaluation and the measurement of the impact wear characteristics of the liner are poorly developed, and little is known about the general conclusions about the effects of the operating parameters and coal types on the impact wear characteristics of skip liners. Hence, it is necessary to analyze the relationship between the impact wear characteristics and the operating parameters.
The liners are widely used in ball mills,5,6 crushers,7–9 hoisting skips, and other industries to protect the machinery from wear damage. The wear is due to the loss of material from the liner contacting surface due to the relative motion of the surfaces and their frictional interaction with each other. 10 The factors influencing liner wear include the relative strength, normal impact force, sliding velocity, and material hardness. To understand the impact wear characteristics and wear mechanisms, researchers have carried out a series of studies in the past few decades. These studies have revealed that the wear processes are dependent on the operating parameters and liner materials. Xu et al. 11 used DEM simulation to predict the wear rate and wear distribution of liner with different mill speeds. Boemer and Ponthot 12 developed a generic DEM-based procedure to predict the wear distribution of liner and calibrated the wear data in a Φ5.8 m industrial cement mill. Zhao and Fu 13 investigated the wear failure of the skip liner in the Jinchuan Nickel-copper mine and found that the drilling, cutting, and impacting of the ore that resulted in pits were the major means of wear. Wang et al. 14 studied the variation of stress on the skip wall with the discrete element method and the finite element method. Jin and Zhang 15 studied the structural design and dynamic analysis of the skip in a large-scale hoisting skip. Akhondizadeh et al. 16 studied the impact wear characteristic on the mill liner at different conditions by a test machine. Rigaud and Le Bot 17 studied the low load impact on the liner material and analyzed the wear topography. Kalala et al. 18 studied the effect of liner wear and liner modification on the charge position, impact energy spectra, and power draw. The aforementioned studies were mainly focused on the dynamic analysis of the skip and the wear of liner in other mining machinery. However, there have been few studies on the wear of the skip liner.
The purpose of this research is to investigate the impact wear characteristics of the skip liner. To this end, a skip tester was designed to simulate the impact load behavior characteristics between the coal and the liner. The effects of the working conditions on the wear quantity, impact load, and wear morphology were analyzed. Additionally, an Archard wear model based on the experimental results was used to predict the wear processes and load behavior of the skip liner under real loading conditions. From this research, these results not only provide the theoretical basis data for the optimization of the skip liner but also improve the understanding of the load behavior in a hoisting skip.
Materials and methods
Experimental set-up
The skip tester is designed to investigate the impact wear characteristics of the liner, as shown in Figure 1. Figure 1(a) depicts the three-dimensional geometric model of the skip tester that is a scaled model of the large-scale hoisting skip system. It consists of a frame, a loading hopper, an unloading hopper, a skip, a horizontal belt conveyor, and a baffle-type conveyor. The baffle-type conveyor is used to control the conveying capacity, and the horizontal belt conveyor is used to adjust the impact velocity of a coal particle. Figure 1(b) shows the structure of the impact detection device of the skip. An S-type tension-compression sensor and an impact force sensor are used for measuring the tangential and normal impact forces borne by the liner when the coal falls to impact on the liner. In order to compare the impact wear phenomena, two liner specimens with dimensions of 50 mm ×50 mm × 6 mm are fixed on the liner surface for measuring and evaluating the wear quantity and wear morphology. In the process of the experiment, the coal particle is lifted to the loading hopper by the baffle-type conveyor. Then, the coal particle is dropped onto the horizontal belt conveyor. The horizontal belt conveyor conveys the coal particle to the skip liner. Finally, the impacted liner specimen is measured and analyzed.

Skip tester. (a) Three-dimensional geometric model of the skip tester. 1. Hoisting container 2. Fixed caster 3. U-type slide rail 4. S-type tension-compression sensor. 5. Liner 6. Bearing 7. Slip liner 8. I-type guide rail 9. Slider 10. Impact force sensor. (b) Structure of the impact detection device.
Materials
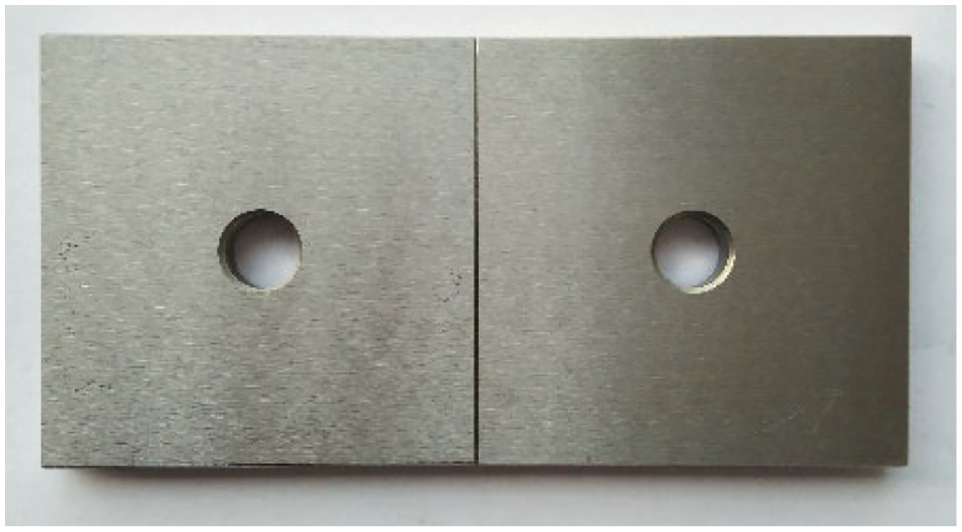
As shown in Figure 2, the liner specimen is fixed on the surface of the liner. The material of the liner specimen is 16Mn steel, and the size of the liner specimen is 50 mm × 50 mm × 6 mm. To reduce the measurement error of the wear morphology, the surface of the liner specimen is cleaned and polished. The mechanical properties of the liner specimen are listed in Table 1.
Liner specimen.
Mechanical properties of the liner specimen.

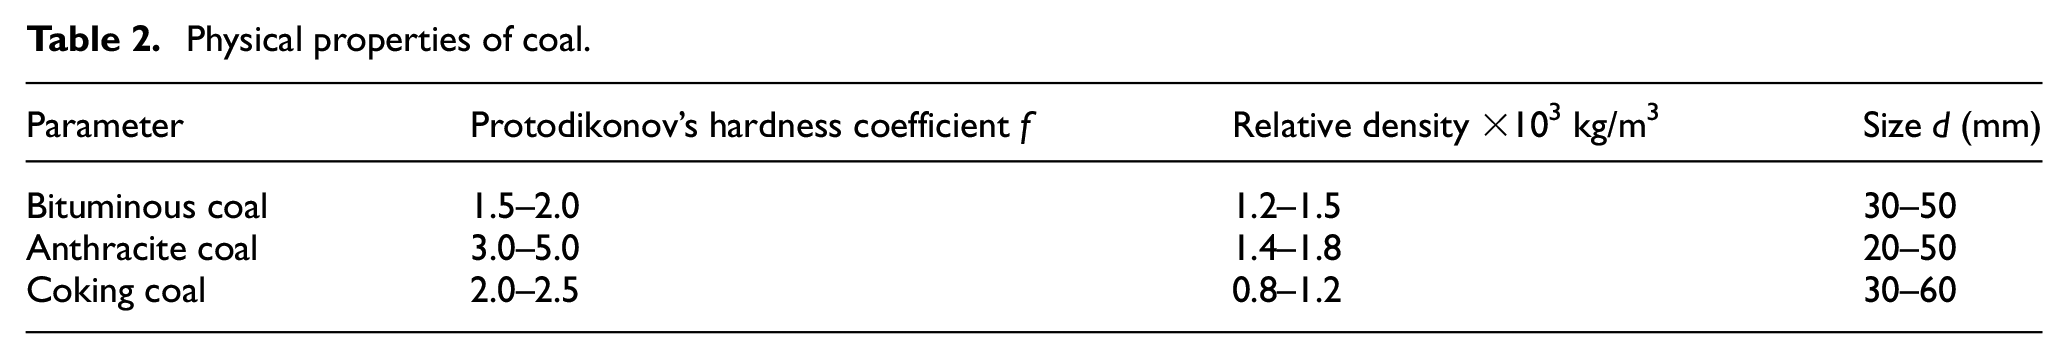
In order to simulate the actual working conditions as realistically as possible, three kinds of coal particle are selected to analyze the impact wear characteristics of the skip liner. As shown in Figure 3, the three kinds of coal particle are bituminous coal, anthracite coal, and coking coal. The physical properties of the three kinds of coal are listed in Table 2.
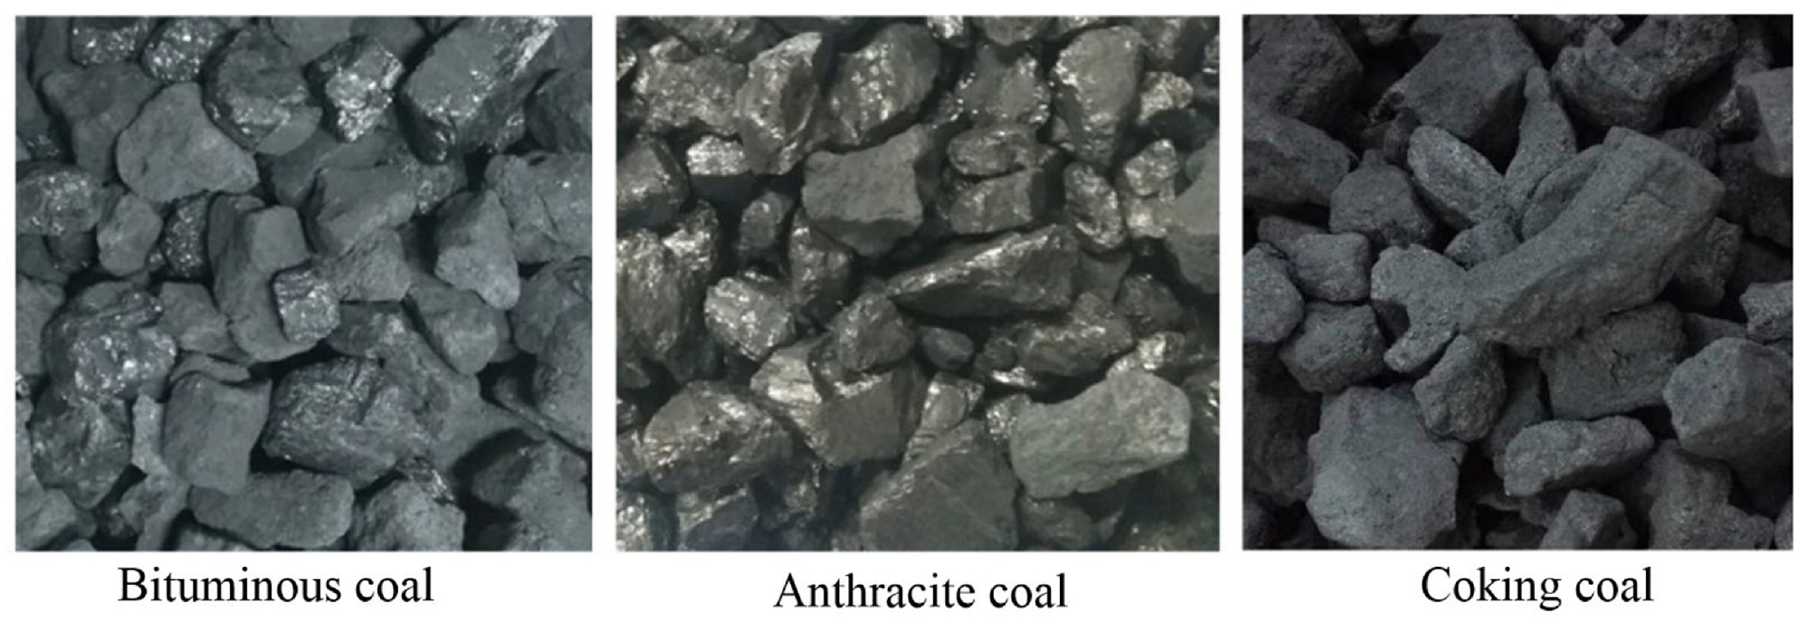
The types of coal.
Physical properties of coal.
Experimental conditions
To understand the impact wear characteristics of the skip liner, three kinds of indicators such as the wear quantity, impact load, and wear morphology are selected to evaluate the impact wear processes. In order to ensure the reliability of the measurement accuracy, all the cases have the same environments and are set for 30 min of operation. In this research, a JJ224BC electronic balance with an accuracy of 0.0001 g is used to measure the wear mass of the liner specimen. A DH5960 data acquisition system with a sampling rate of 1 kHz is used to analyze the impact load. An SM-1000 confocal three-dimensional wear morphology measuring instrument is applied to observe and analyze the wear morphology of the liner specimen. Its measuring accuracy is 0.001 mm. Additionally, a post-processing software of the Mountains Map is used to quantitatively analyze the wear parameters (the wear volume, the wear depth, the profile curve, etc.). The details of the impact wear experiments are presented in Tables 3 and 4.
Experimental parameters of impact wear for different impact velocities.

Experimental parameters of impact wear for different coal types.

Experimental results and discussions
Analysis of the wear quantity of the skip liner
The wear quantity is one of the most important parameters for describing the wear characteristics.10,19,20 It is the material loss caused by wear, and it can be obtained by measuring the changes of the length, volume, and mass. For the hoisting skip, the deformation failure and surface damage of the liner are the primary causes of frequent damage. To quantitatively analyze the wear quantity, the surface of the liner specimen is cleaned with the compressed air, and a JJ224BC electronic balance with high accuracy (measuring accuracy: 0.0001 g) is used to measure the mass loss of the liner specimen before and after impacts.
Effect of impact velocity on wear quantity
Figure 4 shows the results of the wear quantity experiments at different impact velocities. It can be seen that the wear quantity increases with the increasing impact velocity, and the average wear masses of the liner specimen are 0.0044, 0.0061, and 0.0082 g. These results show that a larger impact velocity causes a greater wear degree, while a lower impact velocity causes a lower wear degree. This is similar to the results obtained by Akhondizadeh et al. 16 in that the wear mass of the liner increases with the impact velocity. As the impact velocity is increased, more coal particles are conveyed to the liner, so the impact force and the friction force are increased. The difference of the wear mass between the left liner specimen and the right liner specimen indicates that the wear on the liner specimen is a random process, and the wear quantity of the liner is dependent on the impact velocity of a coal particle.

Variation of wear mass with impact velocity.
Effect of coal type on wear quantity
Figure 5 shows the variation of the wear quantity experiments for different coal types. Three kinds of coal particle, including the bituminous coal, the anthracite coal, and the coking coal, are compared. The average wear masses of the liner specimen are 0.0067, 0.0082, and 0.0107 g. These results show that the coking coal leads to a higher impact wear degree, whereas the bituminous coal leads to a lower wear degree. For the Protodikonov’s hardness coefficient and the relative density, the results for the bituminous coal and the anthracite coal show that the wear mass of the liner specimen increases with these parameters, but the coking coal does not follow this variation. In addition, the difference of the wear masses between the left liner specimen and the right liner specimen shows a maximum value of 0.001 g for the coking coal. This may be due to the size of the coking coal being higher than that of other coal types, so the coking coal has a larger wear mass.

Variation of wear mass with coal type.
Analysis of the impact load of the skip liner
The impact load is one of the most important parameters for describing the impact resistance of materials. In the process of lifting, the liner is impacted by coal blocks of different sizes and shapes, and the impact resistance of the liner material determines the wear degree of the skip liner. To measure the tangential load and the normal load of the skip liner, a device that can detect the impact load of the skip liner is designed. The normal force is measured by an impact force sensor, and the tangential force is measured by an S-type tension-compression sensor. A DH5960 data acquisition system is used to collect the output signal from the sensor. Due to a large amount of impact force data, in this research, the statistical analysis method is adopted, and the impact force data of 600 s are selected to analyze the impact load behavior.
Effect of impact velocity on impact load
Figure 6 shows the number of impacts per 600 s plotted as a function of the force at different impact velocities. As shown in Figure 6(a), the number of impacts in the normal force range of 0–100 N decreases with the increasing impact velocity, but the number of impacts in the normal force range of 100–600 N increases with the increase of impact velocity. As shown in Figure 6(b), the number of impacts in the tangential force range of 0–100 N remains almost unchanged, but the number of impacts in other tangential force ranges shows a decreasing trend. Based on the normal force distribution and the tangential force distribution, the results show that a higher impact load of the normal force is mainly concentrated in the range of 200–300 N, while a higher impact load of the tangential force is mainly concentrated in the range of 100–200 N. Moreover, the impact force distribution shows that the number of impacts for the normal force is higher than that for the tangential force.

Variation of impact load with impact velocity: (a) distribution of normal force and (b) distribution of tangential force.
Figure 7 shows the variation of the cumulative force at different impact velocities. It can be seen that the normal cumulative force is higher than the tangential cumulative force. As the impact velocity is increased, the normal cumulative force increases, while the tangential cumulative force first decreases and then increases. These results indicate that a higher impact velocity causes a higher impact load. The impact velocities of the coal particle determine the wear degree and wear position of the liner. In the experiment, the wear region has repeated impacts, and it is easy for the liner to form machining hardening.

Variation of cumulative force with impact velocity.
Effect of coal type on impact load
Figure 8 shows the number of impacts per 600 s plotted as a function of the force for different coal types. In Figure 8(a), the number of impacts for the normal force ranges of 0–100 N and 400–600 N shows that the coking coal has a maximum impact number. However, the number of impacts for the normal force range of 100–400 N shows that the anthracite coal has a maximum impact number. As shown in Figure 8(b), the number of impacts in the tangential force range of 0–100 N remains almost unchanged, but the number of impacts in the tangential force range of 100–600 N shows that the bituminous coal has a maximum impact number. All the impact force distributions show that the number of impacts of the normal force is higher than that of the tangential force for the same force range.

Variation of impact load with coal type: (a) distribution of normal force and (b) distribution of tangential force.
Figure 9 shows the variation of the cumulative force for different coal types. It can been seen that the normal cumulative force is higher than the tangential cumulative force. For the normal cumulative force, the coking coal has a maximum value and the anthracite coal has a minimum value. For the tangential cumulative force, the bituminous coal has a maximum value and the anthracite coal has a minimum value. These results show that the coking coal causes a higher impact load, while the anthracite coal causes a lower impact load. This result indicates that the impact load on the liner is related to the coal particle sizes and that a larger particle size causes a higher impact load.
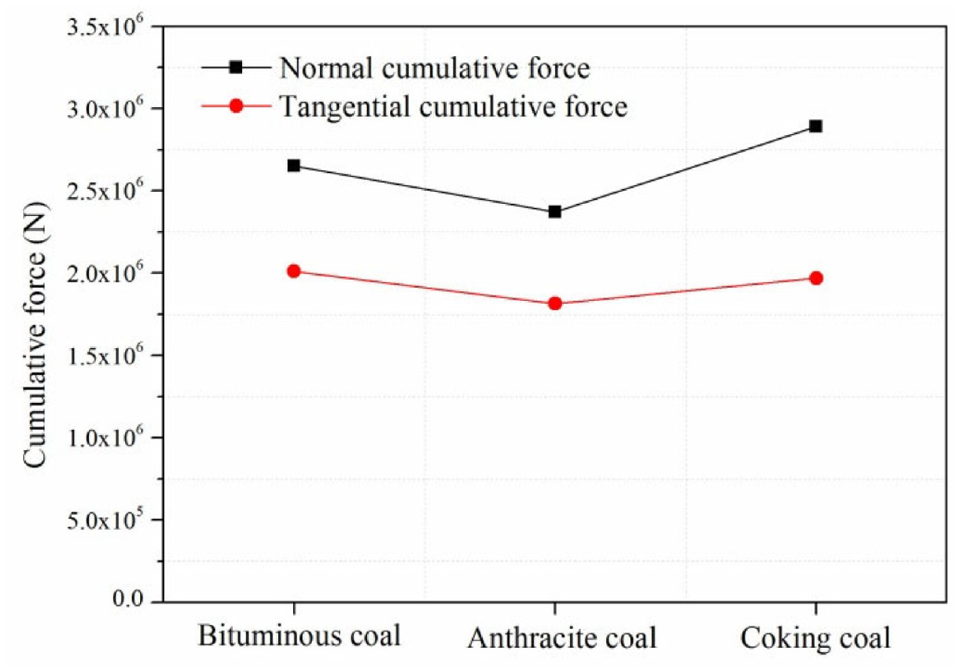
Variation of cumulative force with coal type.
Analysis of the wear morphology of the skip liner
The wear surface morphology reflects the wear status of the materials, and it is an important method for studying the wear mechanism and wear failure. To understand the impact wear mechanism of the skip liner, an SM-1000 confocal three-dimensional contour measuring instrument is used to measure the surface morphology of the liner specimen. The maximum depth and the average depth of the wear region are determined with Mountains Map post-processing software. Because the wear region has an irregular shape, all the wear depths are measured three times and then averaged to reduce the measurement error.
Effect of impact velocity on wear morphology
Figure 10 shows the wear morphology of the liner specimen for different impact velocities. The different colors in the wear images represent the different wear depths. Pits and scratches appear on the worn material surface compared to the original surface. The results show that the surface of the liner is subjected to severe impact and friction, and the forms of wear failure are impact wear and abrasive wear. As the impact velocity is increased, the surface wear depth of the liner increases, and the wear is more obvious. This indicates that the wear of the liner is related to the impact velocity, and a larger impact velocity causes more serious wear. Figure 11 depicts the variation of wear depth at different impact velocities, which corresponds to Figure 10. Obviously, the wear depth increases with the increase of impact velocity. The results show that the maximum wear depth of the liner specimen varies from 6.15 to 25.3 μm with the variation of impact velocity from 1.4 to 1.8 m/s. Similar trends of variation are observed for the liner specimen with the average wear depth increasing from 2.03 to 8.74 μm with the increase of impact velocity from 1.4 to 1.8 m/s. The wear parameters of the wear morphology are consistent with the wear quantity and the impact load. This is because the number of coal impact liners and the impact load per unit time increase with the increase of impact velocity, so the liner wear is more serious.

The wear morphology of the liner specimen for different impact velocities: (a) v = 1.4 m/s, (b) v = 1.6 m/s, and (c) v = 1.8 m/s.

Variation of wear depth with impact velocity.
Effect of coal type on wear morphology
Figure 12 shows the wear morphology of the liner specimen for different coal types. The wear failure forms of the liner are similar to those for different impact velocity conditions. Pits and scratches of different sizes appear on the surface of the liner, among which the most serious wear is caused by coking coal, while the least wear is caused by bituminous coal. Figure 13 depicts the variation of wear depth for different coal types, which corresponds to Figure 12. It can be seen that the coking coal causes a higher wear degree, whereas the bituminous coal causes a lower wear degree. The maximum wear depths of the wear regions in the bituminous coal, anthracite coal, and coking coal are 18.6, 25.3, and 30.4 μm, respectively. The average wear depths of the wear regions in the bituminous coal, anthracite coal, and coking coal are 7.59, 8.74, and 12.5 μm, respectively. These wear characteristics are influenced by the shapes and hardness of the coal particles, so the liner specimen appears to have different wear morphologies. The material has a larger size and hardness, and it is capable of higher wear resistance and deformation resistance.

The wear morphology of the liner specimen for different coal types: (a) bituminous coal, (b) anthracite coal, and (c) coking coal.

Variation of wear depth with coal type.
Wear prediction
The hoisting skip is a complicated system, and the wear failure of the liner is the primary cause of frequent damage to the skip. For a large-scale hoisting skip, it is difficult to measure and evaluate the wear and load behavior of the liner with an experimental method. Simulation of the particle dynamic behavior and prediction of the wear of liner are a significant but challenging work. 21 Hence, accurate prediction of the wear and load behavior of liner is an important element in the design and optimization of a hoisting skip.
Concerning the wear prediction, the DEM simulation is commonly regarded as an effective method for describing the mechanical behavior of a granular material and the wear distribution of its geometry.22–25 Using the DEM software with an effective wear model can simulate the load processes and identify the regions subjected to wear. This research is focused on the study of a heavy-load and multi-rope friction hoisting skip that has a vertical shaft. The simplified three-dimensional model of the hoisting skip system is shown in Figure 14. The hoisting skip system mainly consists of an unloading hopper, an unloading gate, a skip, a fan-shaped gate, and a coal sliding plate. To simplify the calculation, all the geometry materials are set to 16Mn steel. The parameters of the hoisting skip are listed in Table 5.

The DEM simulation model of hoisting skip.
The DEM simulation parameter of hoisting skip.

The shapes and sizes of the coal particles are different in the actual hoisting conditions. In order to establish a coal particle model that is closer to the real coal particles, five coal particles with different shapes are selected for three-dimensional scanning, and then, the three-dimensional scanned particle data are modeled with Automatic Sphere-clump Generator software. Five different shapes of coal particle for the profiled particles are shown in Figure 15.
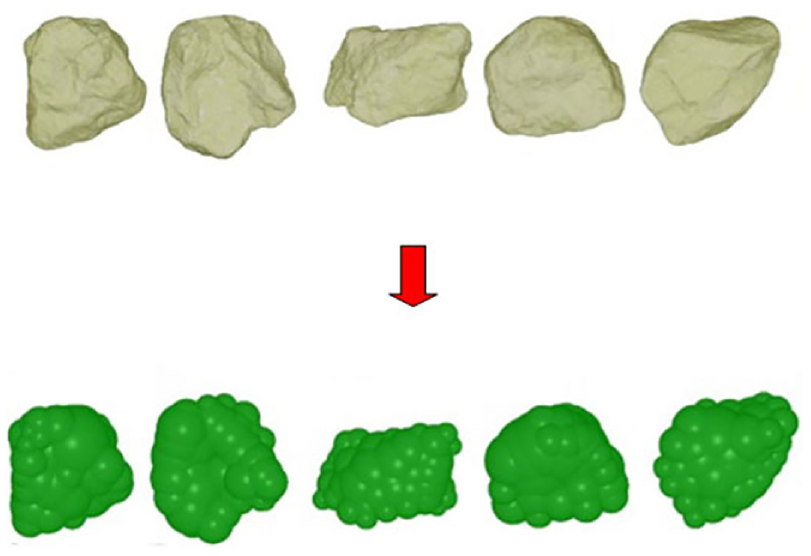
The DEM simulation model of coal particle.
In the DEM simulation processes, a non-linear Hertz-Mindlin no-slip model is employed to solve for the contact between coal and coal. Related studies have shown that the wear quantity is proportional to the cumulative contact energy, which can be used for the analysis of the wear and friction characteristics. These contact behaviors such as contact energy can provide a method for understanding the energy losses during the collision event. This can be expressed by the following equation:


where Fn and Ft are the normal force and the tangential force, respectively, Vn and Vt are the normal relative velocity and the tangential relative velocity, respectively, and δt is the time step.
According to the contact model, the relative velocity, the contact energy, and the contact force between the coal and liner can be obtained. This information can be used to predict the wear in a skip liner with the help of an appropriate wear model. Based on Archard wear theory, 26 a Hertz-Mindlin with Archard Wear model is employed to solve for the volume loss of geometry. This wear theory indicates that the wear volume of the material is proportional to the load pressure of the friction object and inversely proportional to the hardness of the material. The volume loss of the material is given by:
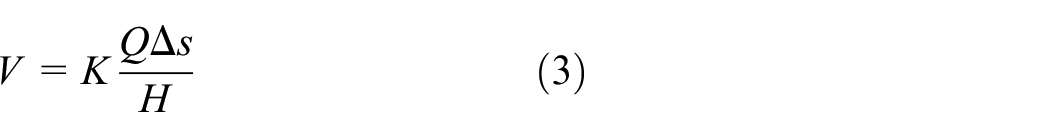
and the height loss can be calculated as follows:

where V is the volume loss of the material, K is the wear coefficient, Q is the normal load, H is the hardness of the material, Δs is the sliding distance, Hdepth is the height loss of the material, and A is the contact area.
The wear coefficient between the liner and the coal particle is derived from the experimental result. When the experimental condition is anthracite coal, the impact velocity is 2.2 m/s, and the liner material is 16Mn steel. The experimental results show that the wear mass of the liner specimen is 0.01485 g, and the average load pressure is 300 N. According to equation (3), the wear coefficient is K = 3.0 × 10⁻¹². To understand the dynamic behavior of a coal particle and the wear distribution of the liner for different coal particle sizes, in this research, the variation of the coal particle velocity, the load behavior of the liner, and the wear distribution of the liner are analyzed. The parameters of the DEM simulation are listed in Table 6.
DEM simulation parameters.

Effect of coal particle size on load behavior
Figure 16 shows the distribution of particle velocities for different coal particle sizes. The velocity change trend of the coal particles can be divided into four stages: the slow acceleration stage, the collision deceleration stage, the sharp acceleration stage, and the static stage. First, the coal particles fall through the unloading hopper. Then, the coal particles impact the liner. Finally, the coal particles fall down. Analysis of the coal particles in the DEM simulation is an effective method for solving the actual working condition because the motion trajectory problem of the coal particle cannot be known. According to the dynamic behavior of the coal particle, the coal particle trajectory can be changed by adjusting the angle of the unloading gate to avoid excessive wear of the liner at a certain position.

The distribution of particle velocity under different coal particle sizes: (a) d = 40–60 mm, (b) d = 60–80 mm, (c) d = 80–100 mm, and (d) d = 100–120 mm.
Figure 17 shows the variations of a marked coal particle for different times. At point A, the instantaneous velocities of coal particles impacting the liner are 9.19, 9.7, 9.3, and 9.32 m/s. At point B, the coal particles fall down, and the particle velocity reaches the maximum value. Overall, the instantaneous impact velocity first increases and then decreases with the increase of the coal particle size. This result is due to the collision friction between particles intensifying with the increase of the coal particle size, so the coal particle velocity is slightly reduced.

The variation of particle velocity with time under different coal particle sizes.
Figure 18 shows the variations of impact force for different coal particle sizes. It can be seen that the coal particle size has a significant influence on the impact load of the liner. With the increase of coal particle size, the impact load has an increasing trend, and the normal force range is higher than the tangential force range. In Figure 18(a), the number of impact contacts for the normal force range of 0–1000 N decreases with the increase of the coal particle sizes, but the number of impact contacts for the normal force range of 2000–6000 N increases with the increase of the coal particle size. As shown in Figure 18(b), the number of impact contacts for the tangential force range of 0–500 N decreases with the increase of coal particle size, but the number of impact contacts for the tangential force range of 1000–3000 N increases with the increase of coal particle size. This indicates that a lower coal particle size causes a lower impact force, but a larger coal particle size causes a higher impact force.

Variation of impact force with coal particle size: (a) distribution of normal force and (b) distribution of tangential force.
Effect of coal particle size on wear distribution
Figure 19 shows the wear distribution of the skip liner for different coal particle sizes. The different colors of the liner represent different wear levels. It is obvious that the parts most subjected to wear are located at the upper and lower parts of the liner, and the tangential cumulative contact energy is higher than the normal cumulative contact energy. At the impact zone and the unloading zone of the skip, the wear region of the liner presents many larger wear points. However, the liner shows many smaller wear points at the middle of the liner. These results indicate that the wear region distribution and the wear mechanism are related to the dynamic behavior of the coal particle.

Effect of coal particle size on wear distribution: (a) d = 40–60 mm, (b) d = 60–80 mm, (c) d = 80–100 mm, and (d) d = 100–120 mm.
Figure 20 shows the variation of the wear parameters for different coal particle sizes, which correspond to the wear distribution shown in Figure 19. The results of the wear parameters show a similar curve that undergoes three wear stages, namely the initial wear stage, the rapid wear stage, and the stable wear stage. In the initial wear stage of 0–1.7 s, there is no cumulative contact energy or wear on the liner. In the rapid wear stage of 1.7–5.5 s, the cumulative contact energy and the wear depth of liner increase sharply. For the coal particle in the stable wear stage of 5.5–6 s, the cumulative contact energy and the wear depth reach a maximum value and tend to be in a stable state. As shown in Figure 20(a) and (b), the tangential cumulative contact energy is larger than the normal cumulative contact energy. The normal cumulative contact energy increases with the increase of the coal particle size, but the tangential cumulative contact energy decreases with the increase of the coal particle size. These results indicate that a larger coal particle causes stronger normal erosion and weaker tangential friction, but a smaller coal particle causes weaker normal erosion and stronger tangential friction. For the same condition, more of the small coal particles cause a lower normal impact force, but a larger number of smaller coal particles falling along the liner will have a strong tangential wear effect on the liner. As shown in Figure 20(c), the average wear depth increases with the increase of the coal particle size, and the average values in the stable stage are 2.08 × 10⁻⁶ mm, 2.21 × 10⁻⁶ mm, 2.31 × 10⁻⁶ mm, and 2.38 × 10⁻⁶ mm. These results indicate that a larger coal particle causes a higher wear degree, and a smaller coal particle causes a lower wear degree.
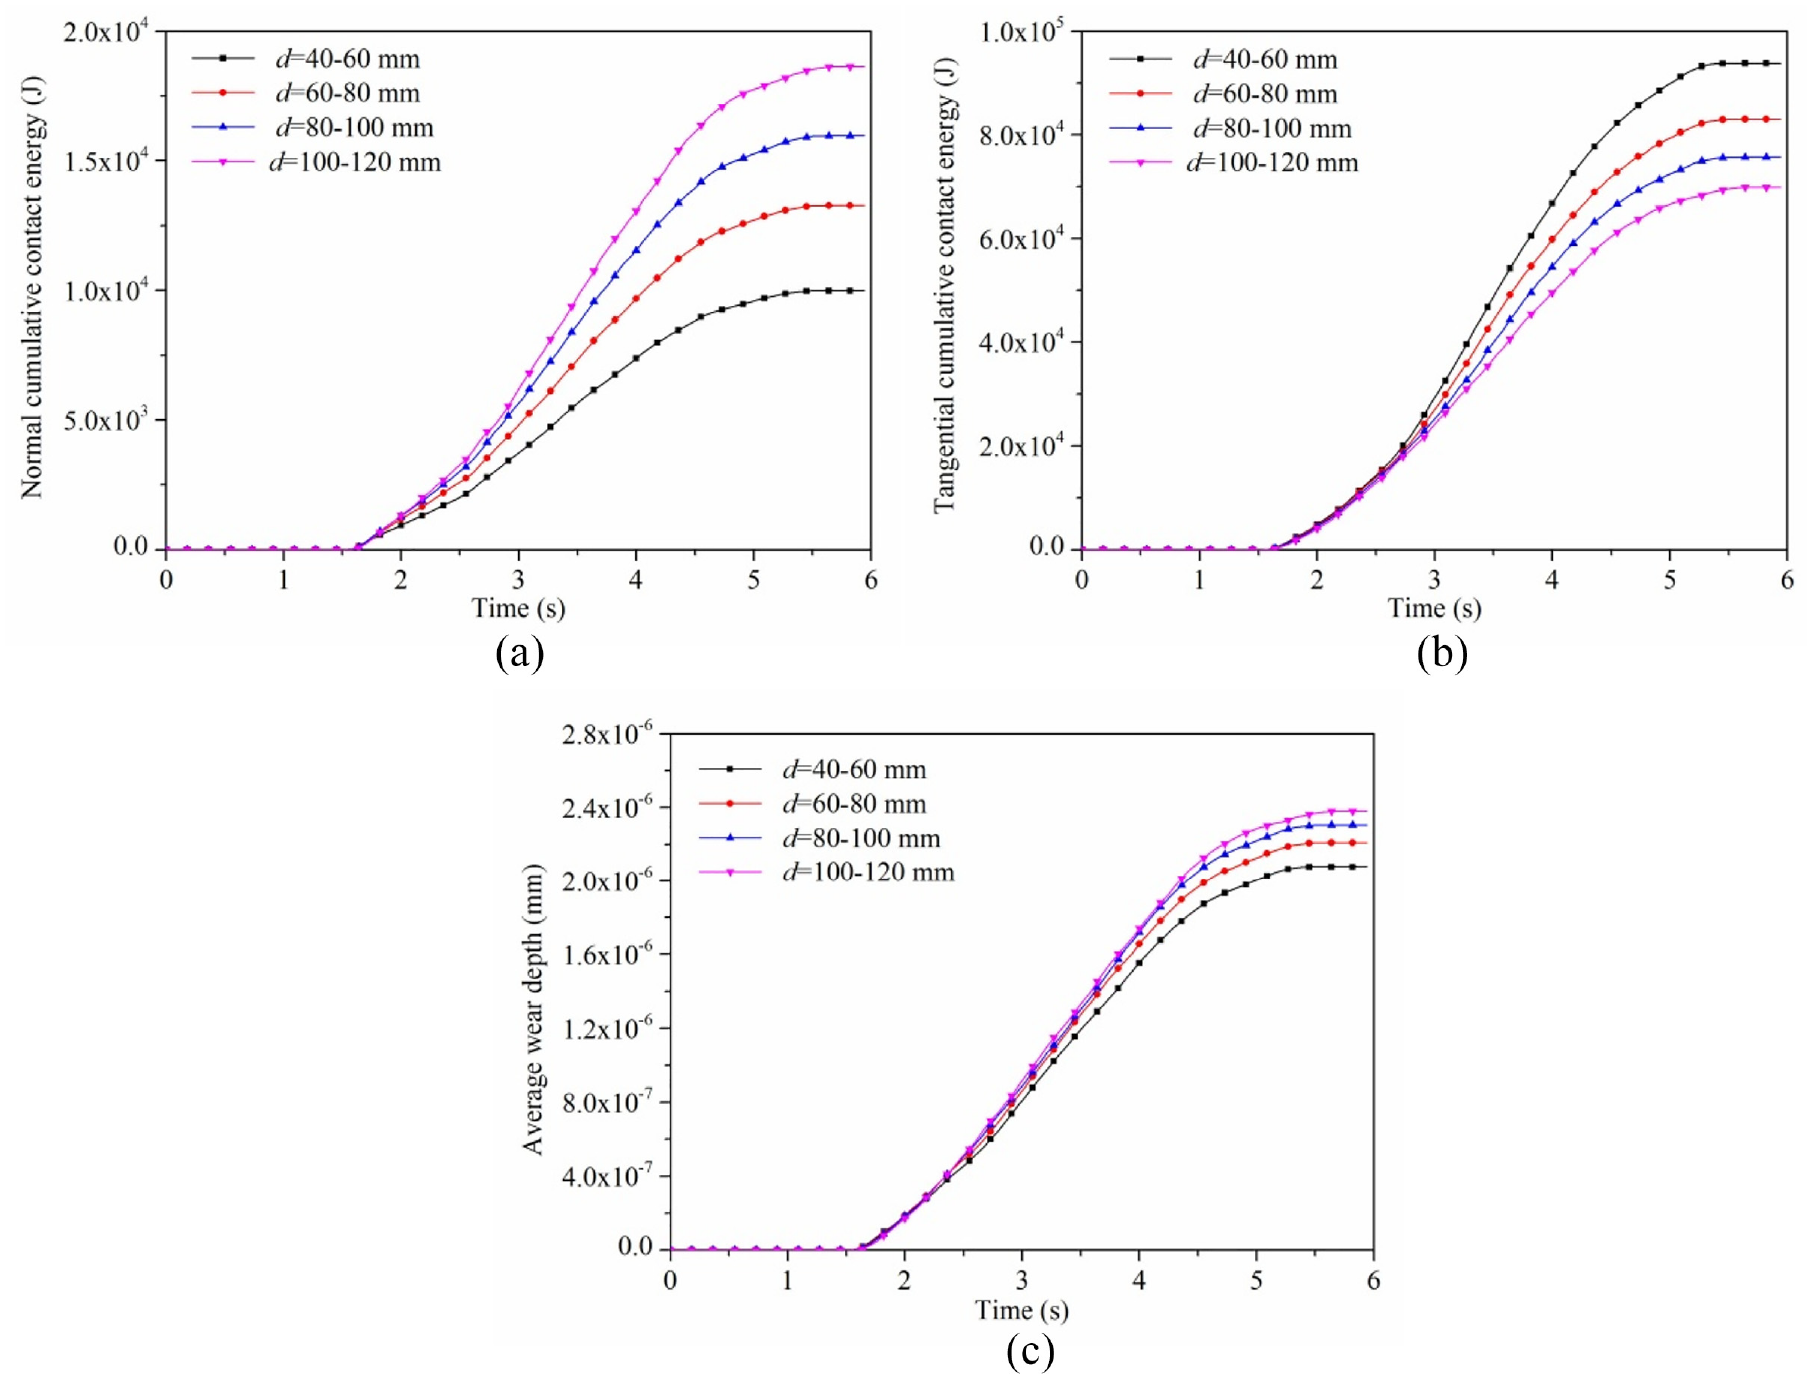
The variation of wear parameters with time under different coal particle sizes: (a) normal cumulative contact energy, (b) tangential cumulative contact energy, and (c) average wear depth.
Based on the above simulation results, the DEM simulation can be used to predict the regions subjected to wear and the load behavior of coal particles. The difficulty with the DEM simulation is that the simulation time is limited, which cannot simulate the experiment time as realistically as possible. However, the wear distribution and the load behavior provide a method for optimizing the parameters of coal particles and for improving the service life of the skip liner. According to the wear distribution and dynamic behavior of coal particles, one can predict the wear status and the position where the liner is impacted, and then make a reasonable choice to replace the liner.
Conclusions
The novelty of this research is that a skip tester is designed, and the effects of impact velocity and coal type on the wear of the skip liner are studied. In addition, a DEM simulation is used to predict the wear distribution and load behavior for different coal particle sizes. Based on the experiment and the DEM simulation results, the conclusions can be summarized as follows:
The wear quantity, impact load, and wear morphology are proven to be effective indicators for investigating the wear characteristics that occur in the skip liner.
In the hoisting process of coal, the wear failure of the skip liner is mainly caused by the impact wear and the abrasive wear.
The results of the wear quantity show that a greater impact velocity causes more serious wear. Coking coal causes the most obvious wear in a skip liner, whereas bituminous coal causes to the least obvious wear in a skip liner.
The results of the impact load show that the normal impact force is greater than the tangential impact force. The impact force of coking coal is the largest, while that of anthracite is the smallest.
The results of wear morphology show that the wear depth increases with the increase of impact velocity. The wear depth of coking coal is the largest, while that of bituminous coal is the smallest.
The Hertz-Mindlin with Archard Wear model can effectively predict the wear region and wear degree of a skip liner.
Footnotes
Acknowledgements
We wish to thank Yin and Mi conceived and designed the schemes; Yin and Li performed the experiments and analyzed the data; Wang provided useful comments for this study.
Handling Editor: James Baldwin
Declaration of conflicting interests
The author(s) declared no potential conflicts of interest with respect to the research, authorship, and/or publication of this article.
Funding
The author(s) disclosed receipt of the following financial support for the research, authorship, and/or publication of this article: This work was supported by the Doctoral Scientific Research Foundation of Suzhou University (grant number 2020BS004); the Talent Fund Project of Jiangsu Ocean University (grant number KQ19008); and the Natural Science Foundation of the Jiangsu Higher Education Institutions of China (grant number 19KJB440004).