
Abstract
Gear failures are commonly caused by wear and fatigue and past research on gear failures has primarily focused on individual failures. A gear testing machine was developed to explore the mechanism of gear wear-fatigue interaction, and four sets of wear-fatigue interaction tests were performed by changing the operating conditions of the gear drive by regulating the quantity of lubricant in the test gearbox. The K-S test method was used to investigate the gear life distribution under wear-fatigue interaction. The frequency domain properties of the wear-fatigue interaction were compiled and analyzed using Fast Fourier Transform (FFT) analysis. A coordinate measuring machine was implemented to obtain the exact amount of wear at each stage of the gear test. The mechanism of gear wear-fatigue interaction was analyzed by scanning electron microscope observation of tooth surfaces. The results are as follows. The life distribution under wear-fatigue interaction obeys a log-normal distribution. With the increase of the lubrication the pitting fault occurs, the fault gear rotation frequency and its harmonic frequency appear in the low frequency region, and its amplitude increases with the increase of the pitting fault. In the high-frequency region, a sideband with the faulty gear rotation frequency as the interval appears around the meshing frequency and its two times frequency, and its amplitude increases with the increase of the pitting fault. With the decrease of lubrication, the gear wear failure increases, the amplitude of the meshing frequency and its two times frequency increases in the high frequency region. In the gear transmission process, wear and fatigue exist in a competitive relationship of mutual constraints.
Introduction
Gear transmission is one of the most prevalent forms of transmission. As the aerospace, wind power, new energy vehicles and other industries continue to increase the requirements of the bearing capacity of gears, high speed, heavy load, high temperature, and other factors seriously deteriorate the working conditions of gear transmission, the meshing tooth surface is prone to wear, pitting, gluing, tooth fracture, and other multiple failures occurring at the same time or occurring one after another.1–3 Therefore, the control and research of multi-fault interaction of gear transmission is particularly important.
Gears are frequently accompanied by wear phenomena during contact fatigue, 4 indicating that the two types of damage, wear, and fatigue, have an obvious interaction. Many studies have been conducted on wear and fatigue interaction. Kapoor et al. 5 pointed out that the service life of mechanical components is often not dominated by a single load, for example, the lubricant added to reduce component wear into the interior of the surface cracks will accelerate crack expansion, on the contrary, the material loss from proper surface wear can eliminate fatigue cracks. Benyajati et al. 6 discovered that certain anti-wear lubricant additives are effective in reducing tooth wear efficiency while simultaneously increasing crack expansion. Hattori and Watanabe 7 devised a friction fatigue lifting method based on the stress intensity factor, calculating the stress intensity factor and contact pressure for friction fatigue cracks using the finite element approach and the Archard model to calculate wear. Madge et al.8–10 effectively examined the influence of friction and wear on friction fatigue life by using a modified Archard wear model with the critical plane approach. They found that in the presence of wear, overall sliding wear reduces the crack expansion rate, whereas wear in partial sliding conditions is likely to increase the crack expansion rate over the sliding region, influencing fatigue life prediction directly. Morales-Espejel and Brizmer 11 established a numerical model for fatigue failure of bearings with micropitting under slip-roll conditions, using the classical Archard wear model for wear simulation. The wear effect, according to Morales-Espejel, 12 change the position of micro-pitting from the maximal tooth contact pressure to the single tooth engagement area. The relationship between wheel and rail frictional wear and contact fatigue was elucidated by Wang et al.13,14 They found that the fatigue life of the wheel and rail is the coupled result of contact fatigue and wear. Janakiraman et al. 15 created a point contact wear model that simulates the experimental wear process by iteratively combining the contact equation and the Archard wear equation. It was found that the wear coefficient decreases when the lubricant pressure viscosity factor increases. The lubricant pressure viscosity coefficient is the characteristic that has the largest influence on wear across the spectrum of operations studied. Brandão et al.16–18 used the Archard model to consider the surface roughness and lubrication properties of the friction subsurface, provided a method to solve the wear coefficient and finally verified the accuracy of the model by comparing the actual profile of the gear tooth surface to that of the model. To explore the concurrent appearance of micro-pitting and micro-wear in gears, they developed a new fatigue model based on contact fatigue model and Archard wear model. Then they performed seven wear experiments to explore the impact of contact load, film thickness, and lubricant type on the wear coefficient. Shen 19 proved that during high circumferential contact of gears, wear will inevitably occur on tooth surfaces, and that the micro- and even macro-geometry of tooth surfaces will evolve as a result of wear, resulting in redistribution of stress fields on near and sub-surfaces, which affects the fatigue damage accumulation process and failure modes. Under boundary lubrication conditions, Vrcek et al. 20 investigated the resistance of gears to micropitting and wear. Wang and Gao 21 used finite element modeling and experimental verification to explore the influence of wear depth on crack growth rate and highlighted the interaction between fatigue and wear. The findings reveal that the material removal process slows crack propagation, whereas fatigue eliminates wear resistance and takes over when the nominal fracture length reaches a threshold value, and a modified model based on the traditional Paris formulation is used. Morales-Espejel and GabelliI 22 examined the mechanism of damage generated by a combination of wear and rolling contact fatigue for sliding motion states. Higher sliding velocity and higher contact pressure will most likely change the failure mode from rolling contact fatigue to adhesive wear or gluing. When compared to the low speed case, Zhou 23 found that increasing the film thickness and generating rough peak wear can inhibit the formation of micropitting. Because the effect of slight wear in the film thickness is relatively low, the surface of the local contact area is fully worn, and when the film thickness ratio is further increased, the wear decreases while the fatigue damage increases. Mussa et al. 24 investigated the sliding wear and fatigue crack damage mechanisms of high strength steel 22NiCrMo12-F under dry contact conditions by conducting an experimental analysis of the rock bit material, and found that the reciprocal sliding test produced more wear and surface fractures than the unidirectional sliding test. Pinto et al. 25 looked into the effects of wear processes on fatigue crack extension and life evaluation, integrating multi-axial fatigue theory with the Archard wear algorithm to calculate the extension life of fatigue cracks under wear, and discovered modest differences when compared to current data. Llavori et al. 26 provided a numerical method for predicting the whole life of a wire under wear-fatigue coupling that included the Archard wear equation with the Smith-Watson-Topper parameters, and this numerical method was experimentally confirmed. Previous studies of wear-fatigue interaction have mostly been numerical analyses and simulations under a single lubrication condition. However, less research has been conducted on the failure characteristics and the interaction mechanism under the interaction of gear fatigue and wear. Moreover, lubrication has a significant effect on wear and fatigue, 27 emphasizing the need of studying the coupling between gear fatigue and wear under various lubrication conditions. Therefore, in order to investigate the characteristics of gear wear-fatigue interaction under different lubrication conditions and the mechanism of wear-fatigue interaction under corresponding lubrication conditions, four sets of gear wear-fatigue interaction tests with different lubrication conditions were conducted in this paper.
The main contents of this test are as follows: gear wear-fatigue interaction tests were completed using the gearbox vibration signal as the judgment criterion for gear failure, and the gear life distribution considering the wear-fatigue interaction under different lubrication conditions was verified. The frequency domain properties of gear wear-fatigue interaction under varied lubricant levels were analyzed using a Fast Fourier Transform (FFT) of vibration signals. The pitting morphology of the gears after failure was obtained, and the wear depth of the tooth surfaces was measured using a CMM. The wear-fatigue interaction surface morphology of gear was examined using a scanning electron microscope, and the wear-fatigue interaction mechanism of gear transmission was investigated using the experimental results.
Test equipment and test program
Test equipment
The test gear material is 45 steel. The surface of the gear is tempered and the surface of the pinion is hardened. The specific parameters are shown in Table 1. The test bench is CL-100 gear testing machine. 28 The bench and its structure are shown in Figures 1 and 2. The speed of the gear is 1460 r/min and the driving power is 5.5 kW. The operation of the gear test bench is monitored by acceleration sensor 29 and analyzed according to the acceleration vibration signal collected by the DI-148U data collector. A flow-adjustable circulating lubrication station 30 is used to provide lubricant to the meshing gears, and the operating principle of the lubrication station is shown in Figure 3. Gear wear depth is measured using a coordinate measuring machine. 31
The parameters of gears.


The gear test bench.

The structure of the gear test bench.

The operating principle of the lubrication station.
Test program
In order to shorten the gear failure life, we reasonably increased the working load of the gear. By calculating the test bench four-stage load close to the permissible stress of the gear, pinion torque of 60.8 Nm was chosen. Considering the test accuracy and test time, the gear oil in the test gearbox is 220 base oil (kinematic viscosity (40 °C): 45.4 mm2/s; density (20 °C): 855 kg/m3; viscosity index: 98).
The test is divided into four sets, which are full lubrication test, 75% lubrication test, 25% lubrication test, and trace lubrication test. Pre-test was conducted first. The purpose of the pre-test is to determine the gear cycle lubrication flow, gear failure signal characteristics, and to provide experience for the formal test.
The test procedure is as follows. The four sets of gears were numbered, and the coordinate system of each gear was first established by a CMM to measure the tooth profile of the specified gear tooth, and the gear tooth profile was automatically measured by using the theoretical curve of this tooth profile as the path. Three tooth profiles at different heights were measured for each gear tooth, and 30 coordinate points were measured for each profile, as shown in Figure 4. One measurement was taken as a reference size before wear. Four sets of gear tests were performed, loaded according to four levels of load, and the amount of lubrication in the gear test box was adjusted by the lubrication station to detect the gear operation according to the acceleration sensor signal. When the intermediate moment of the pre-test was reached, the gear test was stopped, then the tooth surface was simply cleaned and the tooth profile triangulation was measured. The test was performed again until the vibration signal reached the failure standard. After cleaning the tooth surface, the tooth profile coordinates were measured once more and then the surface of the tooth profile was observed using a sweeping electron microscope in order to study the wear-fatigue interaction mechanism.

Gear wear depth measurement.
Test results and analysis
Gear life for four sets of tests
The signal amplitude characteristics of the gear drive failure were obtained by combining the wear-fatigue characteristics of gears and the test phenomenon of vibration noise on the test stand. 32 The vibration signal at the start of the test gear is shown in Figure 5(a), where the horizontal coordinate is the time and the vertical coordinate is the acceleration vibration. It can be observed that there is no large fluctuation at the beginning of vibration. The vibration signal at the end of the test is shown in Figure 5(b). It can be seen that the gear has shown a considerable vibration. When the vibration signal peak becomes double, the gear has reached the failure life depending on the research judgment of test gears.
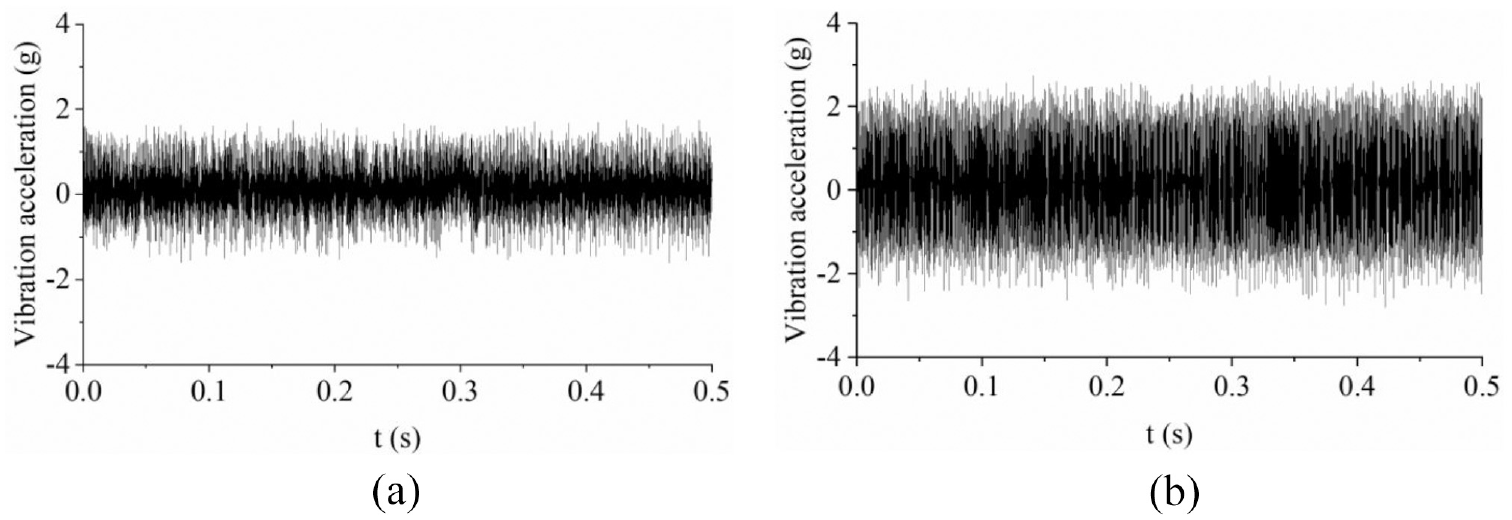
The vibration signal of gearbox: (a) the vibration signal at the start and (b) the vibration signal at the end.
The gear life data measured from the tests was converted into the number of gear runs as shown in Table 2.
The life of the test gear.

Four sets of test gear life distribution
The statistical distribution of gear life is often determined by fitting and testing the data obtained from small sample tests in the form of a hypothetical distribution to determine its life distribution probability. Identifying the distribution probability includes two steps: solving the parameters of the distribution function and testing the distribution. Depending on previous experience, the fatigue life of gears is assumed to obey a lognormal distribution. 33
If the logarithm

The distribution function of the log-normal distribution is

In this paper, we use the K-S test to test whether the gear life follows a log-normal distribution. The K-S test method involves arranging the test data


Taking the 25% lubrication amount partial lubrication test as an example, the gear life is taken as logarithm. It is assumed that the life span after taking the logarithm follows a normal distribution. Since the parameters are unknown, the parameters are first estimated as follows:


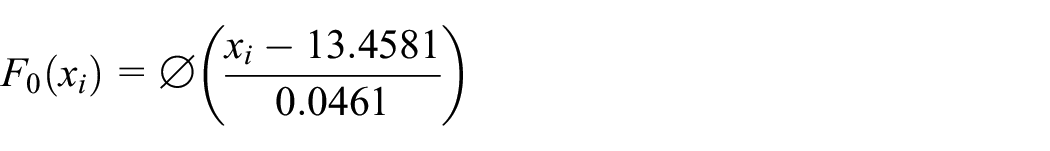
The list of log-normal distribution observations is shown in Table 3.
List of log-normal distribution observations.

From the results in the table, the observed value
Similarly, the other three sets of test gear life distribution were tested, and all of them obey the lognormal distribution.
Four sets of test vibration signal analysis
The formula for calculating the rotation frequency of the gear is

where n is the rotation speed of the gear.
The gear meshing frequency is calculated as

where
By calculation, the rotation frequency of the gear
The vibration acceleration signal was processed using the algorithm of FFT, 34 and the peak frequency in the frequency domain of the vibration acceleration signal was analyzed.
The FFT equation is

where ω is the frequency; f(t) is the time domain signal; and
Figure 6 shows the frequency domain of the health gear vibration acceleration and Figure 7 shows the frequency domain of four sets of test failure gear vibration acceleration. The peak frequencies of 582.93 and 1168.56 Hz in the frequency domain of the health gear vibration acceleration correspond to the gear meshing frequency and the two times meshing frequency, respectively.

The frequency of health gear.

The frequency of test gear: (a) the full lubrication test, (b) the trace lubrication test, (c) the test with 25% lubrication amount, and (d) the test with 75% lubrication amount.
As shown in Figure 7(a), in the frequency domain diagram of the full lubrication test, new higher amplitude frequencies appear in the low frequency region, corresponding to the active gear rotation frequency of 24.25 Hz, the two times frequency of 49.12 Hz, and the three times frequency of 73.45 Hz, indicating that serious pitting failure has occurred in the gears. The gear meshing frequency of 581.21 Hz and the two times meshing frequency of 1169.05 Hz have a small decrease in amplitude, because the generation of severe pitting reduces the meshing stiffness of the gears. A large number of high amplitude side bands appear near the gear meshing frequency of 581.21 Hz and the two times meshing frequency of 1169.05 Hz. A frequency of 605.77 Hz occurs near the meshing frequency, which differs from the meshing frequency by 24.56 Hz; a frequency of 1193.50 Hz occurs near the two times meshing frequency, which differs from the two times meshing frequency by 24.45 Hz. The differences correspond to the rotation of the faulty gear frequency.
As shown in Figure 7(b), in the frequency domain diagram of the vibration acceleration of the trace lubrication test, there is no frequency corresponding to the active gear rotation frequency, the two times frequency and the three times the frequency in the low frequency region. In the high frequency region, the amplitude of the meshing frequency of 582.63 Hz and the two times meshing frequency of 1167.92 Hz increase significantly, indicating that the gear has been seriously worn at this time, producing a large shock vibration.
As shown in Figure 7(c), in the frequency domain diagram of the gear test with 25% lubrication amount, active gear rotation frequency of 24.13 Hz, the two times frequency of 49.36 Hz, the three times frequency of 73.68 Hz appear in the low frequency region with low frequency amplitude. There is a small increase in the amplitude of gear meshing frequency of 582.16 Hz and the two times meshing frequency of 1169.65 Hz. Lower amplitude side frequency bands appear near the gear meshing frequency of 582.16 Hz and the two times meshing frequency of 1169.65 Hz. A frequency of 606.38 Hz appears near the meshing frequency, which is 24.22 Hz different from the meshing frequency; near the two times meshing frequency, a frequency of 1193.83 Hz appears, which is 24.18 Hz different from the two times meshing frequency. The differences correspond to the rotation frequency of the faulty gear.
As shown in Figure 7(d), in the frequency domain diagram of the gear test with 75% lubrication amount, compared to the frequency domain diagram of the gear test with 25% lubrication amount, the active gear rotation frequency, the two times frequency and the three times frequency appear in the low frequency region, but the frequency amplitudes are higher. The amplitudes of gear meshing frequency of 582.45 Hz and two times meshing frequency of 1169.23 Hz have a large increase. Near the gear meshing frequency of 582.45 Hz and two times meshing frequency of 1169.23 Hz, the higher amplitude side frequency bands appear. A frequency of 606.75 Hz differs by 24.30 Hz from the meshing frequency of 582.45 Hz, while a frequency of 1193.51 Hz differs by 24.28 Hz from two times the meshing frequency of 1169.23 Hz. The differences correspond to the rotation frequency of the faulty gear.
By comparing the four sets of frequency domain plots, it can be seen that as lubrication increases, the active gear rotation frequency, the two times rotation frequency, and the three times rotation frequency appear in the low frequency region, and their amplitudes increase with lubrication, indicating that the degree of gear pitting increases with lubrication. The amplitudes of the gear meshing frequency and the two times meshing frequency rise with the loss in lubrication in the high frequency area, indicating that the degree of gear wear increases with the decrease in lubrication.
Test gear pitting morphology and wear depth
Figure 8(a) shows the failure gear with full lubrication test, the fatigue pitting was severe, and a large number of large pitting pits appeared from the top to the root of the teeth. Figure 8(b) shows the failure gear of the test with 25% lubrication amount, the fatigue pitting was slight, only a few small pitting pits were sparsely distributed. Figure 8(c) shows the failure gear of the test with 75% lubrication amount, the pitting pits were mainly distributed near the tooth profile node, and there were fewer pitting pits near the tooth root and tooth top, indicating that pitting is most likely to occur near the tooth profile pitch. As in Figure 8(d), the gear of the trace lubrication test occasionally produced a small number of pitting pits, and the tooth surface produced severe friction.

The pitting morphology of the test gear: (a) the full lubrication test, (b) the test with 25% lubrication amount, (c) the test with 75% lubrication amount, and (d) the trace lubrication test.
According to the fatigue pitting of each group of test gears, it can be found that the degree of fatigue pitting of gears increases with the increase of gear lubrication, which indicates that good lubrication conditions can easily lead to fatigue pitting of gears.
Wear depth of test gears
The principle of surface profile measurement method is applied to obtain the wear depth of the gear from the top of the tooth to the root of the tooth. Since the tooth root has a more serious stress concentration, the wear depth on the root of the tooth is used as the study object. The wear depths of the four sets of tests are shown in Figure 9. It can be found that the wear depth of the fully lubricated test gear is the smallest, the wear depth of the trace lubrication test gear is the largest, and the wear depth of the gear increases with the deterioration of the gear lubrication conditions.

The wear depth on the root of gears: (a) the full lubrication test, (b) the trace lubrication test, (c) the test with 25% lubrication amount, and (d) the test with 75% lubrication amount.
Scanning electron microscope observation and analysis of tooth surface
Figure 10 shows the profiles of the teeth under the four operating conditions. Figure 10(a) shows the tooth surface of the full lubrication test, it can be seen that the tooth surface has obvious fatigue pitting phenomenon, pitting pits are large and dense, parts of the pitting pits have the tendency to connect into pieces. The gear failure is mainly fatigue pitting, wear loss is slight. Figure 10(b) shows the gear surface of the trace lubrication test. Under the low magnification display, there is no obvious fatigue pitting on the tooth surface. Only under the high magnification display, a few small cracks can be found, and the distribution of these cracks is rather scattered. At this condition, the main form of gear failure is wear and fatigue pitting is slight. Figure 10(c) shows the gear of the test of 75% lubrication amount. The fatigue pitting phenomena can be visible on the tooth surface. The pitting pits are generally solitary pits that do not grow rapidly. Compared with the full lubrication test, the degree of fatigue pitting on the tooth face eases a little and the tooth face wear is a little more serious, with a small amount of wear. Figure 10(d) shows the gear of the test with 25% lubrication amount, it can be seen that the tooth face pitting pits are smaller and shallower, secondary cracks are rare and the pitting pits show basically no signs of expansion. Wear phenomenon is more serious, fatigue pitting phenomenon is less. From the above SEM results, it can be found that fatigue gradually dominates when the amount of lubrication increases, which verifies the numerical analysis result that fatigue destroys the resistance to wear and dominates when the crack extension reaches a critical value in Wang and Gao. 21

Tooth surface profile in SEM: (a) the full lubrication test, (b) the trace lubrication test, (c) the test with 75% lubrication amount, and (d) the test with 25% lubrication amount.
Figure 11 reflects the interaction between the fatigue and wear of the gear. Figure 11(a) shows the interaction mechanism of the full lubrication test. Large fatigue pitting pits are clearly visible. The initial surface cracks next to the pitting pits are relatively well preserved, indicating that the effect of wear on fatigue pitting is minimal. Figure 11(b) shows the interaction mechanism of the trace lubrication test. It can be seen that the wear of the tooth face has worn away most of the extended fatigue crack. The wear rate of the tooth face in the trace lubrication test is greater than the extension rate of the fatigue crack, and the fatigue crack will be worn away as the tooth face is continuously engaged. Figure 11(c) shows the interaction mechanism of the test of 75% lubrication amount. There is an effect of tooth wear on the crack extension. It can be seen that the crack extension has reached a certain depth, some fatigue cracks are wore off, but the crack extension rate is larger, and fatigue pitting will continue to form slowly. Figure 11(d) shows the interaction mechanism of the gear test with 25% lubrication amount. The more severe the wear, the more the crack growth direction tends to the surface, making the crack susceptible to fracture. More severe use will wear away the cracks over time, resulting in shallow pits and less fatigue pitting. When the above mechanism of gear wear-fatigue interaction is combined with Morales-Espejel and Brizmer’s 11 numerical model of bearing failure and Wang et al.’s 13 research on the relationship between frictional wear and contact fatigue of wheel and rail, it can be concluded that fatigue and wear have a mutually governing relationship under sliding-rolling friction with high contact stress. When fatigue cracks are inhibited by wear, the direction of crack growth is closer to the surface, and the damage is dominated by fatigue when the wear is minor, while the damage is dominated by wear when the wear is severe.

Wear-fatigue interaction of test gear: (a) the full lubrication test, (b) the trace lubrication test, (c) the test with 75% lubrication amount, and (d) the test with 25% lubrication amount.
Conclusion
Four sets of gear transmission tests with different lubrication amounts were completed in order to investigate the characteristics and mechanism of wear-fatigue interaction of gear transmission under different lubrication conditions. The distribution of gear life under different lubrication amounts was examined, the frequency domain response characteristics of gear wear-fatigue interaction under different lubrication amounts were analyzed, the gear characteristics and tooth surface wear depth were gathered, and SEM was used to investigate the mechanism of gear wear-fatigue interaction under various lubrication conditions. The following are the conclusions obtained in this study.
The life distribution of gear transmission wear-fatigue interaction under different lubrication conditions obeys log-normal distribution.
The frequency domain analysis of the vibration signal is introduced into the analysis of wear-fatigue interaction of gear transmission, and good results are achieved. The frequency domain characteristics of the wear-fatigue interaction of gear transmission under different lubrication conditions are as follows. In the frequency domain, with the increase of lubrication, the gear rotation frequency and its harmonic frequency representing pitting failure appear in the low frequency region and around the gear meshing frequency and its two-frequency. The amplitudes of these frequencies increase with the increase of fatigue severity. The gear meshing frequency and its two-frequency amplitude decreases, indicating that the wear damage on the tooth surface is reduced.
The influence of lubrication on the gear wear-fatigue relationship is substantial. The following is the mechanism of gear wear-fatigue interaction under different lubrication conditions. When the lubrication is good, the tooth surface wear is little, the fatigue crack expansion rate is greater than the wear rate, pitting corrosion is easy to occur, and the gear damage is primarily fatigue. When the lubrication condition is poor, tooth wear is more severe, wear causes the crack expansion direction to tend to the surface. When the wear rate exceeds the crack growth rate, fatigue cracks are gradually worn off, inhibiting the formation of pitting, and the gear damage is primarily wear. Under sliding-rolling friction with high contact stress, wear and fatigue in gear transmission show a competitive relationship of mutual constraints.
Footnotes
Handling Editor: Chenhui Liang
Declaration of conflicting interests
The author(s) declared no potential conflicts of interest with respect to the research, authorship, and/or publication of this article.
Funding
The author(s) disclosed receipt of the following financial support for the research, authorship, and/or publication of this article: This study was supported by the National Natural Science Foundation of China (Grant No. 51775097).