
Abstract
The properties of crushing and absorbing energy are important for the security of automobiles. In this work, the crushing curves and section features of Al–Zn–Mg alloy twin-cell thin-walled profiles were studied in detail. The crushing process comprises four typical stages: near-elastic deformation, hinge forming, hinge tightening, and folding stages. It was found that, in the near-elastic stage, the relationship between crushing force and displacement is approximately linear. The crushing moment in the hinge-forming stage conforms to the principle of conservation. The crush curve in the hinge-tightening stage conforms to the cosine hypothesis. The folding stage involves a repetition of the hinge-forming and hinge-tightening stages. Moreover, numerical models of these stages are built and compared with measured data to demonstrate the accuracy and validity of these models.
Introduction
The energy-absorbing box is an important part of the anticollision safety system of automobiles and can improve the passive safety of automobiles and reduce the reparation cost after impact.1–3 The energy-absorbing box generally uses a thin-walled hollow profile to reduce weight and to achieve an energy-absorbing effect.4,5 In the process of collision, achieving the perfect folding of the profile to obtain an excellent energy-absorbing effect has consistently directed the design and selection of energy-absorbing box materials. Generally, the energy-absorbing thin-walled profiles are subjected to a crushing test, which simulates the collision process, and the performance is evaluated by assessing folding morphology, crushing curve, and crushing energy absorption.4,6 Therefore, the crushing process has become the focus of research on materials used in automobile safety components.
The research on crushing performance mainly focuses on the structure and materials of components. The finite element method has been mainly used for structure optimization and to improve the energy absorption effect during crushing.7–11 The study of Zhang and Zhang, 10 based on a simplified FE model, investigated the energy absorption characteristics of angle elements with three panels using the nonlinear finite element code LS-DYNA. Fan et al. 9 studied the quasi-static axial compression of thin-walled tubes with different cross-sectional shapes. It was found that increasing the number of corners helps to improve energy absorption. Gao et al. 8 proposed a novel crash box based on a cylindrical cellular structure with a negative Poisson’s ratio and constructed the analytical model of mechanical properties for the double-V unit cell under large deflection. It was found that the optimized auxetic cylindrical structure has higher specific energy absorption, and there are no dramatic fluctuations in the crushing force during the impact process. The experimental method is mainly used to study the influence of materials on crushing performance by adjusting the microstructure of the material to improve its mechanical properties, thereby improving the crushing performance.12–16 Arnold et al. 13 conducted experimental observations on the crush characteristics of AA6061 T4 and T6 structural square tubes. The results show that material properties, especially hardening capacity and ductility, have a significant effect on collapse mode and energy absorption. Wang et al. 14 studied the effect of heat treatments on the crushing behavior and energy-absorbing performance of aluminum alloy foams. It was found that T6-strengthened treatment can increase the strengths and energy-absorbing capacities of Al–Mg–Si foams in both quasi-static and dynamic cases but has little effect on Al–Mg foams. These studies mainly discussed the influence of structure and material on the results after crushing and did not study the crushing process.
The folding morphology and energy absorption during crushing are directly related to the crushing process and curve. In our previous work, 17 the crushing process of Al–Mg–Si alloy simple cell thin-walled profiles with lower strength was studied, fitted, and the curve predicted, and good results were achieved in verifying the principles and assumptions. In this work, we carried out further research on the crushing process of Al–Zn–Mg alloy with high strength and complex twin-cell structure. The physical and mathematical model of this process was established and verified using an experimental sample of Al–Mg–Si alloy.
Materials and methods
To study the influence of mechanical properties on crushing behavior over a wide range, we designed four Al–Zn–Mg alloys with different compositions, as shown in Table 1. An Al–Zn–Mg alloy rod with a diameter of 230 mm was heated to 510°C and then extruded into a twin-cell thin-walled profile, as shown in Figure 1(a) and (b). During extrusion, online water mist cooling was adopted, the extrusion speed was 5 ± 0.2 m/min, the extrusion ratio was 28, and the total cross-sectional area of the profile was 1553.4 mm2. After extrusion, the alloy was placed in the heat treatment furnace for two-stage aging (105°C/5 h + 155°C/18 h).
Chemical composition of Al–Zn–Mg alloys (wt.%).


(a) Cross-sectional dimensions and (b) macrograph of the sample.
A room temperature tensile specimen was cut along the extrusion direction of the profile, and the tensile test was performed on a 2382 (100 KN)-INSTRON universal testing machine at a tensile speed of 2 mm/min. A profile of 300 mm length was selected for the crushing test using the WAW-1000FC single-space hydraulic universal testing machine, in which the profile was vertically compressed to 200 mm at a speed of 100 mm/min, and the magnitude of the loading force and the indenter displacement were recorded in real time. Three parallel samples were used for testing, and the data closest to the average value was selected to plot curves.
Results and discussion
Room temperature tensile properties
Figure 2 shows the tensile properties of the four alloys at room temperature. The mechanical properties of the four alloys show obvious differences based on differences in their composition. Going from the Y400 to Y270 alloy, the yielding and ultimate tensile strengths decrease gradually. The yielding strength of the four alloys varies from 270 to 400 MPa, see Table 2, which represents a large range of strengths for subsequent calculations. It is in line with the original intention of the alloy design.

Tensile properties of the four alloys (Y270, Y340, Y370, and Y400) at room temperature as indicated by stress–strain curves.
Results of the room temperature tensile tests.

The crushing curve corresponds to the characteristics of each section
Figure 3 shows the macrographs of the sample after crushing, as well as the cross-sectional views of A–A and B–B sections. It can be seen that all samples folded regularly without cracking. The unit cell morphology of the A–A section was close to that of the B–B section. The plastic hinges on the same wall were alternately folded inward and outward and were distributed symmetrically.

(a) Overall crushing morphology and (b) section diagram; (c) A–A section and (d) B–B section.
Figure 4 shows the crushing curve for a sample. The characteristics of the B–B section at extreme points can be obtained by stopping the test at extreme points. According to the crushing curve, section characteristics, and displacement of the extreme points of each sample, the crushing process can be divided into the following four typical stages:
Near-elastic deformation stage. In the initial stage of crushing, the crushing force increases linearly with the change in displacement. Before reaching the first peak, there is a very small period of slowdown in growth. This is because the sample begins to yield, and the plastic hinge begins to form. Although there will be plastic deformation at the end before reaching the peak, the whole stage can be approximately regarded as an elastic section;
Hinge-forming stage: After reaching the first peak, the crushing force begins to drop sharply until the first valley. In this process, the first plastic hinge begins to form. The reason for the sharp drop in crushing force is that when the plastic hinge is formed, the crushing effect on the sample changes from axial pressure to axial moment;
Hinge-tightening stage: When the two arms of the plastic hinge contact each other, the plastic hinge begins to compress, and the crushing force begins to increase again. However, due to sample deformation, the increasing section no longer has only elastic deformation, and the value is much smaller for the second peak than the first peak. After the hinge-tightening stage, the second plastic hinge begins to form again;
Folding stage: The processes of hinge forming and hinge tightening are repeated until crushing is complete. However, since the mechanical properties of materials cannot be uniform, the samples will lose stability in the actual folding stage.

Crushing curves at the (I) near-elastic plastic stage; (II) hinge-forming stage; (III) hinge-tightening stage; (IV) folding stage.
The displacement characteristics of extreme points can be obtained by counting the displacement of extreme points, as shown in Figure 5. It can be seen that in the first three stages of the crushing process, the extreme points of crushing are stable, with few fluctuations. However, the crushing process is unstable in the folding stage. The extreme values fluctuate greatly, and the displacement interval between extreme values is no longer constant.
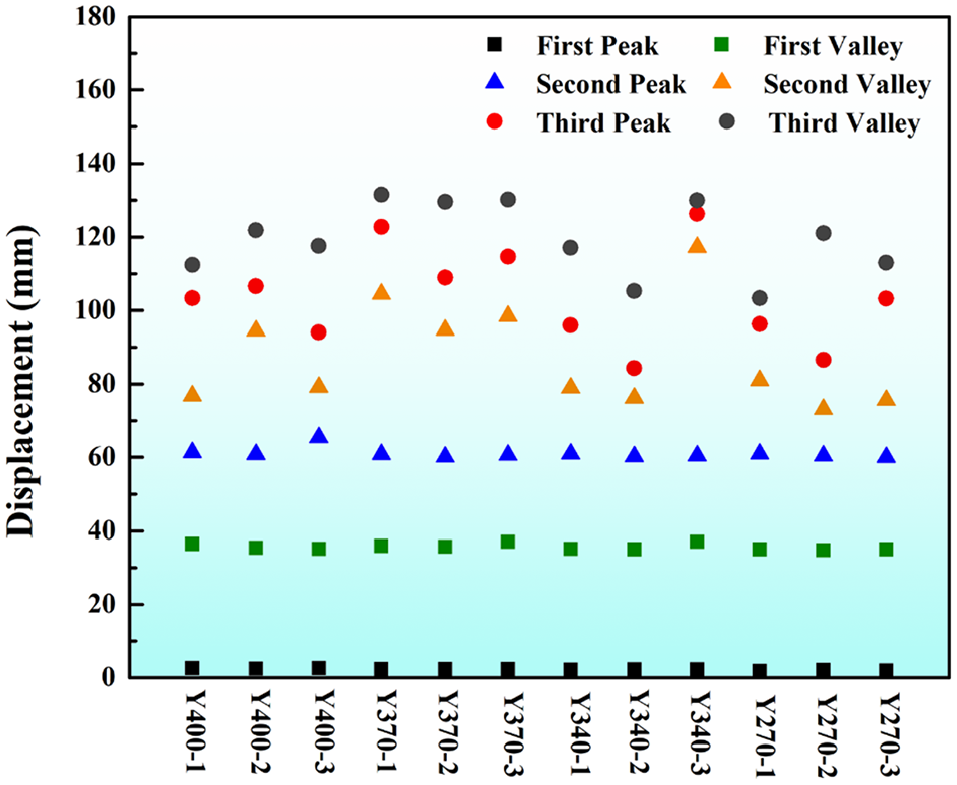
Displacement of the extreme point of the collapse curve.
Calculation of crushing curve
Linear relationship between crushing force and displacement in the near-elastic stage
Figure 4 shows that the sample does not reach the first peak after yielding. Thus, the first peak load (peak load for short) is closely related to the yielding strength. As shown in Figure 6, it can be seen that the relationship between peak load and crushing force is approximately linear. Since the sample is a twin-cell reinforced structure, the peak load of the sample is also related to the structural strength. At the same time, because the section of the sample is constant, we can assume that the peak load of the sample has the following linear relationship with the yield strength and structural strength:


Relationship between peak load and yield strength.
where σp is the peak stress, Fp is the peak load, A is the sectional area, σ0.2 is the yield strength, k is the structural strengthening factor, and σs is the structural strength. A, k, and σs are constants because all samples have the same cross section.
Formula (2) can be obtained by fitting the peak load and yield strength in Figure 6, and the correlation coefficient (R2) of the fitting result is 0.99. According to Formulas (1) and (2), k is 0.61 and the structural strength σs is 80.6 MPa.

Figure 7 shows the relationship curve between the first peak displacement and the yield strength. The peak displacement also has an approximately linear relationship with the yield strength, which can be fitted as Formula (3):


Relationship between peak load displacement and yield strength.
where sp is the peak displacement. Combining Formulas (2) and (3), since the crushing strain–displacement curve of the near-elastic stage passes through the two points (0, 0) and (σp, sp), the crushing strain–displacement and crushing force–displacement must satisfy Formula (4).

Since the relationship between the crushing force and displacement of the near-elastic stage is close to linear, the curve of the crushing force and displacement for the near-elastic stage can be calculated using Equation 4. Figure 8 shows the comparison between the measured and calculated results for the near-elastic stage of the four alloys, which can be seen to have good agreement.

Comparison of the calculated and measured results in the near-elastic stage for the (a) Y400 sample; (b) Y370 sample; (c) Y340 sample; (d) Y270 sample.
Conservation of moment in the hinge-forming stage
A plastic hinge begins to form after the sample yields, as shown in Figure 9. After plastic hinge forming, the driving force of sample deformation changes from axial crushing force to crushing moment perpendicular to plastic hinge arm. According to Figure 9, the crushing moment can be calculated by Formula (5):


Deformation diagram of the bending section: (a) schematic diagram of torque calculation; (b) the cross section photo at the crushing displacement of 10 mm.
where N is the crushing moment, H is the plastic hinge arm, and θ is half of the plastic hinge angle. Fcosθ is the component of crushing force perpendicular to the plastic hinge arm. In this study, the plastic hinge arm is a parameter related to the structure of the sample. According to the statistical analysis of cross sections of samples with different strengths, it is found that when there is no instability in the crushing process, the plastic hinge arm remains constant about 35 mm. As shown in Figures 9 and 10, the constant value of H is based on the actual measurement results of a large number of crushing tests, even if there are some inevitable deviations.
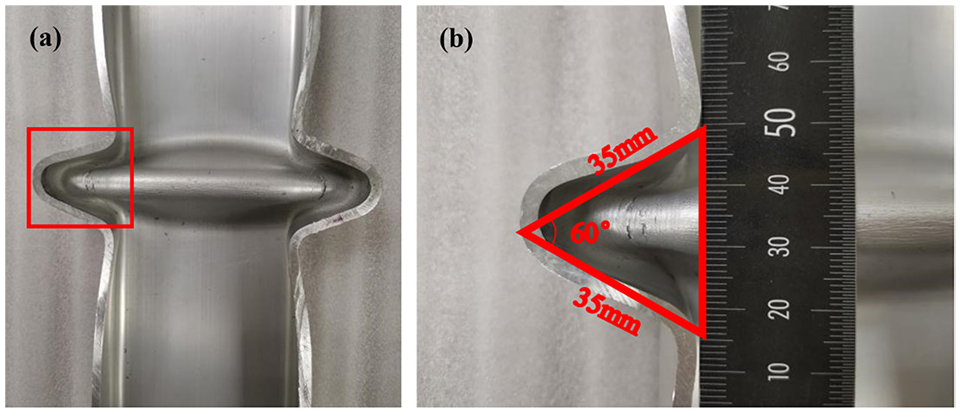
(a) cross section of the first valley; (b) magnification of the framed area in (a).
In the crushing curve, the crushing force F of the hinge-forming stage decreases continuously. However, during the crushing, the plastic hinge angle decreases and Fcosθ increases. This leads to uncertainty in the change of crushing moment. Figure 11 shows the variation in the Fcosθ value of the hinge-forming stage for the four alloys. the Fcosθ value changes little in the hinge-forming stage, and the crushing torque can be considered to be constant. According to the conservation of moment, the peak moment can be used to directly calculate the crushing force–displacement curve of the hinge-forming stage; see Equation 6:
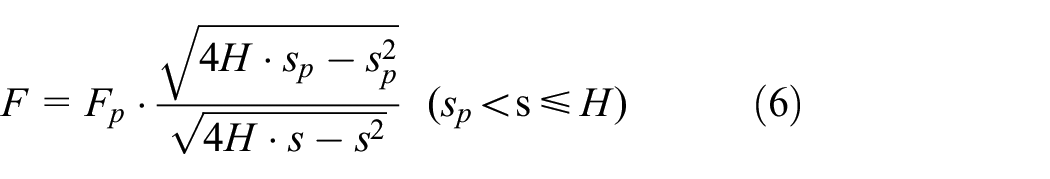

Relation between Fcosθ and displacement of each specimen in the bending stage.
where s is the crushing displacement. Fp and sp can be calculated by σ0.2 (see Formulas (2) and (3)), and H is a constant. Therefore, the hinge-forming stage of the crushing curve can be calculated directly by Equation 6. It can be seen from the crushing curves of all samples that when the first plastic hinges are fully formed, the displacement of the first valley point is 35 mm, which is equal to the size of plastic hinge wall. At this time, the plastic hinge angle is 60°, as shown in Figure 10. Therefore, the application range of Formula (6) is (sp, H).
Figure 12 shows the comparison between the calculated results of the crushing curve and the measured data, which show a good correlation. It can be seen that the accuracy of the calculation results is related to the yield strength and structure. When the yield strength is lower and the folding is more complete, the calculated results are more consistent with the measured results, as shown in Figure 12(d). However, these deviations mainly arise from incomplete folding caused by uneven deformation during the crushing process. Therefore, the assumption of moment conservation during the hinge-forming stage is reasonable.

Comparison of the calculated results of bending section with the measured results (a) Y400 sample; (b) Y370 sample; (c) Y340 sample; (d) Y270 sample.
Cosine hypothesis of the hinge-tightening stage
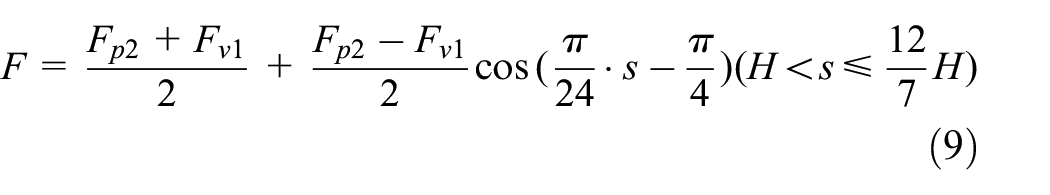
The hinge-tightening stage is a complex process in which compaction of the first plastic hinge and formation of the second plastic hinge occurs at the same time, and the crushing force increases from the first valley to the second peak. This stage is similar to the cosine function in the contour of the curve. Assuming that the crushing force–displacement curve of the hinge-tightening stage conforms to the cosine function, it can be expressed as Formula (7):

where Fp2 is the second peak load and Fv1 is the first valley load. The range of s is obtained through the actual measurements in the crushing test; see Figure 13. When the crushing force reaches the second peak load, the plastic hinge is compacted, and the crushing process enters the hinge-forming stage again. Therefore, Fp2 can be calculated by Formula (8), Fv1 can be calculated by Formula (6), and then Formula (7) can be transformed into Formula (9). The crushing curve of the hinge-tightening stage calculated by Formula (9) is shown in Figure 14.


The folding stage: (a) calculation schematic diagram; (b) force–displacement curve of calculations.

Comparison between the calculated results and the measurement results of the crushed sample (a) Y400 sample; (b) Y370 sample; (c) Y340 sample; (d) Y270 sample.
Fitting of the folding stage
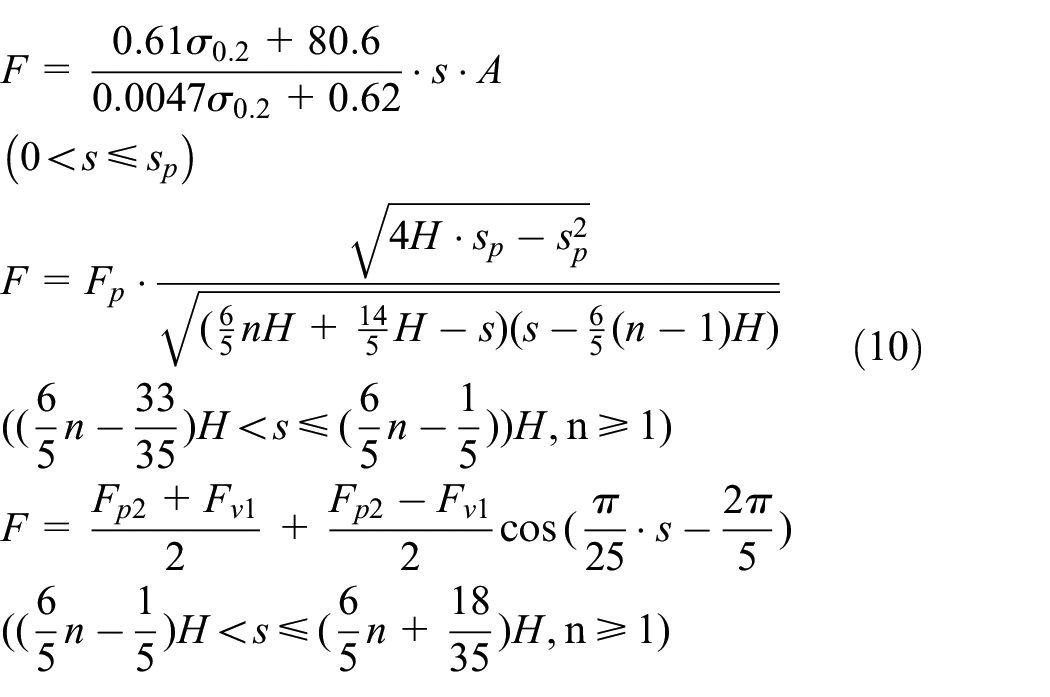
The sample is folded repeatedly throughout the folding stage. If the sample is folded perfectly, it will cycle repeatedly through the hinge-forming and hinge-tightening stages. At this time, the formula for calculation of the crushing force–displacement curve of the overlapping section of the curves can be obtained by adjusting the applicable range of Formulas (6) and (9). The complete crushing curve can be calculated by Formula (10). However, due to the heterogeneity of the microstructure and mechanical properties of materials, the actual folding stage is unstable and cannot be folded perfectly. Therefore, as shown in Figure 15, in the folding stage of the complete crushing curve, the calculation results are quite different from the actual situation. Therefore, it is more accurate to predict the near-elastic deformation, hinge forming, and hinge tightening stages by Formula (10). However, we compared the calculated results (according to Formula (11)) and the measured results of the crushing energy absorption curves, as shown in Figure 16. The calculated results perfectly fit the measured results. That is, when the folding is perfect, the calculation result by Formula (10) could accurately predict the whole crushing process.


Calculation and measurement results of the collapse curve (a) Y400 sample; (b) Y370 sample; (c) Y340 sample; (d) Y270 sample.

Calculation and measurement results for the crush absorption energy (a) Y400 sample; (b) Y370 sample; (c) Y340 sample; (d) Y270 sample.
Conclusions
In this study, the calculation method for the crushing force–displacement curve of a double cell structural profile was studied based on the crushing of four Al–Zn–Mg alloys with different yielding strengths resulting from their varied composition. The following conclusions were drawn through the statistics and fitting of the measured data:
The crushing process can be divided according to the characteristics of the crushing curve and cross section into near-elastic stage, hinge-forming stage, hinge-tightening stage, and folding stage;
In the near-elastic stage, the relationship between crushing force and displacement is approximately linear. The peak load and peak displacement are directly related to the yield strength of the material, and the crushing curve of this stage can be directly determined by the yield strength;
In the hinge-forming stage, the statistics of the measured moment in the crushing process show that there is a phenomenon of moment conservation. With this assumption, the crushing curve of this stage can be calculated using the peak load;
In the hinge-tightening stage, the crushing curve is characterized by a cosine relationship.
In the folding stage, due to the inhomogeneity of microstructure and mechanical properties, the calculated results of the crushing force-displacement curves no longer completely coincide with the actual results, but the calculated crushing energy absorption curve has a good coincidence with the actual results.
Footnotes
Handling Editor: Chenhui Liang
Declaration of conflicting interests
The author(s) declared no potential conflicts of interest with respect to the research, authorship, and/or publication of this article.
Funding
The author(s) disclosed receipt of the following financial support for the research, authorship, and/or publication of this article: This work was financially supported by the 2020 Jiangmen Innovation Practice postdoctoral research project (grant number JMBSH2020C07) and Kam Kiu Aluminium Products Group Limited.