
Abstract
The most important goal of monitoring and analysis of vibration is to provide information on the operational and technical condition of equipment in order to ensure strategic planning and maintenance management. The article addresses integration of vibrodiagnostics into the system of predictive maintenance in the operation of turbo generators of a small hydropower plant. Small hydropower plants are specific for their ability to provide relatively stable output without unnecessarily burdening the transmission system. Modern turbines are expected to be highly efficient and reliable in operation. By including these devices into the predictive maintenance system, it is possible to identify their possibly unusual behavior, estimate the remaining service life, and draw attention to incorrect setting of operating parameters. The task of research in this area was to evaluate the applicability of data obtained from vibrodiagnostics to identifying turbo generator failures and key parameters that may have a potential impact on the behavior of this type of equipment.
Introduction
Proactive maintenance methods represent an important tool not only of cost management, but also of protecting all elements in the system of human-machine-environment. The basic idea of modern maintenance is to move maintenance from the “ex post” event stage to the “ex ante” stage. Thus, maintenance planning and methods of preventive, predictive, and proactive maintenance are applied. When maintaining technical systems, it is important to ensure trouble-free operation for as long as possible and to maximize the life of machinery and equipment. In preventive maintenance, this goal is achieved by setting regular service intervals, during which minor repairs and inspections of the relevant equipment are performed. However, a problem with such approach is to determine an optimal service interval. Frequent service interventions increase maintenance costs and also have an impact on production (should they require shutting down of the production equipment). 1
Predictive maintenance seeks to identify the right moment for maintenance using advanced statistical methods and, nowadays, using the tools of artificial intelligence. Unlike preventive maintenance, the maintenance of each device is assessed and planned based on the current state of the device, with various models estimating the time and date to failure. Subsequently, it is possible to extend or shorten maintenance cycles according to the real state in which the equipment is found. 2 Thus, the predictive maintenance approach is to repair only those things on machines and equipment that are absolutely necessary to be repaired at the time when such repair is necessary.
Predictive maintenance allows2,3:
to predict failure
to identify unusual system behavior
to identify incorrectly set operating parameters
to estimate the remaining life of the technical system
Predictive maintenance requires the so-called Condition Monitoring, that is, monitoring symptoms of developing defects. Such approach requires technical troubleshooting tools be applied. Its effectiveness depends on the people, the technologies used, and also the instrumentation. 4 Methods of technical troubleshooting such as thermodiagnostics, tribodiagnostics, vibration diagnostics, defectoscopy, etc. can be included here.
Proactive maintenance eliminates the causes of machine damage. It is this reason that makes the use of the means of technical troubleshooting indispensable. Vibration troubleshooting plays an important role in determining the current state of rotary machines.
Vibrations represent an operating parameter enabling to assess low-frequency dynamic states, such as imbalances, misalignments, mechanical backlash stemming from the positioning, structural resonance, insufficiently rigid foundations, etc. 4 Vibrations are incidental of the behavior of technical equipment during operation. In machines, vibrations arise from movement of their parts. In principle, they arise when the speed of the motion of the mass changes during rectilinear movement, movement along a curved trajectory, or rotational movement. Vibrations are also caused by mutual contact of individual parts. Since machines and equipment contain parts that move in such way, these are a source of forces causing vibration of the machinery as such. Each part of the machine is interconnected with a certain final stiffness with the final mass of individual parts. Such part forms a resonant mechanical circuit, which is excited by active excitation forces. Thus, each machine has individual vibration manifestations, and these are typical for how that particular machine works.
However, during operation of devices, the connections of the individual parts change. Bearings wear down, changes in the mass of worn parts occur, etc. These facts also result in a change in the vibration of the equipment in operation. As most malfunctions of rotary machines are manifested by excessive vibrations, vibration signals are used as indicators of the machine’s mechanical condition. Each mechanical error or defect generates vibrations in its own specific way. In order to determine their cause and select the optimal remedial action, it is important to identify the type of vibration.
Vibration measurement is not a major problem. The aim is to analyze the signals and subsequently identify the causes of the problem. In the analysis of vibration signals, attention is paid to its two basic components: frequency and amplitude. Frequency represents the number of occurrences of a certain phenomenon over a certain period of time. Based on the vibration frequency, it is possible to characterize a type of malfunction. Identification of the frequency at which the vibrations occur paints a picture of their cause. The amplitude represents the magnitude of the vibration signal. It is related to severity of the malfunction. 4
Total vibrations represent the total vibrational energy measured within a certain frequency range. The following expressions are used to measure total vibrations 4 :
peak value (PV)
peak to peak (PtP)
average value (AV)
root mean square amplitude (RMS)
An important method for monitoring vibration signals and their subsequent analysis is the FFT method – Fast Fourier Transformation. Through the FFT vibration analysis, it is possible to identify whether a device malfunctions and what problem in the device is the source of such excessive vibrations. Since it is clear that a certain defect occurs at certain frequencies, the FFT spectra are analyzed through monitoring changes in amplitudes in these frequency ranges. 4
An overview of scientific works devoted to the subject
In their work, the authors Sadettin Orhan, Nizami Aktürk, and Veli Çelik addressed the issue of vibrodiagnostic application to the system of predictive maintenance. In their study “Vibration monitoring for defect diagnosis of rolling element bearings as a predictive maintenance tool: Comprehensive case studies,” they focused on the application of vibration monitoring and spectral analysis as a predictive maintenance tool. They confirmed that the behavior of the bearings can be assessed using vibrations they generate. They also concluded that if vibration monitoring is carried out at regular intervals, system malfunctions can be easily detected and, of course, eliminated. 5
Carmen Carnero has published a work titled “Selection of diagnostic techniques and instrumentation in a predictive maintenance program. A case study.” In her article, she argues that vibration and lubricant analysis are among the most commonly used predictive maintenance techniques nowadays. Mutual integration of these methods in a predictive maintenance system can provide significant savings for the company and the society. 6
In their article, Hsiung-Cheng Lin, Yu-Chen Ye, and Bo-Jyun Huang state that the level of vibration generated is often perceived as synonymous with quality and organization of predictive maintenance. Any defect in the bearing causes vibrations that consist of certain frequencies depending on the nature and location of the defect. 7
In their published work, namely in the article titled “Maintenance of bogie components through vibration inspection with intelligent wireless sensors: A case study on axle-boxes and wheel-sets using the empirical mode decomposition technique” Trilla and Gratacos deal with modifying the strategy of predictive maintenance of railway transport systems bogies with the possibility of permanently attaching an intelligent sensor to the bogie frame of such system. 8
The authors of the scientific work “Data Analysis for Predictive Maintenance of Servo Motors” Oguz Girit, Gurcan Atakok, and Sezgin Ersoy – dealt with the position of vibrodiagnostics in the system of Industry 4.0. The troubleshooting system designed and developed by the authors provides a method of measuring vibrations and temperature in real time. Such troubleshooting system obtains real-time information and provides a tool for early detection of malfunctions in the devices of the systems under assessment. 9
In their scientific article “Fusion of Vibration and Current Signatures for the Fault Diagnosis of Induction Machines” by Meng-Kun Liu, Minh-Quang Tran, and Peng-Yi Weng, addressed the application of vibrodiagnostics to induction machines. Numerous fault detection and isolation techniques for the diagnosis of induction machines have been proposed over the past few decades. Among these techniques, motor current signature analysis (MCSA) and vibration analysis are two of the most common signal-based condition monitoring methods. They are often adopted independently, but each method has its strengths and weaknesses. This research proposed a systemic method to integrate the information received from the vibration and current measurements. 10
Definition of the investigated problem
Based on the request of our partner, we did troubleshooting measurements and assessment of the operational status of the Francis TG1 and TG2 turbine system in the company Malá vodná elektráreň (SHPP – Small hydropower plant) S7 Gabčíkovo (Figure 1). Based on the measurements and their subsequent analyzes, it was also important to propose measures applicable to the process of proactive maintenance of the monitored turbines of the small hydropower plant.
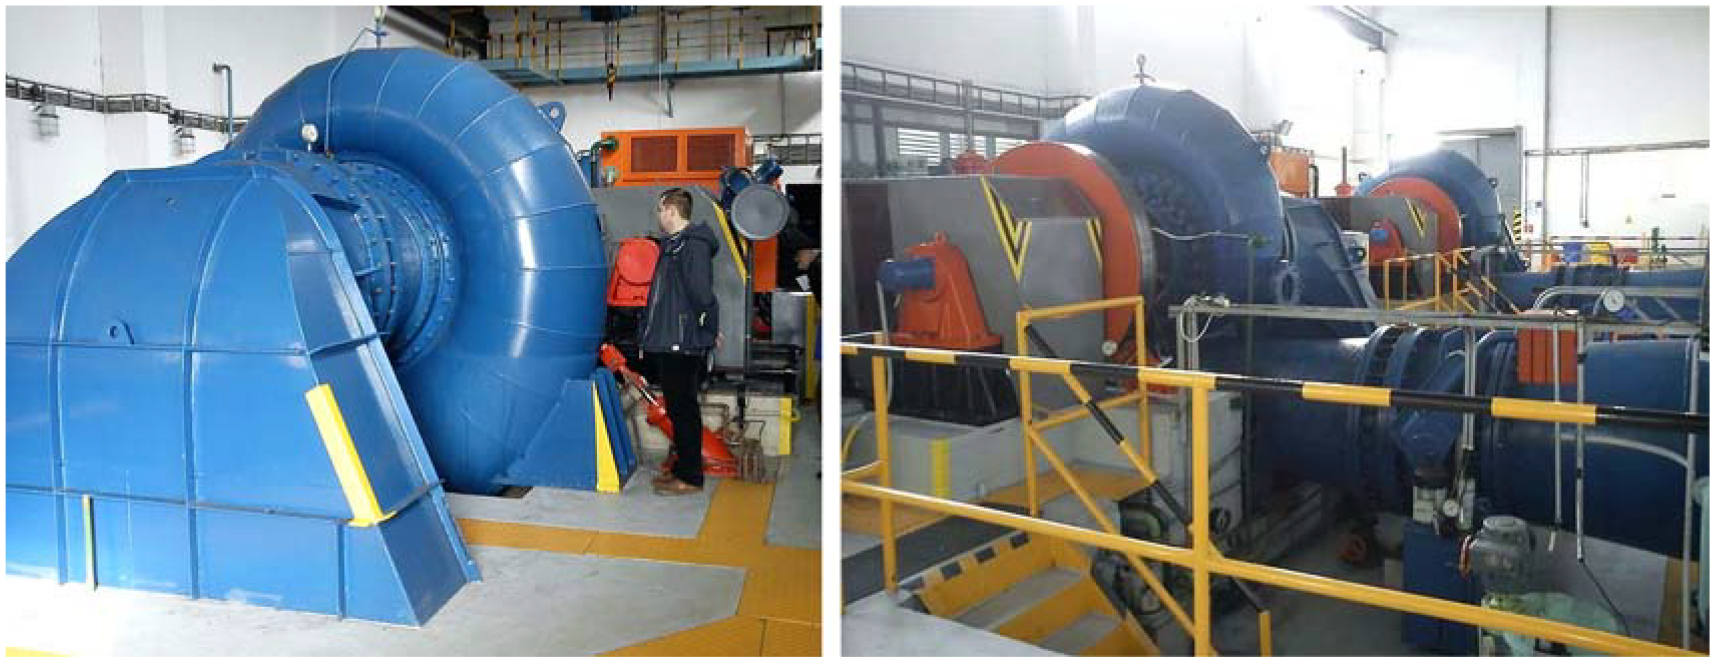
System of Francis turbines TG1 and TG2 at SHPP Gabčíkovo.
The task of this SHPP is to ensure water supply to the irrigation canal S7 on the inlet immediately preceding the navigation chambers of the Gabčíkovo dam. The aim of the troubleshooting activities was to measure and analyze the dynamic signal of selected nodes during proper operation and to assess the current technical condition of the monitored devices. In addition to the troubleshooting activities carried out, it was important to conduct research in the field of integrating the results of vibration signal analysis into the predictive control process, considering the estimated life of the rotary machines monitored.
Technical characteristics of the monitored system:
Number of turbo generators: 2
Turbine type: Francis
Rated power: 585 kW
Generator speed: 500 rpm−1
Turbine speed: 360 rpm−1
Pulley diameter D1: 800 mm
Pulley diameter D2: 576 mm
Vibration measurements were done in accordance with the recommendations of the technical standard STS ISO 10816-3. The following were used in troubleshooting vibration measurements (data collection) and subsequent analysis:
SKF MicrologGX frequency analyzer and data collector
software SKF AptitudeAnalyst
SKF manufacturer Condition Monitoring (USA)
vibration sensor, accelerometer Wilcoxon Research, Model SKF786M, sensitivity 100 mV/g, frequency range 1–20,000 Hz
To assess vibration in the low frequency range, the following were used:
measurement method Velocity (jitter speed), unit mm/s, RMS detection
pursuant to recommendations of ISO10816-3, the FFT spectrum for the frequency range 2–1000 Hz
measurement method Enveloping Acceleration – EnvAcc, unit gE, detection Peak, for frequency area up to 1000 Hz, FFT spectrum, and Time logs.
The following were applied to assess high frequency vibration:
measurement method Acceleration – Acc (jitter acceleration), unit g, PtP detection, frequency range up to 6.4 kHz, FFT spectrum, and Time logs
measurement method Enveloping Acceleration, gE units, Peak detection, frequency range up to 10 kHz and up to 20 kHz, FFT spectrum, and Time logs.
The following were used for assessments in the field of acoustic propagation and ultrasound:
measurement method See (SKF), unit See, Peak detection, frequency range up to 600 kHz, FFT spectrum, and Time logs
HFD measurement method (SKF), oscillation (acceleration) analysis in the frequency range of 40 kHz.
Figure 2 shows a block diagram of the technical system under assessment with the location of measuring sites 1–6 (OK – impeller, 1 – turbine shaft bearing mounting at the impeller, 2 – turbine shaft bearing mounting, 3 – small pulley bearing mounting, 4 – small pulley bearing mounting at the generator clutch, 5 – generator shaft bearing mounting at the clutch, 6 – generator shaft bearing mounting). The measurements were done in three perpendicular directions (the radially horizontal, the radially vertical, and the axial direction of the rotor axes). Recommended alarm values for the monitored parameters are given in Table 1.

Measuring sites.
Recommended alarm levels – status assessment.

The values of alarm levels (primarily for noise limits, sound pressure, acoustic emission, and high frequency acceleration) are determined by the following ways:
by agreement between a supplier (manufacturer) and customers,
when the signal increase over 200% compared to the reference (agreed) level measured on the normal product quality and design,
by comparing the dynamic characteristics of competing manufacturers – suppliers, respectively by comparing the measured values with the normal level of the same products in the local market.
Total (summative) vibration values measured
The following tables (Tables 2–4) list the summative vibration values measured on the TG1 and TG2 machines for the current operating power at individual measuring sites 1–6 according to the measurement diagram. Table 2 also shows the evaluation of the measured node status, or the achieved levels of recommended limits – alarms. Since the TG1 and TG2 machines were measured under the same operating conditions, it is possible to compare the signal values for the measurement methods used.
Measured vibration values – low frequency methods up to 1 kHz.

Measured vibration values - high frequency methods Acc, EnvAcc.

Measured vibration values – high frequency methods, EnvAcc.

Low frequency methods up to 1 kHz
The vibration values measured on the TG1 machine are low at all measuring sites. The value of Velocity at measuring site 4 is slightly axially elevated (2.38 mm/s, frequency 2× of rotor – small pulley and generator speed, see FFT spectra, Chapter 2.2). Vibration values on the TG2 machine are comparable to those measured on the TG1 machine. In this case, too, the values of Velocity at measuring site 4 are slightly elevated – this time horizontally (see FFT spectra in Chapter 2.2.) –Table 2.
High frequency methods
During this measurement, elevated signal values were detected on the TG1 machine at site 3 (bearing housing of a small pulley) –Table 3. The nature of the signal shows the initial damage to the bearing (about a 100% elevation compared to the same site on TG2). All other measuring points show a low signal level, without signs of serious damage to contact surfaces.
The above limits – the alarm levels – are indicative. They are based on the recommendations of the standard, the SKF measuring instruments manufacturer and the experience of our workplace. Vibration limits Alarm1 – Warning and Alarm2 – Hazards were determined in that specific case for setting alarm levels on the basis of:
trends observed from measurements repeated over a long stretch of time under various operating states of rotary machines,
recommendations of the machine manufacturer.
The High Frequency Power (HFP) measurement method (Table 4) PtP did not show any mechanical damage to the turbine components. With this methodology, the values obtained can be used for high-frequency measurements of acceleration by the envelope method application.
The signal values on the TG2 machine are elevated above the recommended Alarm1 – warning limit at two measuring sites (Table 3):
■ Measuring site 1 – turbine bearing housing at the impeller, about 300%–400% elevation compared to TG1
• initial damage to bearing contact surfaces
• elevated operating temperature
■ Measuring site 5 – generator bearing at the coupling, about 100% elevation compared to TG1
• symptom of partial metal contact, incomplete oil film, seizing up.
High and very high frequencies correspond to the frequency range of rolling bearing malfunctions. In the case of bearings, the surface fatigue of the material results in the surface material’s crumbling out, abrasion with an increase in backlash, corrosion, formation of grooves, and depressions. Defects can be located on the basis of characteristic bearing frequencies determined from the bearing dimensions. There are four stages of bearing wear 4 :
initial stage – bearing wear with surface defects in the order of micrometers, the impacts during metal–metal contact with the bearing body cause acoustic propagation at frequencies up to several MHz.
second stage of damage – individual elements are damaged, but the vibration spectral components, corresponding to the low kinematic frequencies, are masked by the low-frequency spectral components. For this reason, bearings troubleshooting at this stage of damage is done in the frequency ultrasonic bandwidth of 20–60 kHz. Special accelerometers are used for the measurement, with a high value of the natural resonant frequency.
third stage of damage – classic accelerometers can be used now. When moving, the damaged element causes mechanical shocks in contact with another element, during which kinetic energy is transferred to the bearing bodies. Upon the shock, this body oscillates at its own frequency in the range of 5–20 kHz, while the oscillations are damped and fading quickly.
last stage – usually already critical bearing damage. Vibration spectral components can already be registered directly in the low frequency range. In addition, the speed of spectral components increases, too.
The following relations apply to kinematic (i.e. repeated) pulse frequencies, assuming a purely rolling motion:
Inner disk:

Outer disk:

Ball (roller):

Crate

Where:
BPFO, ball pass frequency outer race; BPFI, ball pass frequency inner race; BSF, ball spin frequency; FTF, fundamental train frequency; Nb, number of balls or rollers; Bd, ball or roller diameter; Pd, bearing pitch diameter; β, contact angle degrees
Table 5 contains an extract from the calculation of the basic expected frequencies of the machines on which the measurements were done. The model of the fundamental frequencies of individual machine nodes serves as a basis for the FFT spectra analysis.
Calculation of basic expected frequencies of measured nodes.

Measured FFT spectra and TIME logs
Figures 3 and 4 shows a comparison of jitter speed at measuring site 4H (small pulley at the generator coupling) for the monitored TG1 and TG2 turbine generators.

Jitter speed Velocity at TG1 8.3 Hz 0.75 mm/s (small generator pulley speed).
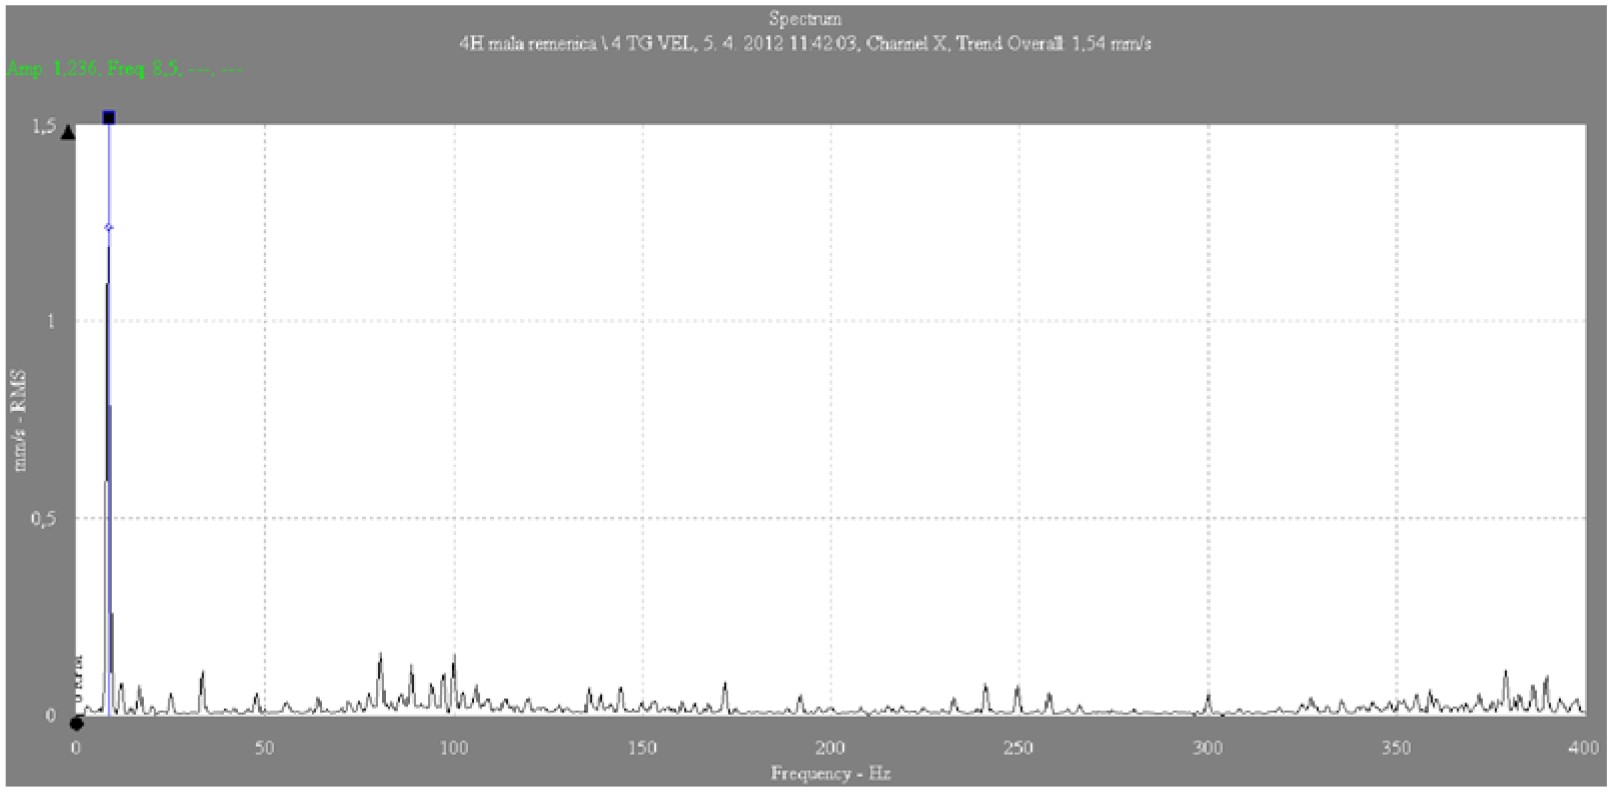
Jitter speed Velocity at TG2 8.3 Hz 1.24 mm/s (small generator pulley speed).
At the measuring site of 4H, no significant differences in the condition of the small pulley bearing at the generator clutch have been recorded. In the case of TG2 turbine generator, the more dominant amplitude is at the frequency of approximately 16 Hz.
Figures 5 and 6 show mutual comparisons of jitter speed at measuring site 4A (small pulley at generator coupling). At the monitored point, the total value of mechanical vibrations did not exceed the A1 alarm value – warning.

Jitter speed velocity at TG1 2 × 8.3Hz 1.66 mm/s (2× revolutions of the small generator pulley).
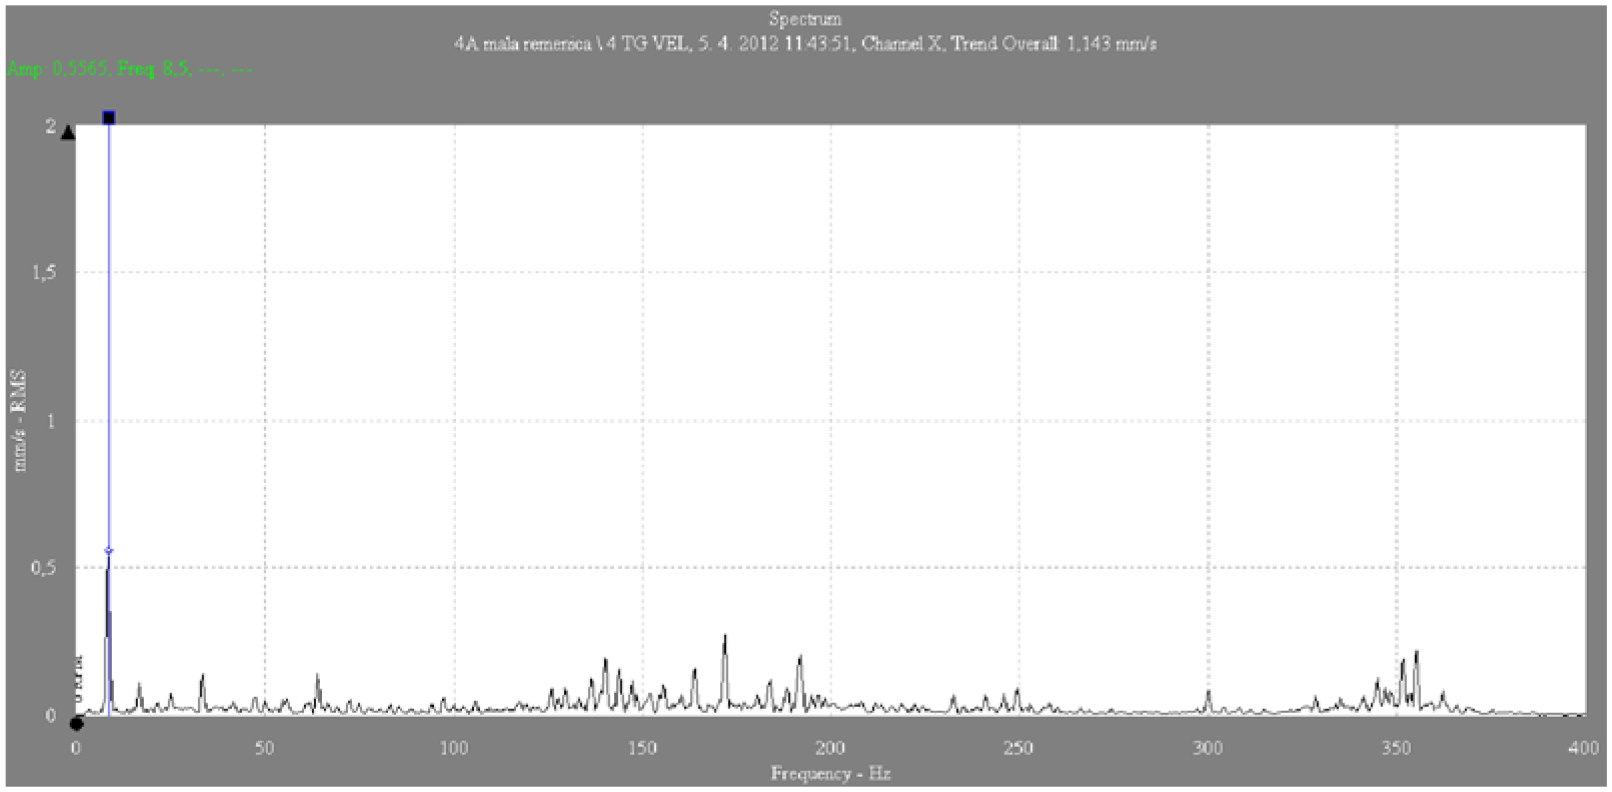
Jitter speed velocity at TG2 8.3 Hz 0.56 mm/s (1× revolution of small generator pulley).
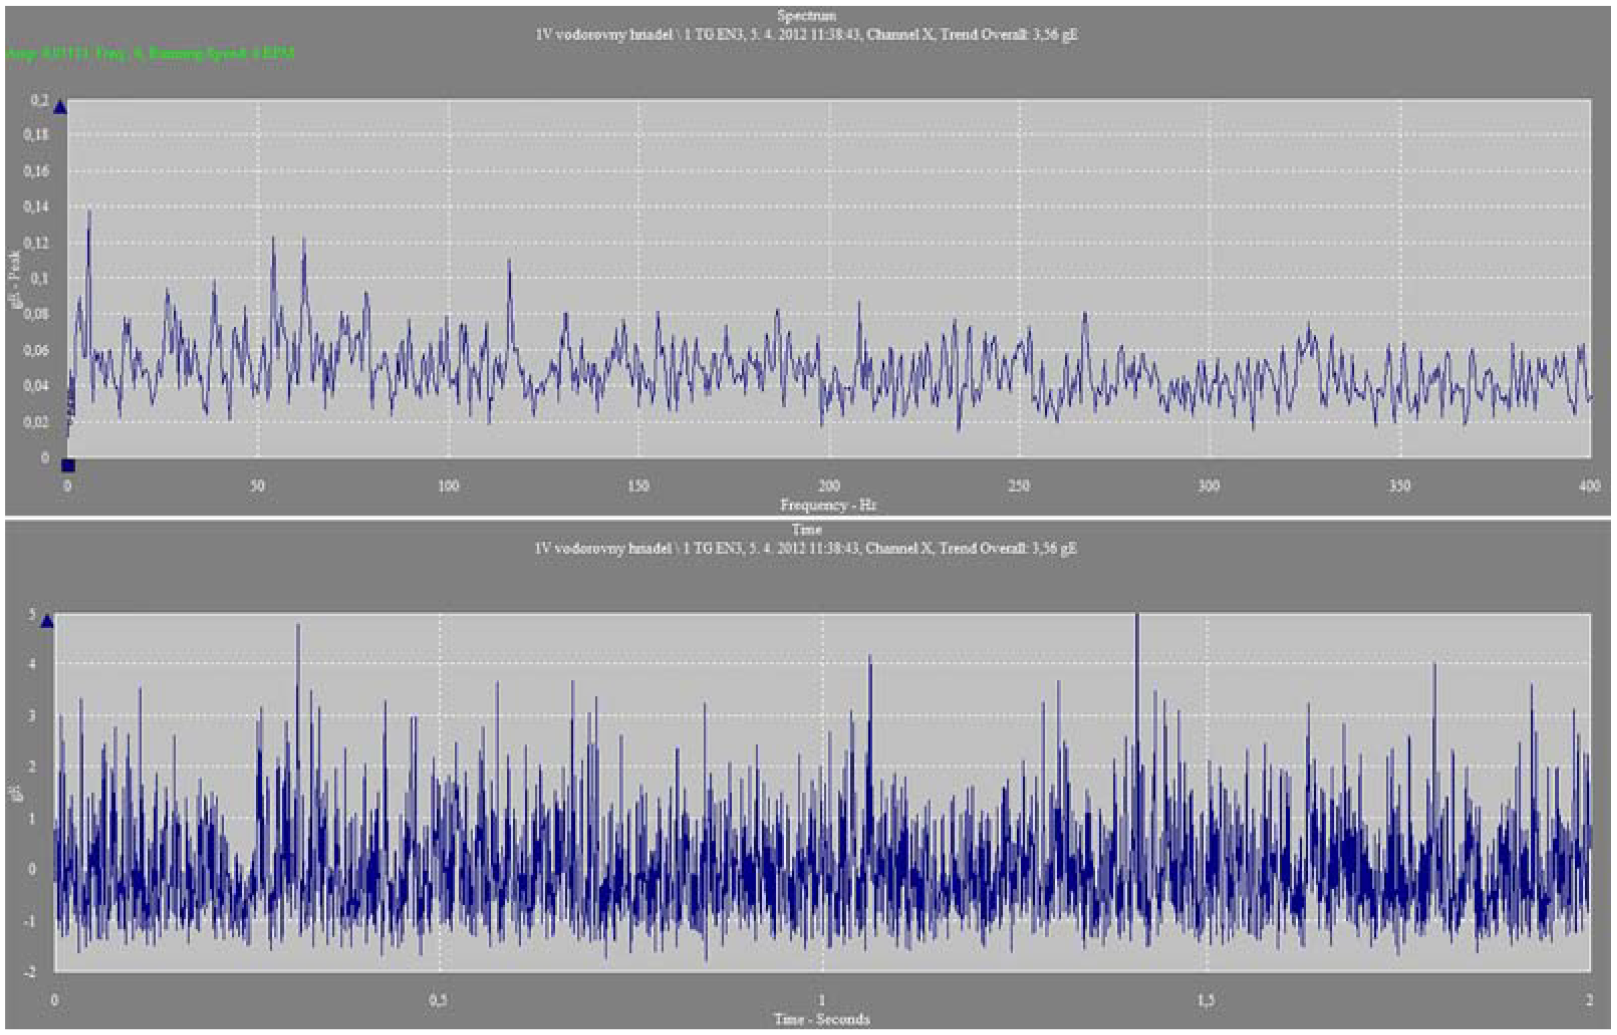
Figures 7 and 8 show the measured values of jitter acceleration (Acceleration – unit g, PtP detection) in TG1 and TG2 turbines.

Acceleration (g PtP) measuring site 1 V – bearing at the impeller of the TG1 turbine.

Acceleration (g PtP) measuring site 1 V – bearing at the impeller of the TG2 turbine.
Figure 7 shows low amplitude values, free from signs of bearing damage.
In the case of turbine TG2, it is possible to observe increased signal of about 2.5 kHz and increased amplitudes in the Time log – a 300% elevation compared to the TG1 device. This is a clear sign of initial bearing damage.
A comparison of the Enveloping Acceleration, gE unit, Peak detection measurements for the frequency range up to 1000 Hz, the FFT spectrum, and the Time log for both turbines is shown in Figures 9 and 10, respectively.

EnvAcceleration (gE Peak), measuring site 1 V – bearing at the impeller of the TG1 turbine.
EnvAcceleration (gE Peak), measuring site 1 V – bearing at the impeller of the TG2 turbine.
The logs confirm low amplitude values, free from signs of bearing damage at the 1 V measuring site of the TG1 turbine. In the case of turbine TG2, visible in the FFT spectrum and in the Time log are elevated amplitudes. An elevation of 300% compared to TG1 is observed. This is a clear sign of initial bearing damage.
The following is a comparison of logs from the measuring method Enveloping Acceleration up to 100 Hz (gE Peak), measuring site 5H (generator bearing at the coupling) –Figures 11 and 12.
EnvAcceleration up to 100 Hz (gE Peak), measuring site 5H– generator bearing at turbine coupling TG1.

EnvAcceleration up to 100 Hz (gE Peak), measuring site 5H– generator bearing at TG2 turbine coupling.
In the case of the TG1 turbine, low amplitude values are logged, free from signs of bearing damage. In contrast, at the site of turbine TG2 to which measuring was applied, the log shows elevated amplitudes in the FFT spectrum and in the Time log. This may indicate a symptom of partial metal contact due to an incomplete oil film.
When comparing the logs of the Acceleration (g PtP) measurement method at the measuring site 5H (generator bearing at the coupling) –Figures 13 and 14, low amplitudes, that is, a low signal summation value, are observable in the case of turbine TG1. In the case of turbine TG2, elevated signal was recorded in the frequency range of about 2.5 kHz.

Acceleration (g PtP) at measuring site 5H (generator bearing at coupling) of the turbine TG1.

Acceleration (g PtP) at measuring site 5H (generator bearing at the coupling) of the turbine TG2.
Discussion
Based on the measurements and subsequent analysis of the dynamic signal, it is possible to state the following:
In the case of low frequency vibrations:
1. In the measured mode of operation, the SHPP Gabčíkovo turbo generator marked TG1 shows
low signal values at all measuring sites,
measured values are below the recommended limit Alarm1 – warning,
the value at site 4 is elevated axially (bearing housing of a small pulley at the coupling, dominant frequency 2× speed 16.66 Hz).
2. In the measured operating mode, the TG2 turbo generator shows:
low signal values at all measuring sites,
measured values are below the recommended limit Alarm1 – warning,
the value is elevated at site 4 horizontally (bearing housing of a small pulley at the coupling, dominant frequency 1× speed 8.33 Hz).
In the logbook of high frequency vibrations:
Turbogenerator TG1:
elevated values, deterioration of the condition at the bearing at site 3 (small pulley bearing),
initial bearing damage,
all other measured bearings are free from signs of deterioration (damage) to the contact surfaces.
2. In the measured mode of operation, the TG2 machine shows:
damaged bearing symptom at site 1 (probably radial bearing 23036, at the impeller), the measured value exceeded the recommended limit Alarm1 – warning,
symptom of partial metal contact or incomplete oil film on the bearing generator at the coupling, measuring site 5.
Once warned of the emerging malfunction, necessary maintenance activities, as well as the actual shutdown of the equipment for the performance of work on a suitable date, can be planned in advance. The analysis of the vibration logs on the monitored devices led to the proposal of measures related to the operation of turbo generators for our partner as follows:
Turbo generator TG1:
unrestricted operation
trend-capturing, repeated measurements, monitor mainly the condition of bearing no. 3
measuring interval approximately 1000 operating hours.
Turbo generator TG2:
plan the repair consisting of bearings replacement at measuring site no. 1
trend-capturing, repeated measurements, monitor mainly the condition of bearings number 1 and 5
do analysis of lubricating oil from bearing housing number 1 (oil sample 200 ml, determine the content of abrasive particles of Fe, ferrography, assess the thermal oxidative degradation of oil, assess loss and consumption of additives – analysis of residual concentration of lubricating oil additives)
We also recommend the operator perform the alignment check on the coupling (generator – small pulley). The recommended alignment of shafts in both the horizontal and vertical directions is:
parallel 0.13 mm
angular 0.10 mm/100 mm.
The unfavorable operating condition of the bearing at the measuring site 1 in the case of the TG2 turbine generator was subsequently verified in the acoustic emission and ultrasound analysis using the Microlog GX measuring device (wav recorder).
Sound recordings were made at the critical measuring site (point 1 – bearing mounting of the turbine shaft at the impeller) and an analysis was carried out on their basis. The measurement method used was VEL (yaw rate), ACC (yaw acceleration), EnvAcc (second envelope – 50 Hz to 1 kHz), and EnvAcc (third envelope – 500 Hz to 10 kHz).
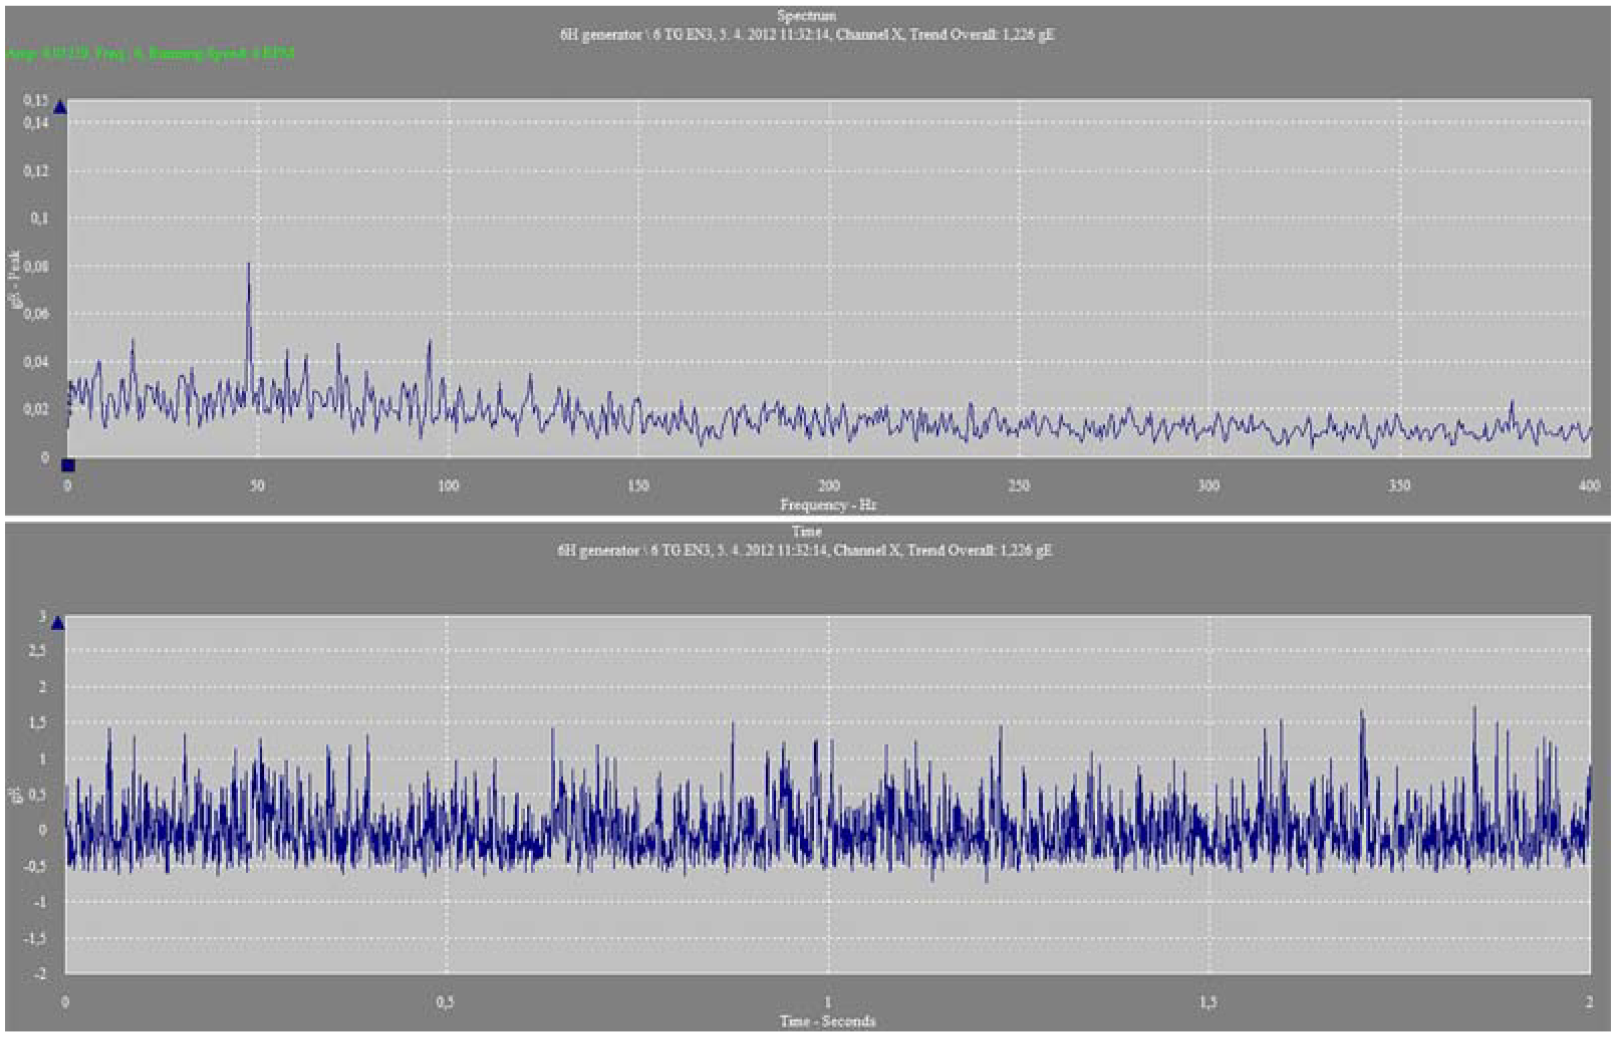
From the above-mentioned waveforms and spectra (Figures 15 and 16) it is possible to confirm signs of bearing damage on TG2. We find the frequency of rolling bodies (62 Hz – the second multiple) and the frequency of the cage (2.7 Hz) in spectra of the third envelope.

Time record of the third acceleration envelope (EnvAcc3) in point 1 (TG2).

FFT third acceleration envelope (EnvAcc3) in point 1 (TG2).
The checkup measurements confirmed the need for increased attention of the operator to the monitored TG2 turbine generator, namely its bearing at the measuring site 1, which shows the signs of damage.
As part of predictive maintenance of turbo generators at SHPP Gabčíkovo, we propose to deploy a permanent vibrodiagnostic system that would identify any increase in vibration in real time, while its subsequent analysis would identify the reason for such increase and the type of failure that can be expected. A fault in the machine does not manifest itself immediately. Important, however, is to identify the symptoms of possible failures that can be decrypted by recording trends and then take appropriate and effective measures to eliminate the failure that has occurred.
Conclusion
The primary task of applied research was to integrate predictive maintenance tools into the existing processes and to define actions to be taken if the proposed model identifies a probable failure on the monitored equipment.
MVE S7 is a part of the hydropower plant of the Gabčíkovo waterworks, which consists of the Gabčíkovo hydropower plant with a nominal capacity of 720.0 MW, the Čuňovo hydropower plant (24.0 MW), the Mošoň small hydropower plant (1.26 MW), and the S7 small hydropower plant (1.04 MW). Our workplace was approached by a partner, the company Slovenské elektrárne (SE – Slovak Power Plants), to assess the real operating condition of two turbine generators in a small hydropower plant S7. Since beginning of their hydropower plants management, the SE and Vodohospodárska výstavba (VV – Water Engineering) have applied a unified maintenance strategy and approach. In 2007, based on the best practice of Enel, optimization of plant maintenance was adopted. During this period, a 3-year maintenance cycle was introduced. All scheduled maintenance activities were routinely communicated between the SE and VV. Recently, SE has decided to reassess the maintenance system applied so far in order to ensure the sustainability of the plants’ performance, minimize forced shutdowns, and lower operational unavailability in the future. In terms of their life and operating hours, the condition of individual devices is satisfactory. However, through our measurements, we have identified possible issues with the operational condition of the bearings, which could pose a risk to the sustainability of the optimal operating condition of the MVE S7 Gabčíkovo turbine generators in the future.
Vibrodiagnostic measurements are used for monitoring the condition of bearings, lubrication and detection of dynamic states of rotating devices, and machinery. The primary goal of monitoring vibrations of rotating devices is to provide information on the operational and technical condition of the equipment in order to ensure strategic planning and maintenance management. The evaluation of the condition and the course of vibrations during the current operation thus becomes an inseparable part of this process.11,12
Through the conclusions drawn from the analysis of signals obtained through vibrodiagnostics, a predictive maintenance system was designed based on the current state of maintenance in the partner company SHPP Gabčíkovo S7, supplemented by vibrodiagnostic and tribotechnic tools for monitoring dynamic stress of rotary machines related to the condition of bearings, gearboxes, stability, imbalances, misalignments, cracks in important components, wear, etc.
We recommend that our partners carry out measurements at regular intervals, where warnings of an impending malfunction are signaled through elevated vibration values logged at defined measuring sites. Consequently, it is possible to react operatively, prevent an unexpected serious malfunction and save a considerable part of the repair costs and thus prevent damage caused by an unexpected equipment failure.
In connection with the above, among other things, the concept of a permanent monitoring vibrodiagnostic system was designed, enabling real-time identification of the increase in vibration, and subsequent analysis of the data obtained to identify possible failures of the design segments of rotating machines. The conducted industrial research confirmed the validity of the claim that an optimally setup vibrodiagnostic system is a very useful maintenance tool, allowing for a reduction in failure rate of the machinery to which it is applied, thus cutting the costs of their maintenance and repair, increasing the reliability of production plants, and minimizing the amount of downtime in production plants. We can state that the best results in assessing the current technical condition of the device are achievable only through regular measurements, because in addition to immediate data, historic values are available too. These can be compared with the current data and thus create a trend of failure development. Measurements should be taken at regular intervals and, in the event the recording shows an increase in the monitored values, subsequent measures need to be taken to eliminate a failure under development.
Footnotes
Handling Editor: Chenhui Liang
Declaration of conflicting interests
The author(s) declared no potential conflicts of interest with respect to the research, authorship, and/or publication of this article.
Funding
The author(s) disclosed receipt of the following financial support for the research, authorship, and/or publication of this article: The authors thank the Ministry of Education of Slovak Republic for supporting this research by the grant VEGA 1/0051/20 (research in field of reverse engineering deployment into diagnostics of hard to reach places).