
Abstract
Determining the buoyancy-chimney effects (hot smoke stack effects) in the case of a fire in a traffic tunnel with a slope is of key importance in the process of sizing the ventilation system and smoke control. Given the complexity of the unsteady turbulent heated flow of air and combustion products mixture and the transient heat transfer by convection, radiation and tunnel wall conduction, various approximate methods, standards, guidelines, and numerical approaches are used, giving different values for the gas temperature distribution and pressure differences. Depending on the fire heat release rate, tunnel slope, and the length of the fire-affected zone, the differences in pressure can even reach values of over 100%, strongly affecting the ventilation sizing. To evaluate the reliability of available methods, a critical review of various methods is given, and a comparison analysis carried out in the case of a typical unidirectional-traffic tunnel equipped with a longitudinal ventilation system. The temperature field, the pressure rise, and the required number of fan units, required to provide the critical velocity for smoke control, are analyzed.
Keywords
Introduction
A great number of authors have investigated fires in the traffic tunnels theoretically and experimentally. All aspects of tunnels fires like: critical velocity for smoke control, smoke backlayering, influence of ventilation on fire spread, influence of ventilation on maximum heat release-rate (HRR) and fire growth rate, influence of tunnel size on heat release rate, flame length, and maximum gas temperature have been studied. A survey of theoretical and experimental work of this research can be found in Ingason 1 and of numerical approaches in Barbato et al. 2 An experimental and theoretical analysis of the critical velocity to control the smoke and backlayering length is given by Zhen et al., 3 Atkinson and Wu, 4 Wu and Bakar, 5 and Oka and Atkinson. 6 It can be seen from the presented references that the critical velocity, one of the most important parameters defining the safety of the passengers in a case of tunnel fire, was studied in details. The results show a variety of equations that slightly differ from each other. In other words, there is a great agreement about its value that primarily depends on heat release rate and tunnel cross-section size (Dh).
In order to reach a desired value of critical velocity, the ventilation system has to overcome various resistances like: portal pressure drops, meteorological influences, buoyancy-chimney effect, fire resistance, air friction to tunnel’s wall, and vehicle resistances. There is a great agreement about the method how to calculate all of these resistances except the buoyancy-chimney effect. This effect is dominant in case of a fire in long sloped traffic tunnels. The number of fans needed to reach critical velocity in the case of longitudinal ventilation can vary up to 50% depending of the applied methodology to determine the buoyancy effect. Oversizing the ventilation system increases not only the investment, the required power sizing, but also the maintenance costs. On the other hand, the undersizing of the system could bring the passengers in a great danger in case of a tunnel fire.
Using available literature sources, we made a critical survey of the most important approaches, methodologies, and guidelines that have been used in various countries in order to define the temperature distribution along the tunnel axis and the buoyancy-chimney effects. Special attention is given to the most relevant recommendations and guidelines like: CETU 7 ; PIARC 8 ; RVS-2008 9 ; RVS-2014 10 ; and ASTRA 11 which serve as powerful tools in order to solve practical engineering problems. A convenient software package, CAMATT, 12 that serves for the same purpose is also analyzed in short and used in this study to compute a numerical solution, as well as a CFD-software-based numerical results developed by Sturm et al. 13 which are a base for the RVS-2014 10 guidelines. To assess the reliability of these methods, they are critically compared for a typical longitudinally ventilated unidirectional-traffic tunnel fire case.
One-dimensional, quasi-steady temperature distribution
Physical background
The buoyancy-chimney pressure difference primarily depends on gas temperature distribution along the tunnel. The flow field of the heated mixture of air and combustion products during a fire in a traffic tunnel is three-dimensional and unsteady. This means, that in order to determine the buoyancy effects for a given case, it is necessary to use a sophisticated numerical software supported by experimental data. This approach is inconvenient for the solution of practical engineering problems in ventilation design. By introducing a number of assumptions and neglecting the inertial terms, the three-dimensional unsteady flow field can be reduced to one-dimensional, quasi-steady problem which defines the gas mixture temperature, averaged over the tunnel cross-section, denoted further as Tavg, as a function of the distance x from the fire onset at a given instant in time tn. This kind of approach, suitable for obtaining approximate solutions to practical problems, is known as an approximate, quasi-steady model of heated gas mixture flow along a tunnel axis, or one-dimensional model. Except in the near-fire region with strong stratification, this approach describes the physics of the flow with sufficient accuracy. Otherwise, the problem can be solved only numerically using relatively complex three-dimensional numerical algorithms.
The energy equation for one-dimensional flow with quasi-steady heat transfer occurring by convection and radiation from a heated gas mixture toward a tunnel wall, for flow averaged over a tunnel cross-section, is defined, among the others, by: Ingason, 14 CETU, 7 Newman and Tewarson, 15 and CAMATT 12 in the following form:

where

is the heat flux transferred by convection, and

is the heat flux transferred by radiation. The value of the coefficient of emission for radiative heat transfer from the gas mixture to the wall is commonly taken as ε ≈ 0.8 and view factor for radiative heat transfer F ≈ 1.
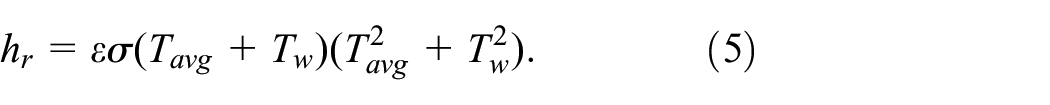
The heat exchanged by radiation can be expressed by means of an equivalent radiative heat transfer coefficient, analogous to convection, denoted by hr:

From equations (3) and (4) it follows:
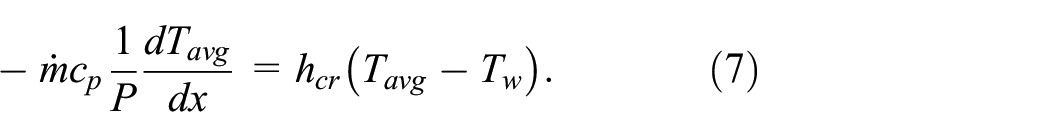
By introducing the overall heat transfer coefficient hcr (takes into account both convection and radiation)

Equation (1) reduces to the following form:
Equation (7) can be solved only numerically, since the overall heat transfer coefficient

where
The mean temperature at the fire location (at x = 0), at a time instant tn, can be determined from the following expression (Ingason, 14 CETU, 7 PIARC 8 ):

This expression is obtained under the assumption that one-third of the fire heat release rate

A simplified version of this expression for the longitudinally ventilated tunnels is also given in Li et al. 16
The pressure change due to air heating along a distance L in the tunnel (chimney effect) at the time instant tn, can be calculated using the following relationship:

in which s is the tunnel slope in %.
By substituting equation (10) for Tavg(x) in the equation above, after integration, we obtain:

To determine the temperature field and the pressure rise using equations (10) and (12) it is necessary to know the mean value of the overall heat transfer coefficient hcr,m at a given instant of time tn.
Another approach to derive the equations (10) and (12) is to assume that the rock mass temperature of the tunnel wall is equal to the cold air temperature
A survey of the heat transfer coefficients values
Of particular importance are the values of the overall heat transfer coefficients hcr,m and hcrc,m for the period within 10–20 min after the onset of fire. This is the time window when firefighters are most likely to be involved, and thus, is relevant for ventilation system sizing.
The values of hcr,m coefficient, given by Ingason, 14 are within a somewhat wide range, h cr,m = 20–40 W/m2 K. As a result of an experimental analysis on a model tunnel test an estimate of heat transfer coefficient of hcrc,m = 20 W/m2 K, as best overall fit for all tests, is given by Ingason and Li. 17 Ingason et al. 18 and Loennermark and Ingason 19 proposed a value of 25 W/m2 K for overall heat transfer coefficient hcrc,m as a best-fit value for Runehamar tunnel fire tests. The same value is used by Shengzhong et al. 20 Using a set of experimental tests by Liu et al. 21 and Roh et al., 22 Li et al. 16 determined a value of Stanton number St = 0.00685 which results in h crc,m = 25 W/m2 K for the air speed of 3 m/s.
Based on the presented experimental results, the mean value of the overall heat transfer coefficient hcrc,m should be in the range h crc,m = 20–25 W/m2 K. It is usually given at 15–20 min from the onset of fire. However, many references do not address this information. For the Runehamar tunnel (large-scale) fire tests, reported by Ingason, 14 and Loennermark and Ingason, 19 the reported data are located at approximately 15–20 min from the fire onset. Time coordinate information is a logical expectation since this coefficient is a function of time. As it stated in previous section, by its use at a given time instant, a transient problem is transformed into a quasi-steady one. It is worth noting that the value of this coefficient will be the highest at the initial time instants since the tunnel walls are still cold and the radiative heat transfer is at its highest. With the passing of time, heating of the walls occurs and the radiative heat transfer is reduced, which will have the effect of reducing the value of this coefficient.
The convective part hc of the overall heat transfer coefficient hcr,m or hcrc,m is studied in details for the flows through pipes and ducts. The appropriate results can be found in classical literature like Incropera et al., 23 Cengel and Ghajar, 24 and many others. A comprehensive review can be also found in Kays and Crowford. 25
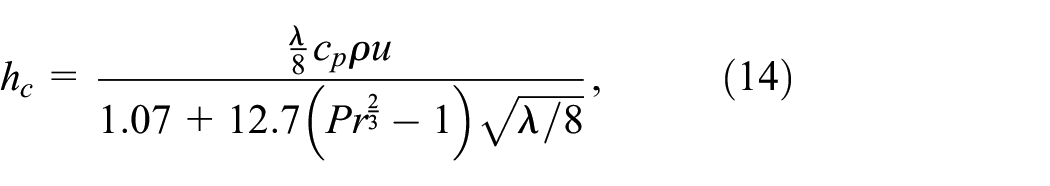
The following formula, based on the relation of Nusselt, Prandtl, and Reynolds number, is used for the smooth tunnel walls,

The error of this formula is estimated up to 25%. This error can be reduced considerably to less than 10% by using more complex but accurate relations such as Petukhov equation,
valid for smooth as well as for rough pipes with friction coefficient λ. Based on results of real scale tunnel measurements and calculations, where an effective value of friction coefficient is determined, Jang et al., 26 Levoni et al. 27 and Vigne et al., 28 typical values of effective Moody friction factor for cast concrete tunnels are in the range λ ≈ 0.0235–0.026. Taking into account the influence of the various equipment mounted on the tunnel walls and various wall roughness this value can go up to 0.03 or even more.
Although the fluid properties depend on temperature, it turns out that the convective part of heat transfer coefficient defined by expression (13) and expression (14) are almost independent of temperature. This means that the local and mean values are practically the same hc ≈ hc,m.
For the air properties at T
a
= 288 K; Pr = 0.71, k = 0.0253 W/m K, ρ = 1.185 kg/m3, cp = 1.006 kJ/kg K and ν = 14.8 × 10⁻⁶ m2/s, and a typical value of tunnel hydraulic diameter
It is particularly surprising that equation (13), and similar correlations in Kays and Crowford 25 and Newman, 15 valid for convection in smooth tubes, have been used in model and real-scale object-tunnel fire analysis: Newman, 15 Loennermark and Ingason, 19 Du et al., 29 Shi et al., 30 and others. The Petukhov equation (15) is used by several relevant approaches and numerical solutions: CETU, 7 PIARC, 8 and CAMATT 12 numerical solution, by utilizing proper value of Moody friction coefficient λ.
In order to get the overall heat transfer coefficient hcr,m, one should add to these values the mean value of the coefficient of radiative heat transfer hr,m. This coefficient depends on the temperature of both the wall and the gas. A good estimate of the mean value of this coefficient can be made by starting from the temperature distribution due to the convection only, as explained in section “Solution according to PIARC guidelines”. A value of approximately 7 W/m2 K is obtained for the tunnel longer than 1000 m. Assuming the Petukhov equation (14) as the most accurate, the sum of the mean convective and radiative heat transfer coefficients should be in the range h cr,m = 19–22 W/m2 K. This should be further reduced due to the heat transfer resistance through the tunnel walls toward rock massive. Having this in mind, the true value of the heat transfer coefficient hcrc,m should be close or below 20 W/m2 K.
One other way to estimate the heat transfer coefficient hcrc,m or hcr,m is by comparing the approximate and exact numerical solutions, which is further discussed in section 4 “Numerical procedures to determine the overall heat transfer coefficients, the gas average and wall temperature distributions”.
The guidelines and recommendations
Many European countries have their own guidelines and recommendations that are obligatory for the tunnel ventilation designers. Among the best known are: French CETU, 7 Austrian RVS-2008, 9 and RVS-2014, 10 German RABT, 31 and Swiss ASTRA. 11 A general set of recommendation is also given by PIARC. 8
The recommendation of the French center for the study of tunnels – CETU
One-dimensional quasi-steady problem of temperature distribution is also presented in the French study by the Center for the Study of Tunnels, CETU. 7 The starting point is the heat transfer equation, which is identical to equation (1) and an equivalent coefficient of heat transfer between the gas and the far-away tunnel lining/rock mass at temperature T∞, introduced in the form:

based on which the temperature distribution and the pressure difference due to the chimney effect along the tunnel axis is obtained at a given moment of time tn,


T∞ is the temperature of tunnel lining mass, at a distance sufficiently far from the surface of the tunnel wall. As in the previous case, the effect of the combustion products on the physical properties of the mixture with air is neglected.
The key difference between this solution and the solution by Ingason 14 is that, instead of expressing the heat transfer between the heated gas and the tunnel wall surface, here the approach is to treat the heat transfer from the heated gas toward the tunnel rock mass, whose temperature is the undisturbed rock temperature T∞. Having this in mind, instead of the mean value of the overall heat transfer coefficient between the gas and the wall surface, hcr,m, here we have the mean value of the overall heat transfer coefficient between the gas and the rock mass hcrc,m , which thus takes into account the transient heat conduction resistance through the tunnel lining. Values recommended by CETU 7 for concrete tunnel walls are given in Table 1 as a function of time and air velocity.
The mean values of the coefficient of heat transfer hcrc,m (W/m2 K) as a function of time, for different values of cold airflow velocities, recommended by CETU. 7

There are considerable differences in the given mean values for the overall heat transfer coefficient hcrc,m and the values reported in literature sources given in section “A survey of the heat transfer coefficients values”. The maximum value of the coefficient of heat transfer hcrc,m given in Table 1, of 10 W/m2 K for u = 3 m/s, is twice as low as the minimum value of the coefficient hcrc,m of 20 W/m2 K, according to Ingason and Li. 17
To obtain the temperature field based on equation (16) it is necessary to introduce an assumption about the temperature of the rock mass T∞. No guidelines are given in this regard. If we start from a common-sense assumption that T∞ ≈ Ta, the solution by CETU is practically reduced to the solution by Ingason equation (8). Unfortunately, due to the great differences in hcrc,m the results of pressure difference due to the chimney effect, Δpch, obtained by these two approaches can differ over 100%, depending on the tunnel length.
Solution according to PIARC guidelines
The equation for heat transfer, given in the PIARC 8 guidelines, has the following form,
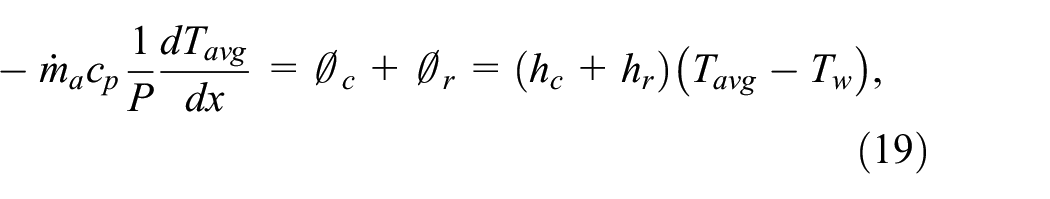
which follows from the equations (1), (2) and (4). The coefficient of convection for convective heat transfer from the heated gas to the tunnel wall can be determined using Petukhov formula (14). This coefficient is practically considered independent of air temperature and thus is a constant along the tunnel. For the typical input data, given in section “A survey of the heat transfer coefficients values”, its value is in the range h c = 12–15 W/m2 K. As before in section “Physical background”, the coefficients of radiation are defined in an analogous way, by equation (5).
The PIARC guidelines recommend an iterative procedure for the solution of equation (19) by starting from the assumption that T w = Ta. The procedure itself is not presented in details. One possible iterative approach is to determine the convection coefficient from Petukhov formula (14) and neglect the radiative loss in the first iteration step. By doing so, at a given time instant tn, one obtains the first iteration for temperature values from equation (19) in the form:

In the following step, by using the available temperatures from the first iteration, we can determine the mean value of the radiative heat transfer coefficient in the first iteration hr,1, for T w = Ta, using the equation:

In the following step, we obtain the second iteration of temperature:
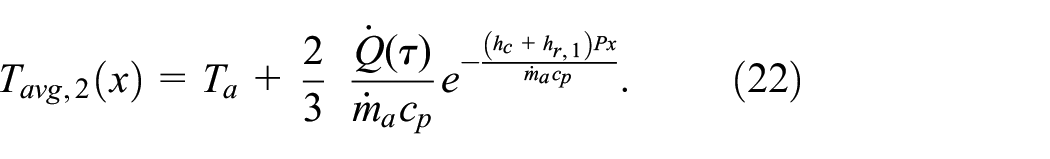
The integrals in equation (21) can be determined by numerical integration using the temperature distribution given by equation (20), assuming a sufficiently small step

The important property of this approach is that one does not need to assume the mean value of the coefficient of radiation, since it is calculated within an iterative procedure. However, the assumption about a constant tunnel wall surface temperature equal to the cold air temperature, T w ≈T a , remains. The consequence of this assumption is that we will have an overestimated value of radiative heat transfer, or an underestimated value of the mean gas temperature and the resulting stack pressure change along the tunnel.
Austrian RVS-2008 and Swiss ASTRA guidelines
These two guidelines (RVS-2008, 9 ASTRA 11 ) are similar with regard to calculation of the pressure difference due to the chimney effect. It is carried out using the following formula:

where: ΔTb (K), ρb (kg/m3) and Lb (m) are the referent values for the temperature increase due to the fire occurrence, the density, and the tunnel length to which the referent temperature rise is related; whereas ηb is the corrective coefficient that takes into account the nonuniform temperature distribution over the tunnel cross-section. Sb is the tunnel slope expressed as a percentage. The referent values of ΔTb, Lb and the correction coefficient ηb, according to these guidelines, for the given type of ventilation system, depend only on the fire heat release rate and are given in Table 2.

Characteristic values of the fire affected zone length and the coefficient of the convected part of the fire heat release rate (RVS-2014 10 ).

The effect of the fire-affected length of the tunnel on these values is not presented in RVS-2008 9 guidelines. One should expect that, due to heat transfer, the heated gas will cool down after a length Lk that should be approximately equal to the referent length Lb, so further extension of the fire-affected zone should not have any effect on the referent values. However, for lengths lower than Lk or Lb this can have a significant influence. The same conclusion can be reached by comparing the Austrian RVS-2008 9 guidelines and the Swiss ASTRA-2008 11 guidelines, which are similar when it comes to determination of the chimney effect. According to the ASTRA-2008 11 guidelines, the chimney effect is determined using equation (24) and the corresponding referent data only for fire-zone lengths greater than or equal to the referent length. For lengths lower than the referent, an appropriate percentage of the value corresponding to the referent length should be taken. Thus, for example, the chimney effect corresponding to a fire-affected length of 400 m is approximately 75% of the value that corresponds to the referent length of 800 m.
No guidelines are given for the calculation of the reduction in fan thrust due to the increased temperature of the flowing gas mixture. Having this in mind, this approach, though simple, can lead to errors in the sizing of the required number of fans, which will depend mostly on the length of the fire-affected zone and on how it compares to the referent length value.
Austrian RVS-2014 guidelines
The temperature field and the pressure change according to RVS-2014 10 are to be determined using analogous expressions as equations (8) and (12).


The advantage of this approach in comparison to the previous RVS-2008 9 is the known temperature distribution from the position of the fire to the exit of the tunnel. This enables the calculation of the buoyancy (chimney) effect on pressure change regardless of the tunnel length as well as the influence of the temperature increase to the loss of the jet fans efficiency. The recommended values for the portion of the fire’s heat release rate that is convected along the tunnel, ηfire, differ from the previously presented ones, as well as the heat transfer coefficient hcrc,m . The data for ηfire and Lfire are given in Table 3:
The heat transfer coefficients are defined by the following expressions:
− for a rectangular-shaped tunnel cross-section,

− for a horseshoe-shaped tunnel cross-section,

Unlike CETU’s 7 approach, the dependence of these coefficients on time is not given but they are based on the best fit of the three-dimensional numerical simulations to one-dimensional approach, at a time value of 20 min. After this time there is no significant change in the heat transfer coefficient as given in Sturm at al. 13 The support of these results by experiments is not presented and the great difference in the value of the calculated buoyancy effect compared to the previous version of RVS-2008 9 is not underlined and discussed.
Since the heat transfer coefficient for the case of a horseshoe cross-section at a velocity value of 3 m/s (h crc,m = 9.55 W/m2 K) is somewhat lower than the value recommended by CETU, 7 given in Table 1 (10 W/m2 K), and the share of the heat convected along the tunnel is higher for fire heat release rates of 30 MW or more (η fire = 0.75 instead of 2/3 in the previous cases), one can expect higher temperature values and resulting pressure changes compared to the values given in the CETU, 7 guidelines, and in particular, compared to the solution by Ingason 14 and the PIARC 8 guidelines.
Numerical procedures to determine the overall heat transfer coefficients, the gas average, and wall temperature distributions
As discussed in section “A survey of the heat transfer coefficients values”, a way to estimate the overall heat transfer coefficient hcr,m or hcrc,m is by comparing the approximate one-dimensional quasi-steady approach and the numerical solutions. Different numerical approaches can be found in the literature: one-dimensional (1D numerical), a three-dimensional (CFD), and a multiscale approach – where the first two are merged, with the highly stratified zone being computed as 3D and the remaining part of the tunnel (most of the tunnel length) as one-dimensional numerical solution.
A 1D numerical approach based on equation (7) is given in CAMATT.
12
It takes into account the variations of heat convection and radiation coefficients hc and hr, the tunnel wall temperature Tw, flow rate and the properties of the gas mixture
Sturm et al. 13 utilized three-dimensional numerical solution (a CFD solver) of the flow and temperature development and obtain the heat transfer coefficients of interest for a fire scenario.
The multiscale approach, as presented in Colella, 32 merge 1D and 3D dimensional approaches. It is aimed to reduce the computational efforts in computing the whole fire scenario as a 3D CFD problem.
In either case, an appropriate value of the heat transfer coefficients of interest here can be obtained from the best fit of the one-dimensional approximate method and the results of the numerical method at a given instant of time t. The most important used approaches are discussed below.
Numerical solution by the French center for the study of tunnels – CAMATT procedure
The French Center for the Study of Tunnels (CETU) has developed the software package CAMATT 12 for the numerical solution of one-dimensional differential equations governing model of flow and temperature fields in traffic tunnels during a fire scenario in both fluid and tunnel wall domains, as well as for analysis of pollution levels by vehicle-emitted pollutants in conditions of normal traffic load, and in congested traffic situations.
A transient distribution of tunnel’s cross-section flow-averaged: density, temperature, and velocity in the main (tunnel axis) direction, are numerically computed by solving 1D continuity, momentum, and energy differential equations of flow. The transient temperature distribution of the tunnel wall is computed by numerical solution of the transient Fourier heat conduction equation. Given the dominant wall-normal temperature gradients, the transient wall temperature solution is considered as dependent on wall normal coordinate and time only. Solution is carried out at numerical locations along the tunnel spanning the considered tunnel length. Details of the governing numerical model can be found in CAMATT. 12 The details of the specialized finite-volume discretization and numerical solution procedures for the governing 1D models can be found in Colella, 33 Ferziger and Perić. 34
This software has the primary purpose of aiding the sizing of the ventilation systems design in tunnels. Unlike the previously presented simplified methods in section “The guidelines and recommendations”, no assumption is introduced here, which would compromise, by a significant margin, the accuracy of the obtained results. All parameters that affect the development of temperature and flow field like: the dependence of the heat release rate on time, tunnel geometry, atmospheric condition, fun thrust deficiency due to the elevated temperature, fire detection time, traffic load, and others are taken into account.
The heat convection coefficient in this numerical solution is calculated using Petukhov equation (15) and the user-inputted Moody friction coefficient λ, whereas the heat radiation by means of an equivalent heat transfer coefficient (5). The change in fluid properties due to the emission of fire pollutant gases is also taken into account. All the characteristic results (flow velocity, gas temperature, tunnel wall temperature, fan impulse reduction, etc.) are obtained as a function of time measured from the onset of the fire and the distance from the fire location.
Numerical solution by Sturm et al
A three-dimensional numerical simulation approach (CFD) is used in Sturm et al. 13 to solve the fire scenario problem and deduce the heat transfer coefficients (specifically, its equivalent-mean value after 20 min of the physical time, which gives a best fit for the simplified solution of gas average temperature distribution Tavg(x)).
Two typical cases of tunnel cross-section shapes (horse shoe and rectangular), each for two values of the cross section area: 53 and 70 m2, and each using a HRR peak value of 30 and 50 MW, with a linear increase from 0 to maximum heat release rate within 5 min, followed by a constant heat release rate for 15 min, are considered. The road gradient in all cases was 1.5%. A well documented CFD-solver Fluent was used to compute the unsteady numerical cases. Conjugated heat transfer between the gas and the tunnel concrete walls including transient heat conduction in the wall, considered as three-dimensional, was included. However, gas-to-wall heat transfer was considered only as convection, with the fraction of the local loss at fire site by radiative transfer taken as a constant 25%. Cases were set up using three different values of the air velocity approaching the fire site which are held constant during the simulation. In the horseshoe profile of 53 m2 size, and 50 MW peak HRR cases, the velocities were: 1.5, 2.26, and 2.8 m/s (Austrian RVS guidelines were consulted to estimate the velocities of interest). The results are then collapsed by curve fitting to a one-dimensional solution for Tavg(x), thus computing the best-fit value of a (time-equivalent and longitudinal-mean) value of heat-transfer coefficient between the gas at average temperature Tavg(x) at a cross section and the constant rock massive at temperature T∞. The 3D transient numerical solution allowed to obtain these values as a function of both air velocity and time. The resulting formulas were given in section “Austrian RVS-2014 guidelines”, that is equations (27) and (28).
As no attention was given in this study to the radiative component of the heat transfer from the gas to the tunnel wall, this caused the difference in the overall heat transfer coefficient values reported here, and the previously introduced hcrc,m heat transfer coefficients.
Numerical solutions by the multiscale approach
A multiscale approach was used by Colella et al.32,33,35 to solve flow and fire scenario in a tunnel. A 1D-model is presented which is used to model tunnel flow and fire scenario in the 1D portion of the domain, and is integrated with a 3D segment where a CFD-solver (Fluent) is used to compute the flow and temperature fields in the fluid domain only. However, with respect to the numerical procedure used in CAMATT, 12 Colella’s approach 32 treats the heat transfer from the gas to the wall using a steady-state like approximation for heat transmission losses to a constant-temperature wall-layer, via an overall heat transfer coefficient. The value of the coefficient is obtained by summing up the convection resistance and the standard steady-state heat conduction resistance for the concrete tunnel wall, apriori prescribing the relevant thickness for conduction resistance. This approach is computationally advantageous, but since no particular attention was given to the buoyancy-chimney effects in any of the published results, and to the radiative heat transfer, these results are not further discussed here.
Comparative analysis
The temperature distribution along the tunnel is determined for various values of the heat transfer coefficient, by assuming that the wall temperature Tw or undisturbed rock temperature T∞ is equal to the temperature of the cold air Ta. For the solution of Ingason, 14 expression (10), a value of hcr,m = 20 W/m2 K is taken. This value corresponds to the value of 20 as proposed by Ingason and Li. 17 Also given is the result for CETU, 7 expression (16), with a value of hcrc,m = 10 W/m2 K, given in Table 1. The temperature distribution is also determined by using the PIARC 8 iterative procedure, the RVS-2008 9 and RVS-2014 10 guidelines, as well as the CAMATT 12 numerical procedure solution. The numerical solution by Sturm et al. 13 is included in RVS -2014. 10
Calculation was carried out for a typical example of a road unidirectional-traffic tunnel fire case, at a flow velocity close to critical, u = v
cr
= 3 m/s, and a maximum fire heat release rate value of
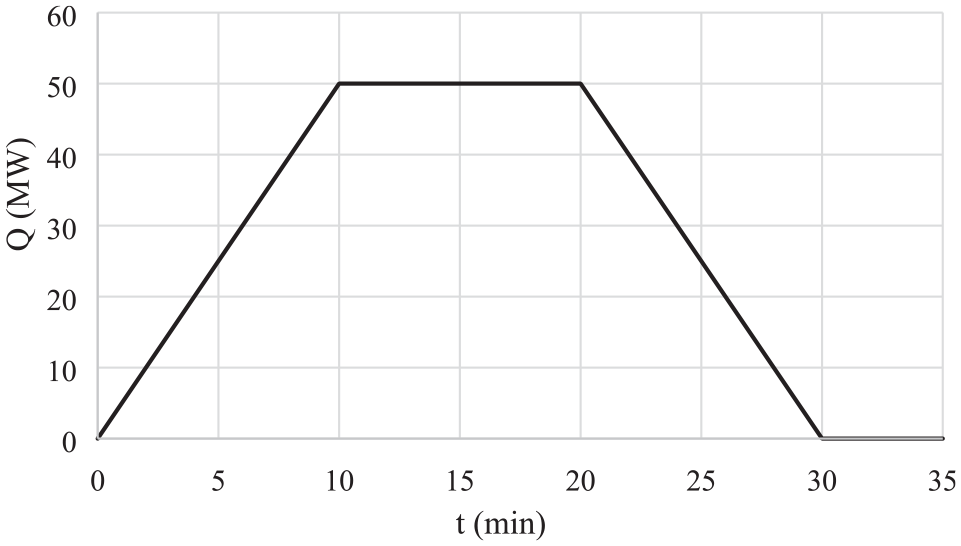
The fire heat release rate with respect to time (CETU’s Guide to road tunnel safety documentation, 36 2003).
This tunnel example is the typical two-lane unidirectional traffic road tunnels with horseshoe cross section shape. The geometrical properties of the tunnel are: length L = 2500 m, tunnel slope −3%, hydraulic diameter D h = 7.8 m, cross-sectional area A = 55 m2, cross-sectional perimeter P = 28.5 m, friction coefficient λ = 0.03, and initial temperature T0 ≈ Ta = 15°C. The average annual daily traffic is 12,000 veh/day at a vehicle speed of 100 km/h and a 15% share of heavy goods vehicles. The values used for heat conductivity, density, and specific heat of the concrete wall lining material were: k = 1.6 W/m K, ρ = 2400 kg/m3, c = 920 J/kg K, respectively.
By varying the value of the heat transfer coefficient, it turns out that the results obtained by the approximate one-dimensional methods, using h crc,m = 18 W/m2 K, and by the numerical solution computed here using CAMATT are approximately equal. The PIARC 8 iterative procedure gives h cr,m = 21.2 W/m2 K and RVS (2014) a value of h crc,m = 9.55 W/m2 K, in accordance with expression (28).
The results for the temperature distribution calculations as a function of distance from the fire site are shown in Figure 2. The referent temperature, according to the RVS-2008, 9 guidelines, is also presented.

Distribution of Tavg along the tunnel axis in the case of a fire site 1700 m ahead of tunnel exit in the example tunnel problem.
The values of the temperature distribution obtained by Ingason, 14 with h cr,m = 20 W/m2 K, by CAMATT 12 or h crc,m = 18 W/m2 K and by PIARC 8 with h crc,m = 21.2 W/m2 K are close to each other regardless of the fire-zone length. The obtained results are in accordance with the corresponding values of heat transfer coefficients hcrc,m . The temperature fields obtained by CETU 7 and RVS-201410 are much higher. Although the heat transfer coefficients according to CETU 7 and RVS-2014 10 have similar values (10 vs 9.55 W/m2 K), the results obtained by these two methods differ because they utilize different values of heat release rate that is convected along the tunnel (2/3 vs 0.75).
The referent temperature according to RVS-2008 9 represents a sort of equivalent temperature for the referent fire-zone length of L b = 800 m, cooling down to the outside ambient temperature for lengths higher than L b = 800 m.
As stated in section “A survey of the heat transfer coefficients values”, based on various experimental results, the mean value of the overall heat transfer coefficient hcrc,m should be in the range hcrc,m = 20–25 W/m2 K. Having in mind that the results by CAMATT, 12 which corresponds to hcrc,m = 18W/m2 K, are obtained without any assumptions, which would compromise the accuracy by a significant margin, we can assume that the mean value of overall heat transfer coefficient should be in the range of hcrc,m = 18–25 W/m2 K. The value proposed by PIARC 8 with hcr,m = 21.2 W/m2 K is within this range too. This means that the values proposed by CETU 7 and RVS 10 are underestimated and corresponding temperature fields overestimated.
The pressure drops due to the exerted chimney effect obtained using the aforementioned methods are presented in Figure 3 as a function of the length of the fire-affected zone.

Pressure drop due to the exerted chimney effect as a function of the fire-affected zone length in the tunnel example problem.
The values of the pressure drop due to the induced chimney effect according to Ingason, 14 PIARC, 8 and RVS-2008 9 are close to each other. They are also close to the value obtained by CAMATT, 12 for a short fire-affected zone and up to 15% lower for a longer fire-affected zone. This is in accordance with the values of temperature field presented in Figure 2.
The values by CETU 7 ‚ with the assumption of T ∞ = T a and hcrc,m = 10 W/m2 K can be much higher depending on the tunnel length, as can be seen on the diagram given in Figure 3. Taking into account both the increase in pressure drop due to the induced chimney effect and the additional reduction of fans impulse due to elevated gas temperatures, the obtained number of required fans can be considerably higher than is truly required. This method gives results with a higher safety margin, but it could lead to an oversizing of the ventilation system.
The greatest differences, compared to CAMATT 2.20, 7 Ingason, 14 PIARC, 8 and RVS-2008, 9 of the order of 70% or more for longer tunnels, are obtained by the RVS-2014 10 guidelines. These calculated values are also higher than the results obtained by the CETU 7 guidelines for hcrc,m = 10 W/m2 K. It turns out that the RVS-2014 10 guidelines can lead to a considerable oversizing of the ventilation system.
The appropriate numbers of required fans for the studied case, based on the most commonly used approaches in practical engineering: RVS-2008, 9 RVS-2014, 10 CETU, 7 and CAMATT 2.20, 12 are given in Table 4.
Required number of fans obtained by use of different methods for the example tunnel problem.
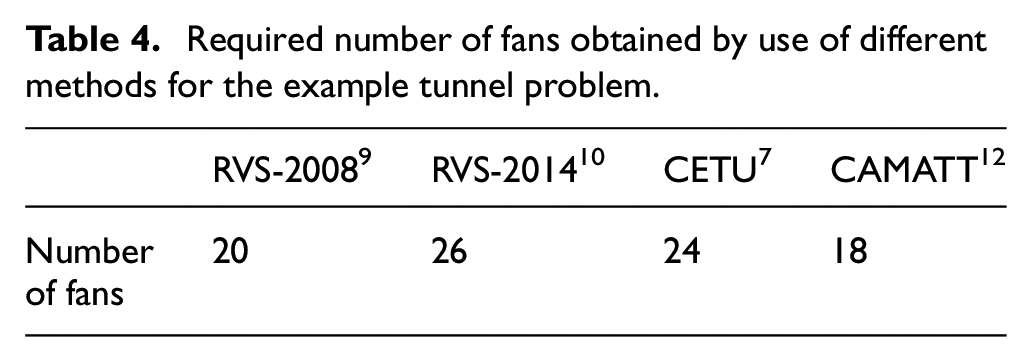
The effect of the elevated temperature along the tunnel on the reduction of the available fan thrust in the fire-affected zone is determined with the assumption of uniform spacing of the fans along the tunnel. The required number of fans is about 50% higher in case of RVS-2014 10 in comparison to the numerical solution by CAMATT. 12
Conclusions
Various sources define the heat transfer coefficient, necessary to determine one-dimensional gas average temperature distribution in a road tunnel fire, at the time instant relevant for ventilation design, in a broad range of 9–40 W/m2K, strongly affecting the chimney-effect induced pressure. This confuses, to a great extent, the designer of the tunnel ventilation systems.
Based on the presented research, the most appropriate value of the heat transfer coefficient should be in the range of 18–25 W/m2 K. The lower margin of these values is defined by use of the CAMATT numerical software. This software does not require any of the rough assumptions necessary in the derivation of the one-dimensional approximate methods. The upper margin, defined by the work of Ingason, Li, and others, is supported by experimental data.
The methods according to the PIARC and RVS-2008 guidelines give somewhat lower temperature distribution values and a lower chimney-effect pressure rise with respect to the numerical results obtained by use of CAMATT procedure. The difference grows with the length of the fire-affected zone of the tunnel. It reaches an asymptotic value of approximately 15% for lengths over 1700 m. A reduction in the predicted chimney effect pressure, together with a lower prediction for the temperature-induced drop in the fan impulse, will lead to an undersizing of the ventilation system.
The approximate method from CETU with the proposed heat transfer coefficient of 10 W/m2 K leads to oversizing of the ventilation system. Despite its simplicity and the built-in safety margin of the results, this method can lead to a significant oversizing of the ventilation system.
As a consequence of the neglecting the radiative component of the heat transfer from the gas to the tunnel wall, the values of the gas temperature distribution and the pressure rise from the chimney effect obtained by using the Austrian guidelines RVS-2014 are higher than the values from CETU, and much higher compared to the values computed using the numerical approach by CAMMAT and the approximate method by Ingason and PIARC. This, together with the error obtained when calculating the fan impulse reduction, can lead to a substantial oversizing of the ventilation system.
Footnotes
Appendix
Acknowledgements
This research is supported by the Montenegrin Academy of the Sciences and Arts and by Monteput d.o.o. Podgorica.
Handling Editor: Chenhui Liang
Declaration of conflicting interests
The author(s) declared no potential conflicts of interest with respect to the research, authorship, and/or publication of this article.
Funding
The author(s) received no financial support for the research, authorship, and/or publication of this article.